Downloaded 121 times

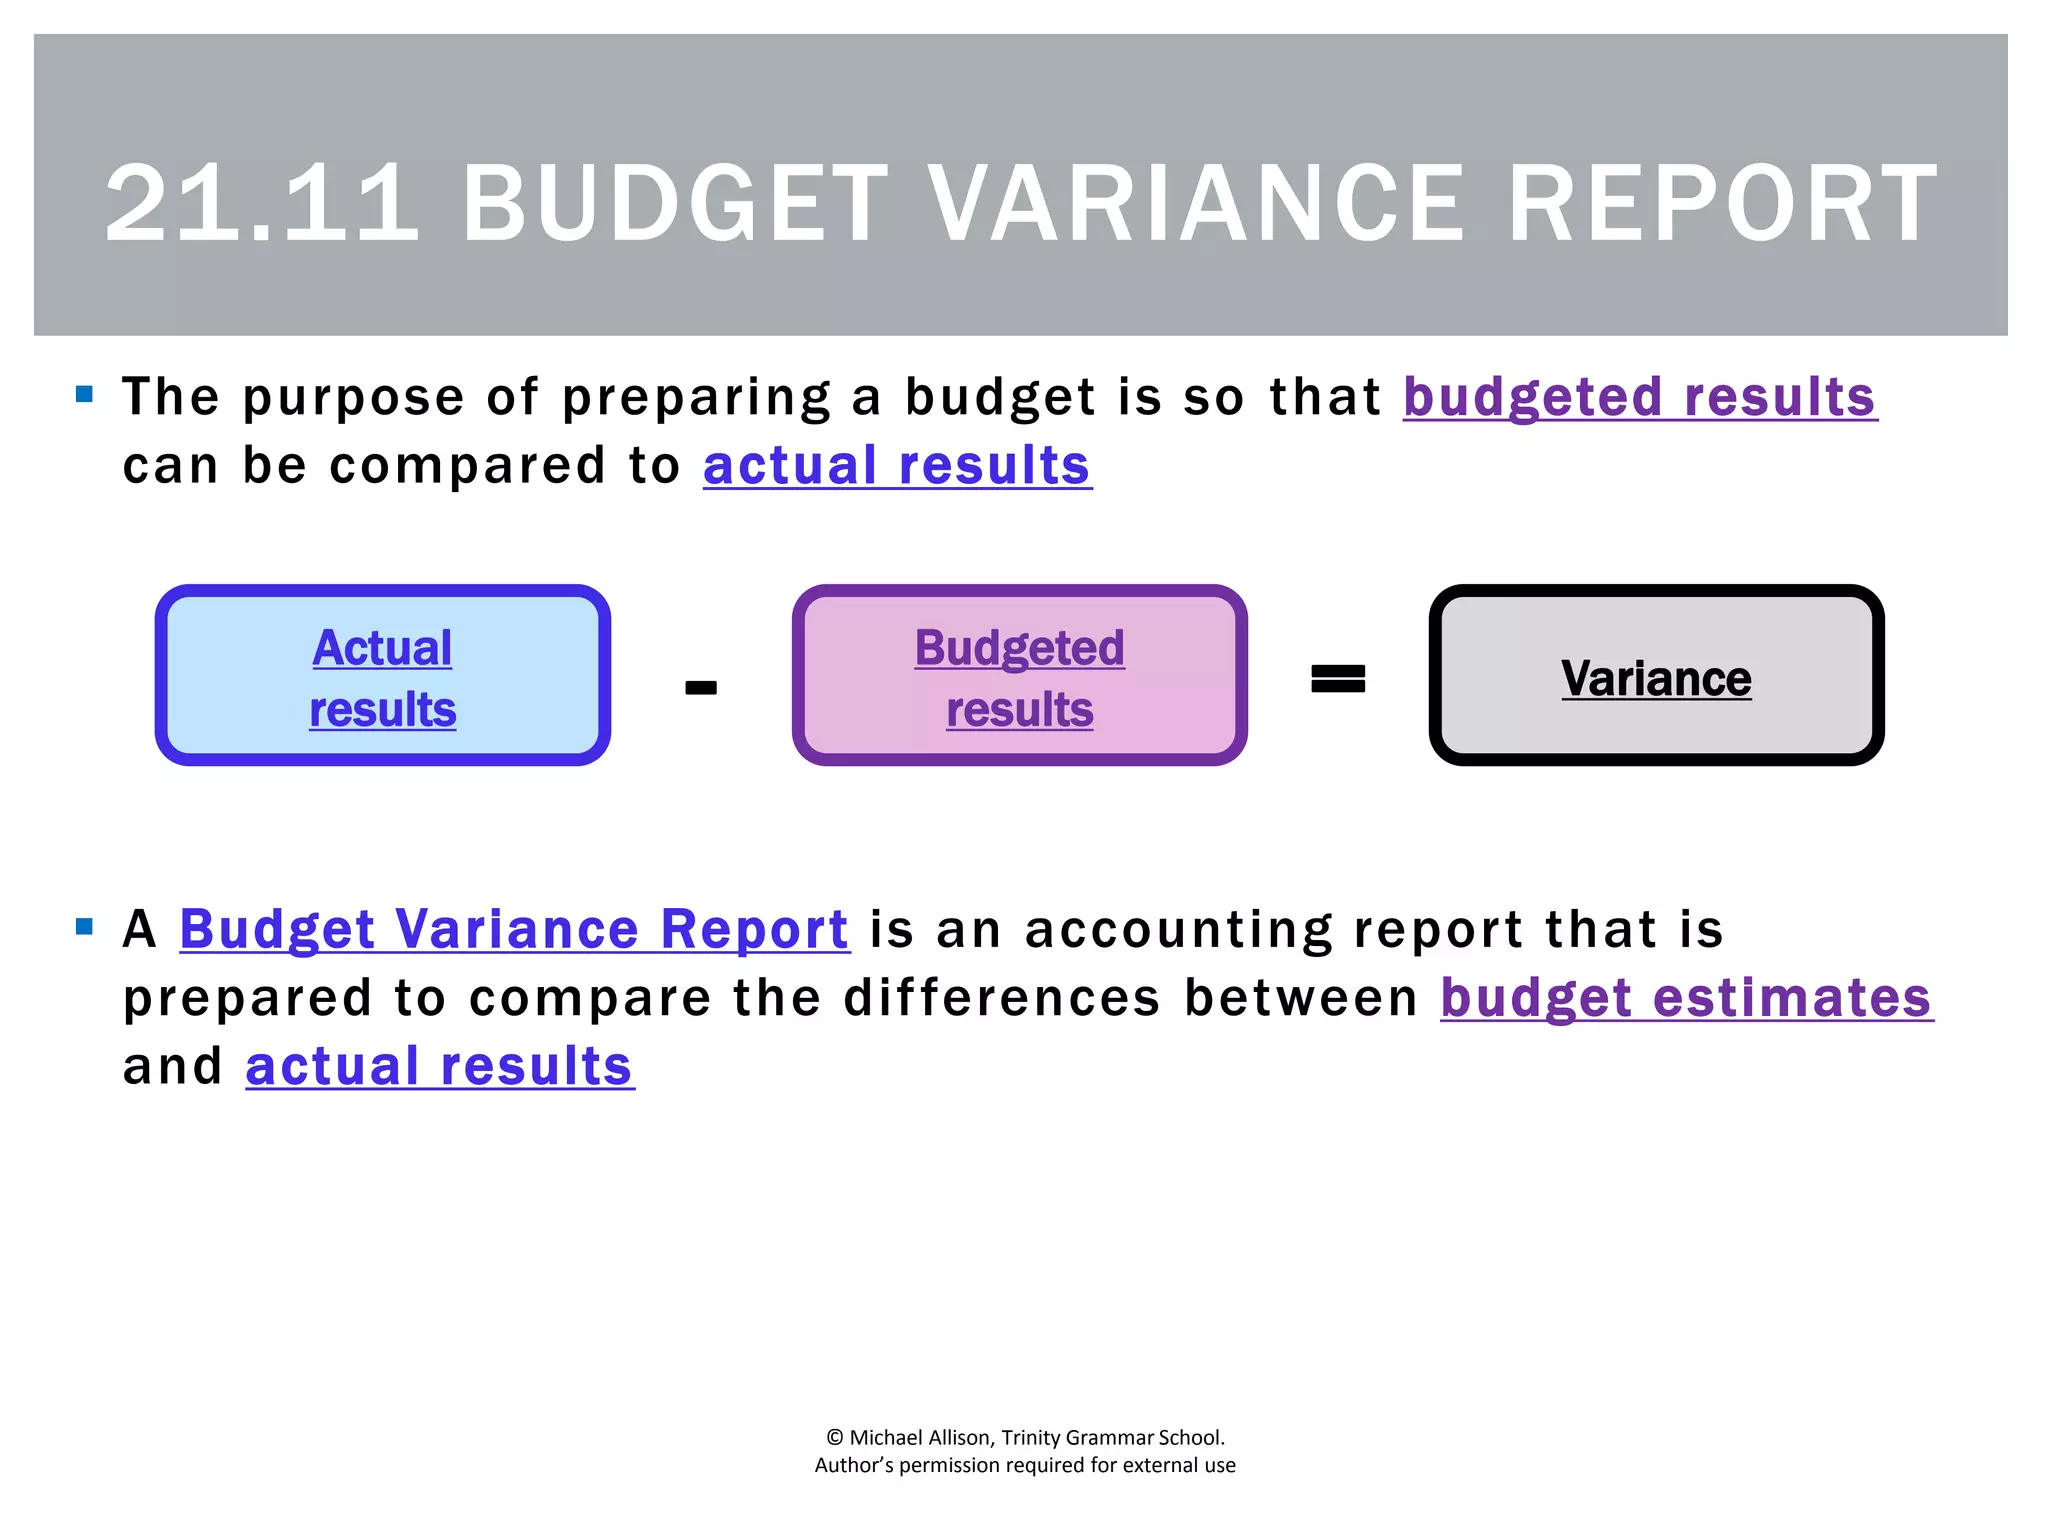


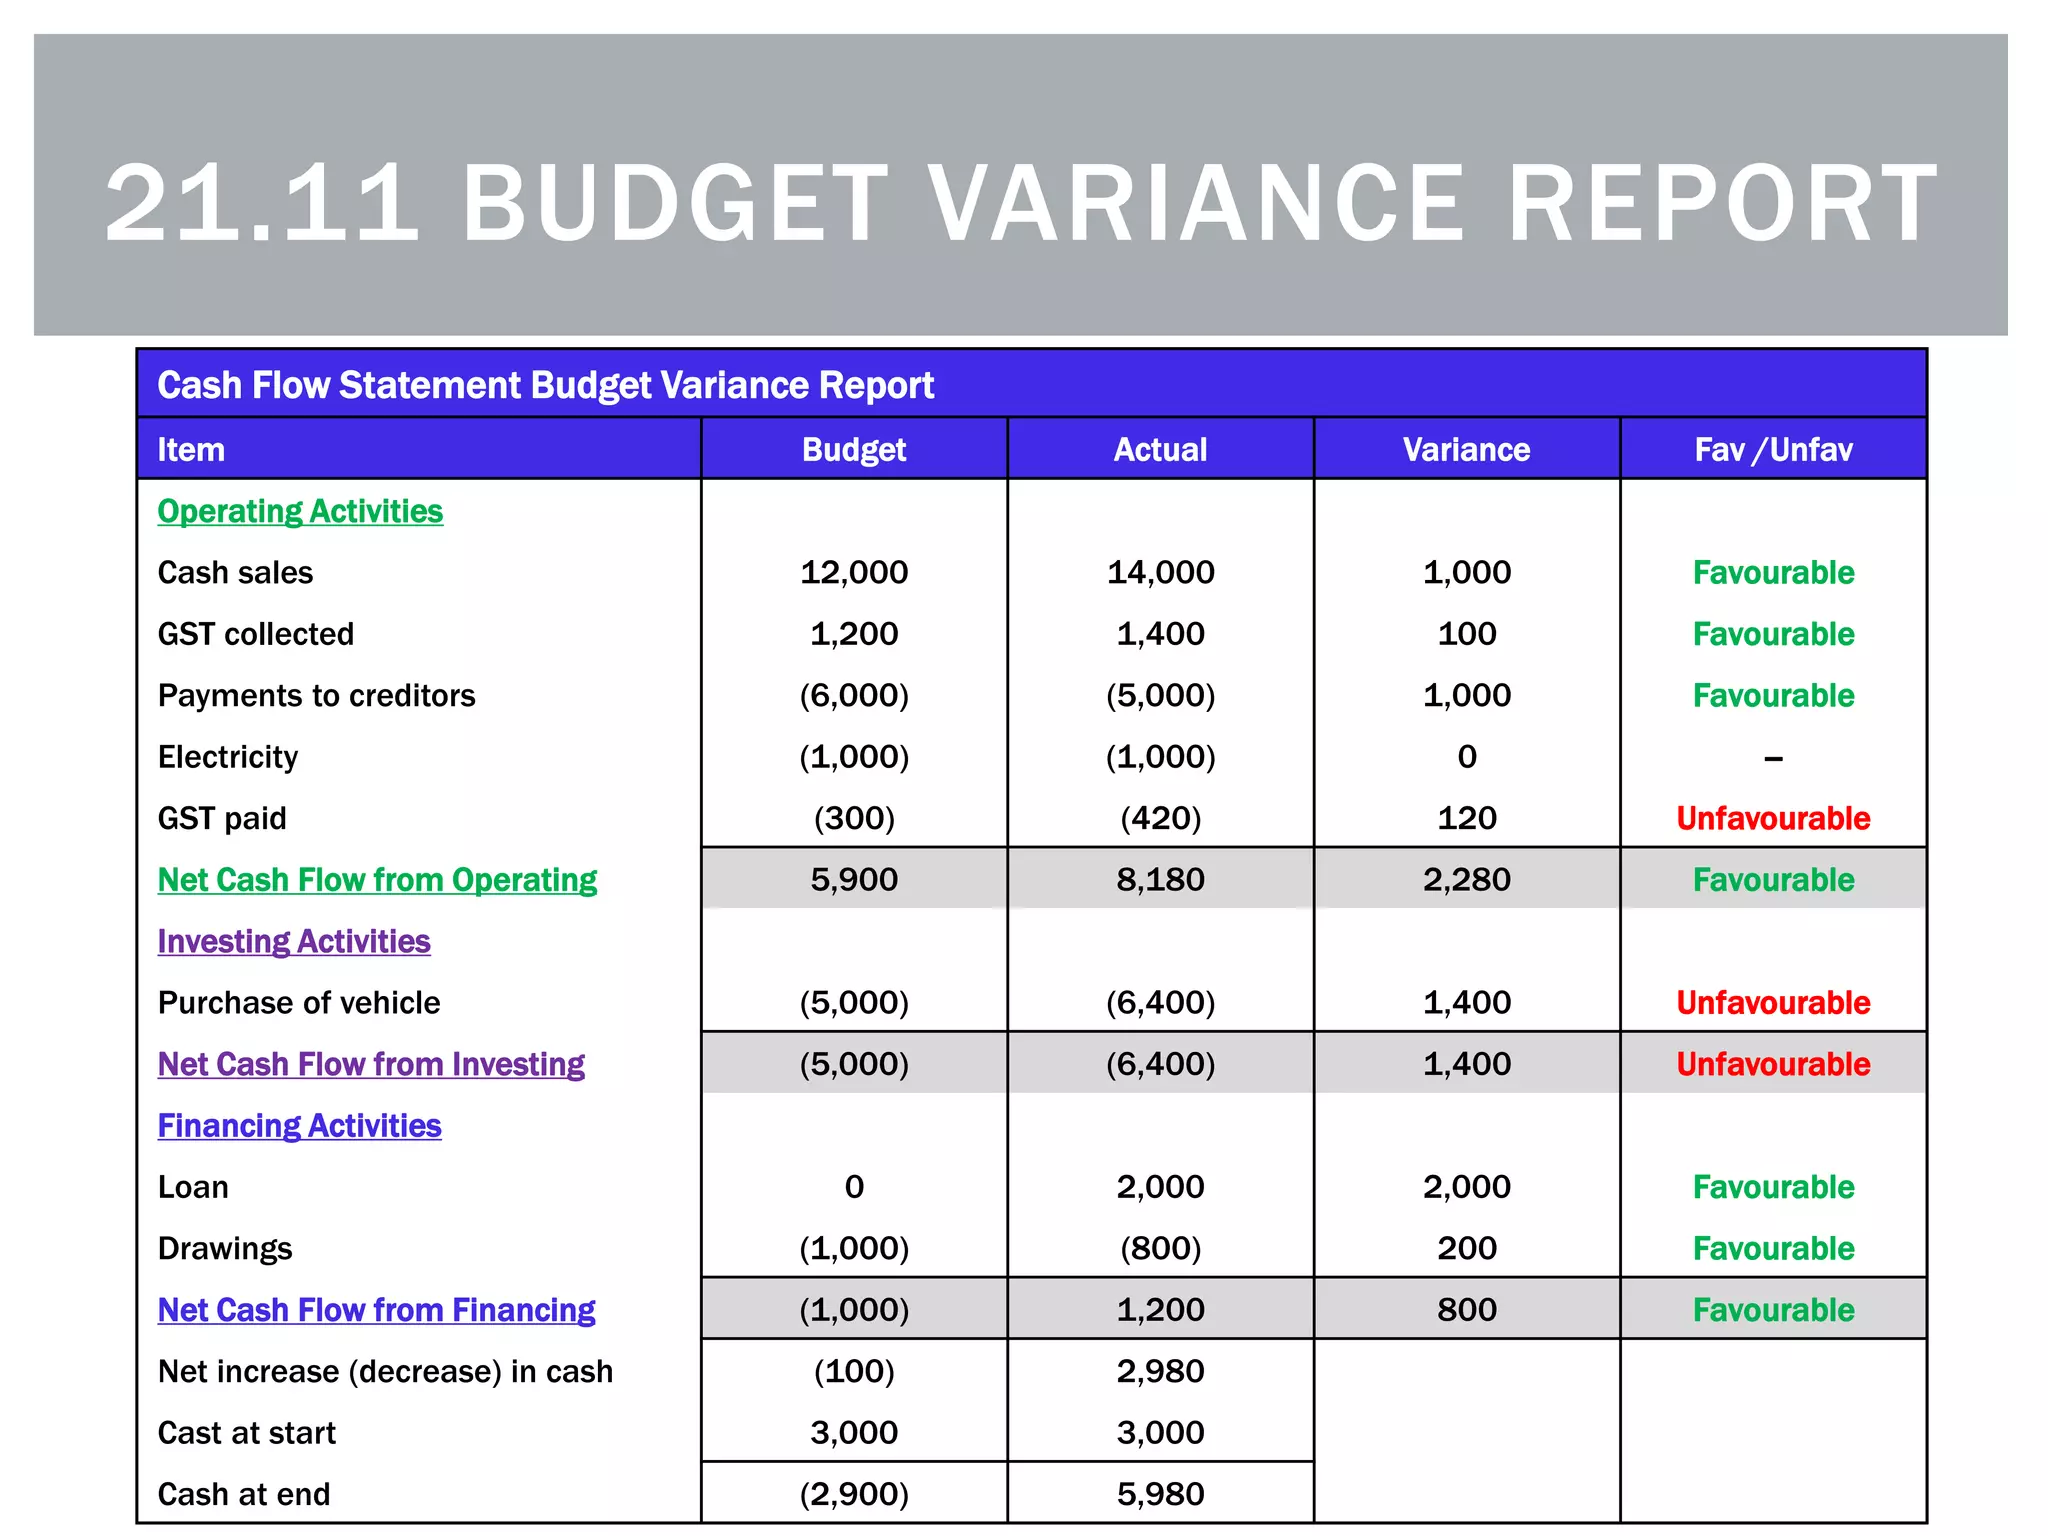


The document describes a budget variance report, which compares budgeted and actual results for various financial items. A budget variance report includes the item, budgeted amount, actual amount, variance (difference between budget and actual), and whether the variance is favorable or unfavorable. Variances are favorable when the actual result is better than budgeted and unfavorable when actual is worse. The document provides an example budget variance report for items in a cash flow statement.