
Recommended
More Related Content
What's hot
Viewers also liked
Similar to S&P500 Index Analysis
More from macavity_d_katt
More from macavity_d_katt (20)
Recently uploaded
Recently uploaded (20)
S&P500 Index Analysis
- 1. COB: Fri 14-Nov-08 Index S&P100 - $OEX IdxMatch 2723 Symbol OEX 421.34 NumCons 100 Daily 99.00% Adv Dec PUVU PUVD PDVU PDVD 10.00% 89.00% 4.00% 6.00% 3.00% 86.00% Moving Averages High/Lows BreakOuts Levels Index Above Below Index Highs Lows Net Index Highs Lows Net Highs Lows 3D -1 13.00% 87.00% 1 39.00% 1.00% 38.00% 0 1.00% 0.00% 1.00% 441.83 394.65 13D -1 13.00% 87.00% 0 3.00% 2.00% 1.00% 0 1.00% 0.00% 1.00% 482.76 394.65 55D -1 3.00% 97.00% 0 1.00% 1.00% 0.00% 0 1.00% 0.00% 1.00% 601.50 394.65 233D -1 3.00% 97.00% 0 1.00% 1.00% 0.00% 0 0.00% 0.00% 0.00% 700.24 394.65 Weekly 100.00% Adv Dec PUVU PUVD PDVU PDVD 11.00% 89.00% 10.00% 1.00% 60.00% 29.00% Moving Averages High/Lows Index Above Below Index Highs Lows Net 13W -1 3.00% 97.00% -1 1.00% 32.00% (31.00%) 55W -1 3.00% 97.00% -1 1.00% 31.00% (30.00%) 233W -1 13.00% 87.00% -1 1.00% 26.00% (25.00%)
- 2. COB: Fri 14-Nov-08 Index Nasdaq100 - $NDX IdxMatch 2603 Symbol NDX--X 1179.63 NumCons 100 Daily 99.00% Adv Dec PUVU PUVD PDVU PDVD 8.00% 91.00% 3.00% 5.00% 9.00% 82.00% Moving Averages High/Lows BreakOuts Levels Index Above Below Index Highs Lows Net Index Highs Lows Net Highs Lows 3D -1 14.00% 86.00% 0 32.00% 3.00% 29.00% 0 4.00% 2.00% 2.00% 1240.93 1109.89 13D -1 13.00% 87.00% 0 6.00% 2.00% 4.00% 0 0.00% 1.00% (1.00%) 1382.65 1109.89 55D -1 8.00% 92.00% 0 0.00% 2.00% (2.00%) 0 0.00% 1.00% (1.00%) 1912.72 1109.89 233D -1 4.00% 96.00% 0 0.00% 2.00% (2.00%) 0 0.00% 1.00% (1.00%) 2141.08 1109.89 Weekly 98.00% Adv Dec PUVU PUVD PDVU PDVD 10.00% 88.00% 8.00% 2.00% 46.00% 42.00% Moving Averages High/Lows Index Above Below Index Highs Lows Net 13W -1 8.00% 92.00% -1 1.00% 47.00% (46.00%) 55W -1 4.00% 96.00% -1 0.00% 47.00% (47.00%) 233W -1 11.00% 89.00% -1 0.00% 31.00% (31.00%)
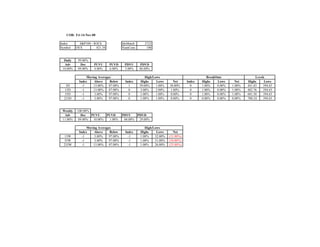
- 3. COB: Fri 14-Nov-08 Index S&P500 - $SPX IdxMatch 3476 Symbol SP-500 873.29 NumCons 500 Daily 99.40% Adv Dec PUVU PUVD PDVU PDVD 7.40% 92.00% 2.80% 4.60% 7.80% 84.20% Moving Averages High/Lows BreakOuts Levels Index Above Below Index Highs Lows Net Index Highs Lows Net Highs Lows 3D -1 12.60% 87.40% 0 31.80% 3.80% 28.00% 0 2.20% 1.60% 0.60% 916.88 818.69 13D -1 14.00% 86.00% 0 5.00% 3.00% 2.00% 0 0.60% 1.00% (0.40%) 1007.51 818.69 55D -1 5.20% 94.80% 0 0.40% 2.20% (1.80%) 0 0.20% 1.00% (0.80%) 1303.04 818.69 233D -1 2.60% 97.40% 0 0.20% 2.20% (2.00%) 0 0.00% 1.00% (1.00%) 1498.85 818.69 Weekly 99.80% Adv Dec PUVU PUVD PDVU PDVD 11.40% 88.40% 8.60% 2.80% 55.60% 32.80% Moving Averages High/Lows Index Above Below Index Highs Lows Net 13W -1 4.60% 95.40% -1 0.60% 37.00% (36.40%) 55W -1 2.60% 97.40% -1 0.40% 35.80% (35.40%) 233W -1 8.80% 91.20% -1 0.40% 26.80% (26.40%)
- 4. COB: Fri 14-Nov-08 Index Russell1000 - $RUI IdxMatch 3261 Symbol RUI-X 469.03 NumCons 988 Daily 99.80% Adv Dec PUVU PUVD PDVU PDVD 6.58% 93.22% 2.53% 4.05% 11.34% 81.88% Moving Averages High/Lows BreakOuts Levels Index Above Below Index Highs Lows Net Index Highs Lows Net Highs Lows 3D -1 13.77% 86.23% 0 29.45% 5.26% 24.19% 0 1.92% 3.24% (1.32%) 492.16 439.90 13D -1 13.36% 86.64% 0 4.45% 4.05% 0.40% 0 0.30% 2.23% (1.92%) 542.68 439.90 55D -1 5.26% 94.74% 0 0.30% 3.04% (2.73%) 0 0.10% 1.72% (1.62%) 712.48 439.90 233D -1 2.94% 97.06% 0 0.10% 3.04% (2.94%) 0 0.00% 1.72% (1.72%) 816.25 439.90 Weekly 99.80% Adv Dec PUVU PUVD PDVU PDVD 11.64% 88.16% 8.30% 3.34% 53.85% 34.31% Moving Averages High/Lows Index Above Below Index Highs Lows Net 13W -1 4.66% 95.34% -1 0.40% 36.44% (36.03%) 55W -1 2.94% 97.06% -1 0.20% 34.82% (34.62%) 233W -1 8.20% 91.80% -1 0.20% 25.40% (25.20%)
- 5. COB: Fri 14-Nov-08 Index Russell2000 - $RUT IdxMatch 3264 Symbol RUT-X 456.53 NumCons 1942 Daily 99.23% Adv Dec PUVU PUVD PDVU PDVD 5.10% 94.13% 1.91% 3.19% 14.83% 79.25% Moving Averages High/Lows BreakOuts Levels Index Above Below Index Highs Lows Net Index Highs Lows Net Highs Lows 3D -1 9.17% 90.83% 0 18.59% 11.79% 6.80% 0 1.08% 8.91% (7.83%) 491.71 433.35 13D -1 10.56% 89.44% 0 2.83% 9.17% (6.33%) 0 0.21% 6.59% (6.39%) 551.02 433.35 55D -1 6.59% 93.41% 0 0.36% 7.52% (7.16%) 0 0.00% 5.36% (5.36%) 761.78 433.35 233D -1 6.64% 93.36% 0 0.10% 6.95% (6.85%) 0 0.00% 4.84% (4.84%) 799.57 433.35 Weekly 99.85% Adv Dec PUVU PUVD PDVU PDVD 10.20% 89.65% 5.66% 4.53% 48.97% 40.68% Moving Averages High/Lows Index Above Below Index Highs Lows Net 13W -1 5.72% 94.28% -1 0.98% 39.86% (38.88%) 55W -1 6.59% 93.41% -1 0.57% 36.35% (35.79%) 233W -1 11.17% 88.83% -1 0.15% 27.96% (27.81%)
- 6. COB: Fri 14-Nov-08 Index Russell3000 - $RUA IdxMatch 3260 Symbol RUA-X 498.68 NumCons 2930 Daily 99.42% Adv Dec PUVU PUVD PDVU PDVD 5.60% 93.82% 2.12% 3.48% 13.69% 80.10% Moving Averages High/Lows BreakOuts Levels Index Above Below Index Highs Lows Net Index Highs Lows Net Highs Lows 3D -1 10.72% 89.28% 0 22.25% 9.62% 12.63% 0 1.37% 7.03% (5.67%) 523.46 468.13 13D -1 11.47% 88.53% 0 3.38% 7.44% (4.06%) 0 0.24% 5.12% (4.88%) 578.42 468.13 55D -1 6.11% 93.89% 0 0.34% 6.01% (5.67%) 0 0.03% 4.13% (4.10%) 762.54 468.13 233D -1 5.36% 94.64% 0 0.10% 5.63% (5.53%) 0 0.00% 3.79% (3.79%) 868.17 468.13 Weekly 99.83% Adv Dec PUVU PUVD PDVU PDVD 10.68% 89.15% 6.55% 4.13% 50.61% 38.53% Moving Averages High/Lows Index Above Below Index Highs Lows Net 13W -1 5.32% 94.68% -1 0.78% 38.70% (37.92%) 55W -1 5.32% 94.68% -1 0.44% 35.84% (35.39%) 233W -1 10.14% 89.86% -1 0.17% 27.10% (26.93%)
- 7. COB: Fri 14-Nov-08 Index S&P400 - $MID IdxMatch 2459 Symbol MID--X 497.52 NumCons 399 Daily 99.75% Adv Dec PUVU PUVD PDVU PDVD 5.01% 94.74% 1.50% 3.51% 14.54% 80.20% Moving Averages High/Lows BreakOuts Levels Index Above Below Index Highs Lows Net Index Highs Lows Net Highs Lows 3D -1 14.29% 85.71% 0 31.33% 4.76% 26.57% 0 1.75% 3.26% (1.50%) 525.52 467.64 13D -1 14.04% 85.96% 0 5.01% 4.51% 0.50% 0 0.25% 3.01% (2.76%) 583.55 467.64 55D -1 7.77% 92.23% 0 0.25% 4.01% (3.76%) 0 0.00% 2.51% (2.51%) 826.86 467.64 233D -1 5.01% 94.99% 0 0.00% 4.01% (4.01%) 0 0.00% 2.51% (2.51%) 897.37 467.64 Weekly 99.75% Adv Dec PUVU PUVD PDVU PDVD 13.03% 86.72% 9.52% 3.51% 54.89% 31.83% Moving Averages High/Lows Index Above Below Index Highs Lows Net 13W -1 6.52% 93.48% -1 0.50% 38.10% (37.59%) 55W -1 5.01% 94.99% -1 0.25% 36.09% (35.84%) 233W -1 9.02% 90.98% -1 0.00% 28.32% (28.32%)
- 8. COB: Fri 14-Nov-08 Index S&P600 - $SML IdxMatch 3438 Symbol SML--X 245.36 NumCons 599 Daily 99.50% Adv Dec PUVU PUVD PDVU PDVD 4.84% 94.66% 2.17% 2.67% 16.19% 78.46% Moving Averages High/Lows BreakOuts Levels Index Above Below Index Highs Lows Net Index Highs Lows Net Highs Lows 3D -1 9.02% 90.98% 0 22.37% 10.02% 12.35% 0 0.83% 7.51% (6.68%) 262.61 232.19 13D -1 9.52% 90.48% 0 4.01% 8.85% (4.84%) 0 0.50% 6.01% (5.51%) 294.40 232.19 55D -1 6.84% 93.16% 0 0.67% 8.35% (7.68%) 0 0.00% 5.68% (5.68%) 401.27 232.19 233D -1 7.18% 92.82% 0 0.17% 7.85% (7.68%) 0 0.00% 5.18% (5.18%) 410.52 232.19 Weekly 99.33% Adv Dec PUVU PUVD PDVU PDVD 9.02% 90.32% 5.68% 3.34% 49.58% 40.73% Moving Averages High/Lows Index Above Below Index Highs Lows Net 13W -1 6.18% 93.82% -1 1.00% 41.24% (40.23%) 55W -1 7.18% 92.82% -1 0.17% 36.56% (36.39%) 233W -1 10.18% 89.82% -1 0.00% 26.38% (26.38%)