
Recommended
More Related Content
What's hot
What's hot (20)
Similar to L34 data representation, ascan, b scan, c-scan.
Similar to L34 data representation, ascan, b scan, c-scan. (20)
More from karthi keyan
More from karthi keyan (20)
Recently uploaded
Recently uploaded (20)
L34 data representation, ascan, b scan, c-scan.
- 1. M.KARTHIKEYAN ASSISTANT PROFESSOR DEPARTMENT OF MECHANICAL ENGINEERING AAA COLLEGE OF ENGINEERING & TECHNOLOGY, SIVAKASI karthikeyan@aaacet.ac.in ME8097 NON DESTRUCTIVE TESTING AND EVALUATION
- 2. UNIT IV ULTRASONIC TESTING (UT) AND ACOUSTIC EMISSION (AE) 1. Ultrasonic Testing-Principle, 2. Transducers, 3. Transmission and pulse-echo method, 4. Straight beam and angle beam, 5. Instrumentation, 6. Data representation, A/Scan, B-scan, C-scan. 7. Phased Array Ultrasound, Time of Flight Diffraction. 8. Acoustic Emission Technique – Principle, 9. AE parameters, Applications
- 3. DATA REPRESENTATION 1. A-Scan, 2. B-scan, 3. C-scan.
- 4. DATA REPRESENTATION Ultrasonic data can be collected and displayed in a number of different formats. The three most common formats are know in the NDT world as A-scan, B-scan and C-scan presentations. Each presentation mode provides a different way of looking at and evaluating the region of material being inspected. Modern computerized ultrasonic scanning systems can display data in all three presentation forms simultaneously.
- 5. A-Scan Presentation • The A-scan presentation displays the amount of received ultrasonic energy as a function of time. • The relative amount of received energy is plotted along the vertical axis and the elapsed time (which may be related to the sound energy travel time within the material) is displayed along the horizontal axis. • Most instruments with an A-scan display allow the signal to be displayed in its natural radio frequency form (RF), as a fully rectified RF signal, or as either the positive or negative half of the RF signal. In the A-scan presentation, relative discontinuity size can be estimated by comparing the signal amplitude obtained from an unknown reflector to that from a known reflector. • Reflector depth can be determined by the position of the signal on the horizontal sweep.
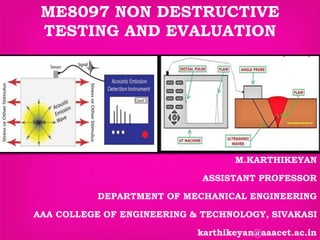
- 7. • In the illustration of the A-scan presentation to the right, the initial pulse generated by the transducer is represented by the signal IP, which is near time zero. • As the transducer is scanned along the surface of the part, four other signals are likely to appear at different times on the screen. • When the transducer is in its far left position, only the IP signal and signal A, the sound energy reflecting from surface A, will be seen on the trace. • As the transducer is scanned to the right, a signal from the backwall BW will appear later in time, showing that the sound has traveled farther to reach this surface.
- 8. • When the transducer is over flaw B, signal B will appear at a point on the time scale that is approximately halfway between the IP signal and the BW signal. • Since the IP signal corresponds to the front surface of the material, this indicates that flaw B is about halfway between the front and back surfaces of the sample. • When the transducer is moved over flaw C, signal C will appear earlier in time since the sound travel path is shorter and signal B will disappear since sound will no longer be reflecting from it.
- 9. B-Scan Presentation The B-scan presentations is a profile (cross-sectional) view of the test specimen. In the B-scan, the time-of-flight (travel time) of the sound energy is displayed along the vertical axis and the linear position of the transducer is displayed along the horizontal axis. From the B-scan, the depth of the reflector and its approximate linear dimensions in the scan direction can be determined. The B-scan is typically produced by establishing a trigger gate on the A-scan. Whenever the signal intensity is great enough to trigger the gate, a point is produced on the B-scan.
- 10. • The gate is triggered by the sound reflecting from the backwall of the specimen and by smaller reflectors within the material. • In the B-scan image above, line A is produced as the transducer is scanned over the reduced thickness portion of the specimen. • When the transducer moves to the right of this section, the backwall line BW is produced. • When the transducer is over flaws B and C, lines that are similar to the length of the flaws and at similar depths within the material are drawn on the B-scan. • It should be noted that a limitation to this display technique is that reflectors may be masked by larger reflectors near the surface.
- 12. C-Scan Presentation • The C-scan presentation provides a plan-type view of the location and size of test specimen features. • The plane of the image is parallel to the scan pattern of the transducer. • C-scan presentations are produced with an automated data acquisition system, such as a computer controlled immersion scanning system. • The relative signal amplitude or the time-of-flight is displayed as a shade of gray or a color for each of the positions where data was recorded. • The C-scan presentation provides an image of the features that reflect and scatter the sound within and on the surfaces of the test piece.
- 14. The piezoelectric material in a search unit which vibrates to produce ultrasonic waves is called: (a) A backing material (b) A lucite wedge (c) A transducer element or crystal (d) A couplant MCQ - 1
- 15. A common use of ultrasonic testing is: (a) Cleaning (b) Detecting of sub-surface indications (c) Determination of the test piece ductility (d) Communications MCQ - 2
- 16. Which of the following circuits converts electrical energy to ultrasonic energy? (a) The pulse generator (b) The transducer (c) The transformer (d) The power supply MCQ - 3
- 17. In ultrasonic testing, a liquid coupling medium between the crystal surface and the part surface is necessary because : (a) Lubricant is required to minimize wear on the crystal surface (b) An air interface between the crystal surface and the part surface would almost completely reflect the ultrasonic vibrations (c) The crystal will not vibrate if placed directly in contact with the surface of the part being inspected (d) The liquid is necessary to complete the electrical circuit in the search unit MCQ - 4
- 18. A technique in which two transducers are used, one on each side of the test piece, is called: (a) Angle beam testing (b) Modified immersion testing (c) Through transmission testing (d) Twinning MCQ - 5