IRJET- GIS based Road Safety Audit of State Highways in Thrissur
•
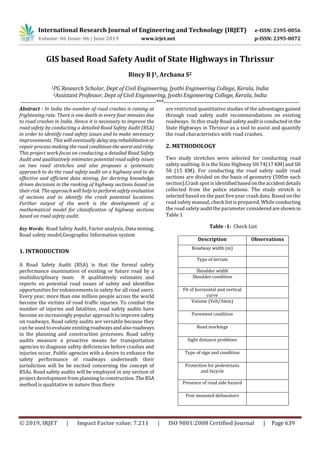
0 likes•40 views

https://www.irjet.net/archives/V6/i6/IRJET-V6I6198.pdf
![International Research Journal of Engineering and Technology (IRJET) e-ISSN: 2395-0056
Volume: 06 Issue: 06 | June 2019 www.irjet.net p-ISSN: 2395-0072
© 2019, IRJET | Impact Factor value: 7.211 | ISO 9001:2008 Certified Journal | Page 640
Parking
Street light
Speed(kmph)
No of curve
No.of intersection
Accident number
3. STUDY AREA
In order to find out the deficiencies in the roadstretcha road
safety inspection is conducted on the two study stretches
were selected for conducting road safety auditing. It is the
State Highway SH 74(17 KM) and SH 50 (15 KM). Recent
crash data shows that occurrence of accident in these road
stretch is very high. highway 74.Vazhakode to Pazhayannur
is a State Highway in Kerala that starts in Vazhakode and
ends in Alathur. This road connects important towns
Chelakkara and Pazhayannur. The study stretchsisof17 Km
road stretch. For conducting the road safety audit road
sections are divided into different section on the basis of
geometry (500m each section).Crash spotisidentified based
on the accident details collected from the police stations.
This is a road stretch with a number of horizontal and
vertical curves and combined curves. Since crashes in this
road stretch is high, therefore it is selected as one of the
study area.
Ottupara to Vellarakkad is another State Highway in Kerala,
that starts in ChavakkadandendsinWadakkanchery. Recent
crash data shows that crashes on this road stretch is very
high, hence 15 Km roadstretchfromOttupara toVellarakkad
is choosen as the study area. Road Safety Inspections (RSI)
are carried out to identify traffic hazards related to the road
environment characteristics and propose interventions to
mitigate the detected hazardsanddoneundertheguidelines
of IRC codes [17].
3.1 Road Inventory Survey
Through the data collection all the relevant in
formations are collected. For this project the data is mainly
collected from two sources. Thatisthecrashdata iscollected
from the police station and the primary data is collected
through road inventory survey. Road Safety Inspections are
carried out to identify traffic hazards related to the road
environment characteristics and propose interventions to
mitigate the detected hazards. Data is collected on the basis
of prepared checklist.
4. DATA TRANSFORMATION
Data transformation is the process of converts the data into
appropriateforms forconducting analysis. The data set used
in the study contain both continous values and discrete
values. There for the discrete values has to be classified
accordingly, which is shown in Table 5.4 The table shows the
classification values for the corresponding attributes.
Table -2: Description and type of variables
Attribute Description Rating
Width of road Width of road (m) Continuous
Shoulder width Width of shoulder(m) Continuous
Horizontal and
vertical
Curves
Expressed in numbers Continuous
Street light Expressed in numbers Continuous
Traffic
volume(Veh/3
Min)
1 = With in limit,
2 = Exceeded limit
Discrete
Visibility 1 = Proper,
2 = Poor
Discrete
Fitness of
horizontal and
vertical curve
0 = No curve,
1 = Good fit,
2 = Very sharp curve, 3 =
Sharp bend immediately
after summit curve / Sag
curve with bend
Discrete
Speed Expressed in m/s Continuous
Presence of road
side hazard
1 = No obstruction,
2 = Fixed objects/ road
side stalls,
3 = Poles/ column, trees
in hazardous condition
Discrete
Pavement
Characteris-
Tics
1 = Smooth condition, 2
= Relatively smooth,
slight break and rut,
3 = Rough, breaks, rut,
potholes,
4 = Rough, severe
breakage, rut, pot holes
Discrete
Intersection 0 = No intersection,
1 = Single minor road, 2
= Two minor/ Single
major road,
3 = Two major road
Discrete
Pavement
markings
1 = Proper,
2 = Partially removed,
3= Completely remove
Discrete
Sign boards 1 = Proper,
2 = Faded sign boards 3
= Not provided where
traffic is high,
4 = No warning at
hazardous situations
Discrete](data:image/gif;base64,R0lGODlhAQABAIAAAAAAAP///yH5BAEAAAAALAAAAAABAAEAAAIBRAA7)
Recommended
Recommended
More Related Content
What's hot
What's hot (20)
Similar to IRJET- GIS based Road Safety Audit of State Highways in Thrissur
Similar to IRJET- GIS based Road Safety Audit of State Highways in Thrissur (20)
More from IRJET Journal
More from IRJET Journal (20)
Recently uploaded
Recently uploaded (20)
IRJET- GIS based Road Safety Audit of State Highways in Thrissur
- 1. International Research Journal of Engineering and Technology (IRJET) e-ISSN: 2395-0056 Volume: 06 Issue: 06 | June 2019 www.irjet.net p-ISSN: 2395-0072 © 2019, IRJET | Impact Factor value: 7.211 | ISO 9001:2008 Certified Journal | Page 639 GIS based Road Safety Audit of State Highways in Thrissur Bincy B J1, Archana S2 1PG Research Scholar, Dept of Civil Engineering, Jyothi Engineering College, Kerala, India 2Assistant Professor, Dept of Civil Engineering, Jyothi Engineering College, Kerala, India ---------------------------------------------------------------------***--------------------------------------------------------------------- Abstract - In India the number of road crashes is raising at frightening rate. There is one death in every four minutes due to road crashes in India. Hence it is necessary to improve the road safety by conducting a detailed Road Safety Audit (RSA) in order to identify road safety issues and to make necessary improvements. This will eventually delay anyrehabilitation or repair process making the road conditionstheworstandrisky. This project work focus on conducting a detailed Road Safety Audit and qualitatively estimates potential road safety issues on two road stretches and also proposes a systematic approach to do the road safety audit on a highway and to do effective and efficient data mining, for deriving knowledge driven decisions in the ranking of highway sections based on their risk. The approach will help to perform safetyevaluation of sections and to identify the crash potential locations. Further output of the work is the development of a mathematical model for classification of highway sections based on road safety audit. Key Words: Road Safety Audit, Factor analysis, Data mining, Road safety model,Geographic Information system 1. INTRODUCTION A Road Safety Audit (RSA) is that the formal safety performance examination of existing or future road by a multidisciplinary team. It qualitatively estimates and reports on potential road issues of safety and identifies opportunities for enhancements in safety for all road users. Every year, more than one million people across the world become the victims of road traffic injuries. To combat the number of injuries and fatalities, road safety audits have become an increasingly popular approach to improve safety on roadways. Road safety audits are versatile because they can be used to evaluateexistingroadwaysandalsoroadways in the planning and construction processes. Road safety audits measure a proactive means for transportation agencies to diagnose safety deficiencies before crashes and injuries occur. Public agencies with a desire to enhance the safety performance of roadways underneath their jurisdiction will be be excited concerning the concept of RSAs. Road safety audits will be employed in any section of project development fromplanningtoconstruction. The RSA method is qualitative in nature thus there are restricted quantitative studies of the advantages gained through road safety audit recommendations on existing roadways. In this study Road safety auditisconductedinthe State Highways in Thrissur as a tool to assist and quantify the road characteristics with road crashes. 2. METHODOLOGY Two study stretches were selected for conducting road safety auditing. It is the State Highway SH 74(17 KM)and SH 50 (15 KM). For conducting the road safety audit road sections are divided on the basis of geometry (500m each section).Crash spot is identifiedbasedontheaccidentdetails collected from the police stations. The study stretch is selected based on the past five year crash data. Based on the road safety manual, check list is prepared. While conducting the road safety audit the parameter consideredareshown in Table 1 Table -1: Check List Description Observations Roadway width (m) Type of terrain Shoulder width Shoulder condition Fit of horizontal and vertical curve Volume (Veh/3min) Pavement condition Road markings Sight distance problems Type of sign and condition Protection for pedestrians and bicycle Presence of road side hazard Post mounted delineators
- 2. International Research Journal of Engineering and Technology (IRJET) e-ISSN: 2395-0056 Volume: 06 Issue: 06 | June 2019 www.irjet.net p-ISSN: 2395-0072 © 2019, IRJET | Impact Factor value: 7.211 | ISO 9001:2008 Certified Journal | Page 640 Parking Street light Speed(kmph) No of curve No.of intersection Accident number 3. STUDY AREA In order to find out the deficiencies in the roadstretcha road safety inspection is conducted on the two study stretches were selected for conducting road safety auditing. It is the State Highway SH 74(17 KM) and SH 50 (15 KM). Recent crash data shows that occurrence of accident in these road stretch is very high. highway 74.Vazhakode to Pazhayannur is a State Highway in Kerala that starts in Vazhakode and ends in Alathur. This road connects important towns Chelakkara and Pazhayannur. The study stretchsisof17 Km road stretch. For conducting the road safety audit road sections are divided into different section on the basis of geometry (500m each section).Crash spotisidentified based on the accident details collected from the police stations. This is a road stretch with a number of horizontal and vertical curves and combined curves. Since crashes in this road stretch is high, therefore it is selected as one of the study area. Ottupara to Vellarakkad is another State Highway in Kerala, that starts in ChavakkadandendsinWadakkanchery. Recent crash data shows that crashes on this road stretch is very high, hence 15 Km roadstretchfromOttupara toVellarakkad is choosen as the study area. Road Safety Inspections (RSI) are carried out to identify traffic hazards related to the road environment characteristics and propose interventions to mitigate the detected hazardsanddoneundertheguidelines of IRC codes [17]. 3.1 Road Inventory Survey Through the data collection all the relevant in formations are collected. For this project the data is mainly collected from two sources. Thatisthecrashdata iscollected from the police station and the primary data is collected through road inventory survey. Road Safety Inspections are carried out to identify traffic hazards related to the road environment characteristics and propose interventions to mitigate the detected hazards. Data is collected on the basis of prepared checklist. 4. DATA TRANSFORMATION Data transformation is the process of converts the data into appropriateforms forconducting analysis. The data set used in the study contain both continous values and discrete values. There for the discrete values has to be classified accordingly, which is shown in Table 5.4 The table shows the classification values for the corresponding attributes. Table -2: Description and type of variables Attribute Description Rating Width of road Width of road (m) Continuous Shoulder width Width of shoulder(m) Continuous Horizontal and vertical Curves Expressed in numbers Continuous Street light Expressed in numbers Continuous Traffic volume(Veh/3 Min) 1 = With in limit, 2 = Exceeded limit Discrete Visibility 1 = Proper, 2 = Poor Discrete Fitness of horizontal and vertical curve 0 = No curve, 1 = Good fit, 2 = Very sharp curve, 3 = Sharp bend immediately after summit curve / Sag curve with bend Discrete Speed Expressed in m/s Continuous Presence of road side hazard 1 = No obstruction, 2 = Fixed objects/ road side stalls, 3 = Poles/ column, trees in hazardous condition Discrete Pavement Characteris- Tics 1 = Smooth condition, 2 = Relatively smooth, slight break and rut, 3 = Rough, breaks, rut, potholes, 4 = Rough, severe breakage, rut, pot holes Discrete Intersection 0 = No intersection, 1 = Single minor road, 2 = Two minor/ Single major road, 3 = Two major road Discrete Pavement markings 1 = Proper, 2 = Partially removed, 3= Completely remove Discrete Sign boards 1 = Proper, 2 = Faded sign boards 3 = Not provided where traffic is high, 4 = No warning at hazardous situations Discrete
- 3. International Research Journal of Engineering and Technology (IRJET) e-ISSN: 2395-0056 Volume: 06 Issue: 06 | June 2019 www.irjet.net p-ISSN: 2395-0072 © 2019, IRJET | Impact Factor value: 7.211 | ISO 9001:2008 Certified Journal | Page 641 5. CRASH ANALYSIS The increase in motorization accompanied with expansion of road network has brought with it the challenge of addressing the adverse influence of road traffic accidents. Road accidentsare a global cataclysm with everraisingtrend which pose a public health and development challenge and greatly affect the human capitaldevelopmentofeverynation. Five tearcrash details is collected from the police stationand based on that crash analysis is done. 5.1. LOCATION BASED CRASH ANALYSIS The Fig. 1. showing the sample of location based crash analysis. It shows the number of crashes occurred in the first 6 section ie, from thechainage(0-3Km).Similarlythenumber of crashes occurred in the whole section is find out based on the crash details collected from the police station. From that the sections weremaximumnumberofcrashesareidentified. Occurrence of accident in these road stretch is very high due to the presence of many sharp contributing the spate of accidents and had made it into an accident prone area. Most of the motorist especially unfamiliar drivers fail to notice the curve and end up crashing. Most of the crashes at this location happened due to high speed and often it turned out of human error also. From the crash analysis it can be found out that the sections with steep and combined curves are crash prone spots, and it is mainly due to poor visibility. In some stretches the bus stops are provided very closer to intersection. Fig -1: Location based crash analysis 5.2 SEVERITY BASED CRASH ANALYSIS The Fig.2 showing sample of the severity based crash analysis. It represents the accident severity for the first 0 to 3Km chainage. Similarly the crash severity for the whole study area is found out with the help of accident data collected from the police station and the details collected from the local people. From the analysis it is observed that most of the accident occurred is of grevious type and the highest is in Nelluvai, Vazhakode, Uthuvady. Fatal accident is high in Vazhakode, Kanjirakkode and Erumapetty. Fig -2: Severity based crash analysis The collection and use of accurate and comprehensive data related to road crashes is very important to road safety management. Thevariousfactorswhichleadstoroadcrashes are studied and the locations with most number of occurrence of accidents are identified. 6. MODELING A model help to explain a system and the effects of different components (independent variable) with that the predictions and behavior can be understand. The quality of the study will depend on how well the mathematical model developed on the theoretical side agree with the actual conditions. In this study it aim to model a relationship between the weighted severity index and the various parameters selected for the study. 6.1 CORRELATION Correlation analysis is done in order to identify top correlated attributesSpearmanrank correlation.Correlation analysis is a method of statistical evaluation used to study the strength of a relationship between two, numerically measured, continuous variables. If correlation is found between two variables it means that when there is a systematic change in one variable, there is also a systematic change in the other. Table -3: Correlation table Variables Correlations Visibility 0.599** No. of curves 0.335** Intersection 0.587** Presence of road side hazard 0.329** Pavement condition 0.518** Sign board 0.634** Pavement markings 0.436** Fitness of curve 0.288* Shoulder width 0.250* ** Correlation is significant at the 0.01 level * Correlation is significant at the 0.05 level
- 4. International Research Journal of Engineering and Technology (IRJET) e-ISSN: 2395-0056 Volume: 06 Issue: 06 | June 2019 www.irjet.net p-ISSN: 2395-0072 © 2019, IRJET | Impact Factor value: 7.211 | ISO 9001:2008 Certified Journal | Page 642 6.2 FACTOR ANALYSIS Factor analysis is a method of data reduction. It does this by seeking underlying unobservable (latent) variables that are reflected in the observed variables (manifest variables). There are many different methods that can be used to conduct a factor analysis (such as principal axis factor, maximum likelihood, generalized least squares,unweighted least squares), There are also many different types of rotations that can be done after the initial extraction of factors, including orthogonal rotations, such as varimax and equimax, which impose the restriction that the factors cannot be correlated, and oblique rotations, suchaspromax, which allow the factors to be correlated with one another. Simple structure is pattern of results such that each variable loads highly onto one and only one factor. Rotated factor matrix contains the rotated factor loadings (factor pattern matrix), which represent both how the variables are weighted for each factor but alsothecorrelationbetween the variables and the factor which is shown in Table 4. Because these are correlations, possible values range from -1 to +1. Table -4: Rotated componant matrix Here in this case he first five features can be grouped together ie, Visibility,Intersection,Pavementcharacteristics, Conditions of road markings, Fitness of curve and it can be named Roadway characteristics (RC). The second component includes Fit-ness of curve, number of curves, condition of sign board and it comes under Curve characteristics and Sign conditions CC). The third component include shoulder width and Presence of road side hazard and it can be called as road side features component include Shoulder width and Presence of road side hazard and it can be called as road side features(RS). Therefore Roadway characteristics(RC) RC = 0.781 ∗Visibility+0.771∗Intersection+0.720∗Pavement condition+0.681 ∗Road Markings Eqn.[1] Curve characteristics and Sign conditions (CC) CC = 0.845 ∗Fit of curve+0.633 ∗Number of curve+0.503∗Signboard Eqn[2] Road side features (RS) RS = 0.759 ∗Shoulder width−0.585 ∗Presence of road side hazards Eqn[3] 6.3 ANALYSIS OF DATA USING WSI METHOD Five years accident data were analyzed to obtain the most accident prone locations using WSI method by assigning scores based on the number and severity of accidentsatthat particular location in the last five years. Weighted Severity Index (WSI), WSI = (1 x MI) + (4 x GI) + (41 x K) Where, K - No of fatality GI - is the number of grievous injuries MI - is the number of minor injuries Table -5: Ranking of road stretches based on WSI Rating Classification value Condition of road stretch 0-4 1 Low Risk 5-41 2 Medium Risk > 41 3 High Risk There for the regression analysis is done on the basis of weighted severity index as the independent parameter. 6.4 REGRESSION MODELING In statistics, linear regression is a linear approach for modelling the relationship between a scalar dependent variable and one or more explanatory variables (or independent variables).The caseofone explanatoryvariable is called simple linear regression. For more than one explanatory variable, the process is called multiple linear regression. In linear regression, the relationships are modeled using linear predictor functions whose unknown model parameters are estimated from thedata.Suchmodels are called linear models. Values of R2 is between 0 and 1. In this case two third data is taken for regression analysis.The coefficient of determination, R2, is used to analyze how differences in one variable can be explained by a difference in a second variable. R2, is the square of the correlation coefficient. It gives an idea of how many data points fall within the results of the line formed by the regression equation which is shown in Table 6 Parameter Component 1 Component 2 Component 3 Visibility 0.781 - - Intersection 0.771 - - Pavement condition 0.720 - - Pavement markings 0.681 - - Fitnessofcurve - 0.845 - No. of curves - 0.633 - Sign board - 0.503 - Shoulder width - - 0.759 Presence of road side hazard - - -0.585
- 5. International Research Journal of Engineering and Technology (IRJET) e-ISSN: 2395-0056 Volume: 06 Issue: 06 | June 2019 www.irjet.net p-ISSN: 2395-0072 © 2019, IRJET | Impact Factor value: 7.211 | ISO 9001:2008 Certified Journal | Page 643 Table -6: Regression coefficients Model Unstandardized B T Sig. Constant 0.102 4.226 0.000 RC 0.256 9.481 0.000 CC 0.193 2.341 0.024 RS 0.225 3.234 0.002 Class of road = 0.102+ (0.256 ∗RC+0.193 ∗CC+0.225 ∗RS) Eqn[4] The higher the coefficient, the higher percentage of points the line passes through when the data points and line are plotted. A higher regression coefficient indicates a better goodness of fit for the observations. The usefulness of R2 is its ability to find the likelihood of futureeventsfallingwithin the predicted outcomes. While conducting the regression analysis the R2 value obtained is 0.773 as shown in Table 7. Higher the value of R square, better the model. The obtained value of R2 is 0.773 it means 77.3 percent of the points should fall within the regression. Table -7: Summary of R2 Model R R2 1 0.879 0.773 6.5 MODEL VALIDITY Remaining one third data is checked for validity. Along with these data 5Km stretch of another StateHighwayin Thrissur is added and the validation is checked.Thentheaverageroot mean square error is calculated. The obtained root mean square error for the model is 0.21. 6.6 APPLICATION OF RSM Let’s take a road stretch with the following condition. The corresponding values of each parameterissubstitutedinthe regression model. Using this model the ranking of the road stretch can be find out. The features of this segment is shown in Table 8. • Poor visibility • Intersection with two major road • Partially removed pavement markings • Pavement with slight break and rut • Sharp curve • Stretch with 3 curves • No sign board • Shoulder width is 2.1m • No road side hazard Table -8: Application of RSA model Factors Factor score Classificatio n values Poor visibility 0.781 2 Intersection with two major road 0.771 3 Pavement relatively smooth with slight break 0.720 2 Partially removed markings 0.681 2 Sharp curve 0.845 2 Number of curves is 3 0.633 3 No sign board 0.503 4 Shoulder width 0.759 2.1 No road side hazard -0.585 1 RC = 0.781∗2+0.771∗3+0.720∗2+0.681∗2 = 6.67 CC = 0.845∗2+0.633∗3+0.503∗4 = 5.6 RS = 0.759∗2.1∗(−0.585)∗1 = 1.02 Road safety model (RSM) obtained is RSM = 0.102+(0.256∗RC+0.193∗CC+0.225∗RS) Eqn[5] Road safety model(RSM) obtained is RSM = 0.102+ (0.256 ∗RC+0.193 ∗CC+0.225 ∗RS) By substituting the corresponding values of these road sections into the road safety model the rank of the road will obtain i.e. Class of road = 0.102+ (0.256* 6.677+ 0.193* 5.601 + 0.225* 1.0089) = 3.119 3.119 ≈ 3 Hence road is classified as High Risk 7. GIS TOOLS FOR ROAD SAFETY MANAGEMENT Geographic Information System (GIS) is a specificintegrated system of hardware, software and analysis toolsdesigned to capture, store, manipulate, analyse, manage, and present all types of spatial or geographical data. In a general sense, GIS is a tool which has been employed for integration of spatial and non-spatial data. GIS applications allow users to create interactive queries (user-created searches), analyze spatial information, edit data in maps, and present the results of all these operations. Road network map along with attribute data pertaining to the study area were created in ArcGIS
- 6. International Research Journal of Engineering and Technology (IRJET) e-ISSN: 2395-0056 Volume: 06 Issue: 06 | June 2019 www.irjet.net p-ISSN: 2395-0072 © 2019, IRJET | Impact Factor value: 7.211 | ISO 9001:2008 Certified Journal | Page 644 environment. Accidentspotsderivedfrom weightedseverity (WSI) method were prioritized in GIS, to obtain the most vulnerable accident spots in the study area. Based on the regression model with rating based on Weighted Severity Index as independent parameter each section of road is classified and displayed in ArcGIS. Both theroadstretchesin the study area are coming under Thalipilli Taluk. Hence the Open street map of road shape file of ThalipilliTaluk istaken from Q-GIS. Then the map is imported toArc GIS.Afterwards the road stretches are segmented based on length. The attribute tables are added to it, which include the information collected regarding each section, which is shown in Fig. 3 Fig -3: Thematic representation of study area in ArcGIS 7.1. Thematic Representation of Vazhakode to Pazhayannur In ArcGIS Into thematic mapcorrespondingattributetableofWeighted Severity Index of Vazhakode to Pazhayannur road stretch is added which is shown in Fig. 4 • Low Risk - Green • Medium Risk - Yellow • High Risk - Red Fig -4: Weighted severity index of Vazhakode to Pazhyannur stretch 7.2. Thematic Representation of Ottupara to Vellarakkad In ArcGIS Similarly into thematic map correspondingattributetable of Weighted Severity Index of Ottupara to Vellarakkad road stretch is added and is shown in Fig.6 Fig -5: Weighted severity index of Ottupara to Vellarakkad stretch From the analysis of Vazhakode to Pazhayannur stretch it is clear that there are 11 sections which are classified as High Risk, 10 sections classified as Moderate Risk and 13sections were classified as Low Risk. Finally the ranking of each section are represented with suitable colour for each segment.In this road stretch 7 section with most vulnerable condition were identified and are classified as High Risk, 12 sections were classified as Moderate Risk sections and 11 sections were classified as Low Risk stretches. 7.3. Suggestions for Improvement of Study Stretch as Per IRC Codes: Based on the results the sections which comes under high risk classification can be improved by on the basis of recommendations provided in IRC codes Vazhakode Junction Vazhakode junction is a Y intersection. Leaving a large unmarked area at the junction will cause wavering of vehicles and increase accident potential. As per IRC SP 66: 1976 when an intersection were two major and a minor roads meets[17].The major road has to given the priority. Therefor the entry from the minor road is controlled by STOP or GIVE WAY signs and stop line markings Vazhakode Valavu it is a steep vertical curve. A number of crashes are occurring at this spot every year. The bus stop is also situated with in this curve. There are problem of inadequate visibility may arise on the inside of the curve because of the presence of tall mosque nearby. The factors affecting safety at a vertical curve are the rate of grade, the length of grade, and the frequency ofgradechanges.Thefirst two factors influence the extent of speed differential between the vehicles. Therefor speed limit sign boards should be kept within this section.
- 7. International Research Journal of Engineering and Technology (IRJET) e-ISSN: 2395-0056 Volume: 06 Issue: 06 | June 2019 www.irjet.net p-ISSN: 2395-0072 © 2019, IRJET | Impact Factor value: 7.211 | ISO 9001:2008 Certified Journal | Page 645 Uduvadi In this road stretch there are two sharp horizontal curves and also the natural objects (trees) very adjacent to the road section. On the inside of horizontal curves,visibility can be improved by cutting back the obstructions to sight, lowering the height of hedges. Sharper the curve, greater is the proneness to accidents. Trees allowed to remain should be painted in white colour for a height of 1.25 m above roadway level with 300 mm middle band in black colour to warn road users of their persence[16]. For better night visibility, it will also be preferable to fix on their face a piece of red reflectorised tape, disc or paint. Near Nelluvai region there are paddy fields. A number of culverts are provided in this stretch, also the road width in this stretch is lesser than the required. During night times vehicles may fall on the paddy fields due to lack of delineators. Wherever widening of single lane to two-lane carriageway is undertaken, the widening/reconstruction of narrow culverts equal to full formation width should be simultaneously taken up. For this purpose, it would be preferable to include the provision for culverts in the estimate for widening of road itself. However, whereverthis is not possible, bold warning sign boards on both sides of narrow culverts should be installed. In kanjirakkode there are two intersections and a steep curve. No warning signs are provided in this stretch. Since it is a staggered intersection with 6 major conflicts and 12 minor conflicts pointsThenumberofintersectionsshouldbe reduced to the barest minimum. On rural highways, the intersections should not be spaced closer than 750 m.[17] On urban arterials, the corresponding minimum distance should be 500 m. Therefor approaches to intersections should be provided with properly laid out guidance system in the form of signs and pavement markings. Erumapetty Junction It is a junction where two minor roads meets with two major road. Priority intersections like an intersection between major and minor roads where the major road has the priority for movement while the entry from the minor road is controlled by STOP or GIVE WAY signs and stop line markings. Sign boards with speed limit should be erected and also necessary warning signs should be provided. 8. CONCLUSION The outcome of a road safety audit istheidentificationofany road safety deficiencies and formulation of recommendations aimed at removing or reducing the deficiencies. From the analysis it can be identified that intersections and curves are the major features leading crashes. A curvilinear alignment with long curves is better from the point of safety and aesthetics. As a normal rule, sharp curves should not be introduced at the end of long tangents since these can be extremelyhazardous.Visibilityis an important requirement at intersections. To avoid collisions, it is essential that sufficient sight distance is available along the intersecting roads and their included corners, to enable the operators of vehicles simultaneously approaching the intersection to see each other in time. The study attempts to find out the causative factors for accident and suggests measures to prevent accidents in future. REFERENCES [1] Agarwal, P. K., Patil, P. K., and Mehar, R. (2013). “A methodology for ranking road safety hazardous locations using analytical hierarchy process.” ProcediaSocial and Behavioral Sciences, 104, 1030– 1037. [2] Aghasi, N. H. M. (2019). “Application ofgisforurban traffic accidents: A critical review.” Journal of Geographic Information System, 11, 82–96. [3] Bagi, A. S. and Kumar, D. N. (2012). “Road safety audit.” IOSR Journal of Mechanical and Civil Engineering Ver. I, 1(6), 1 – 7. [4] Deshpande, P. (2014). “Road safety and accident prevention in india: a review.” Internationaljournal of advanced engineering technology, 5(2), 64–68. [5] Geurts, K., Brijs, T., and Wets, G. (2003). “Clustering and profiling traffic roads by means of accident data. [6] Grosskopf, S. E., Kazemi, T., Hughes, J., and Alumsawi Bani Hashim, S. (2012). “Road safety assessments and road safety audits on the existing abu dhabi internal road network.” SATC 2012. [7] Huvarinen, Y., Svatkova, E., Oleshchenko, E., and Pushchina, S. (2017). “Road safety audit.” Transportation Research Procedia, 20, 236–241. [8] Khalilikhah, M. and Heaslip, K. (2016). “The effects of damage on sign visibility: An assist in traffic sign replacement.” Journal of traffic and transportation engineering (English edition), 3(6), 571–581. [9] Khera, D. and Singh, W. (2014). “A review on injury severity in traffic system using various data mining techniques.” International Journal of Computer Applications, 100(3). [10] Lopez, G., de Ona, J., Garach, L., and Baena, L.(2016). “Influence of deficienciesintrafficcontrol devicesin crashes on two-lane rural roads.” Accident Analysis & Prevention, 96, 130–139.
- 8. International Research Journal of Engineering and Technology (IRJET) e-ISSN: 2395-0056 Volume: 06 Issue: 06 | June 2019 www.irjet.net p-ISSN: 2395-0072 © 2019, IRJET | Impact Factor value: 7.211 | ISO 9001:2008 Certified Journal | Page 646 [11] Mehar, R. and Agarwal, P. K. (2013). “A systematic approach for formulation of a road safety improvementprograminindia.”Procedia-Socialand Behavioral Sciences, 104, 1038–1047. [12] Moradkhani, F., Ebrahimkhani, S., and Sadeghi Begham, B. (2014). “Road accident data analysis: a data mining approach.” Indian Journal of Scientific Research, 3(3), 437–443. [13] Sayed, M. and Mhaske, S. (2013). “Gis based road safety audit.” International Journal of Scientific Engineering and Research (IJSER), 1(2), 21–23. [14] Szenasi, S. and Janko, D. (2017). “A method to identify black spot candidates in built-up areas.” Journal of TransportationSafety&Security,9(1),20– 44. [15] Wei, L. “Enhancingroadsafetymanagementwithgis mapping and geospatial database. [16] IRC: 27-1984,ReportContarningRecommendations of the Regional Workshops on Highway Safety. [17] IRC: 66-1976, Recommended Practice for Sight Distance On Rural Highways. [3] IRC SP- 088,2010,Manual on Road Safety Audit,.