The tribal people are relatively isolates, encysted, tradition bound, inward looking and less enterprising. During the post independence period, they have been experiencing induced social change through planned development and interventions. But in spite of such endeavor, the rate of progress and development are not commensurate with the expectations. Majority of cultivators use land in only in kharif season and migrated to other places for alternative occupation like brickwork, construction work and industrial purposes in lean period. Even if they do not hesitate to leave their house including all other resources and migrated to other districts and continue to work as labourer for the rest period of their life. Due to lack of sufficient scope for livelihood and deterioration of natural resources on which the tribal people depend much for their hereditary occupation, they migrate to other occupation or other places in search of job. Pitrim Sorokin (1927) defined social mobility as “any transition of an individual or social object or value, anything that has been created or modified by human activity, from one social position to another”. The mobility of the tribal people mainly depends on the availability of work/job, job satisfaction, relative economic advantage etc. The present study has been carried out with the objectives of to study the modalities of the occupational mobility from the agriculture to non-agricultural activities along with the factors responsible for such mobility.The study was conducted in Mayurbhanj district of Odisha purposefully in which the tribals occupy 58.72 % of the total population. Four blocks were selected randomly each one from four sub divisions. Fifteen tribal people were selected from each village as respondents randomly from twelve villages three from each block totaling to sample size of 180. The finding from the study implies that 86.11 percent respondents were going outside their locality for their occupation. The table indicates that majority of the respondents (63.88 %) were moving within their own locality regularly whereas 40% of the respondents were moving within their block. It was observed that majority of respondents (84.44 percent) were always moving for other occupation during the period of April to June. It was observed that 48.88 percent respondents regularly visited outside after harvest of own crop. It was also observed that mobility of the respondents according to their occupation was highest in case of agricultural labourer (53.88 %) followed by labour in construction work. In the study majority of the respondents opined that to get more income was the main factor responsible for change in occupation followed by skill developed, government developmental schemes, communication facility, infrastructural development, change in life style, educational support, social status, change in climate, extension/technical support, marketability, input support, credit support and political influence.
Similar to lysis of The Factors Responsible for Occupational Mobility from Agriculture to Non-Agriculture Sectors by The Tribals in Mayurbhanj District of Odisha
Similar to lysis of The Factors Responsible for Occupational Mobility from Agriculture to Non-Agriculture Sectors by The Tribals in Mayurbhanj District of Odisha (20)
lysis of The Factors Responsible for Occupational Mobility from Agriculture to Non-Agriculture Sectors by The Tribals in Mayurbhanj District of Odisha
1. International Journal of Humanities and Social Science Invention
ISSN (Online): 2319 – 7722, ISSN (Print): 2319 – 7714
www.ijhssi.org ||Volume 5 Issue 10||October. 2016 || PP.14-20
www.ijhssi.org 14 | Page
Analysis of The Factors Responsible for Occupational Mobility
from Agriculture to Non-Agriculture Sectors by The Tribals in
Mayurbhanj District of Odisha
Jagannath Patra1
, Sarthak Chowdhury2
and Rabindra Kumar Raj3
1
Senior Scientist and Head, KVK, Mayurbhanj, OUAT, Bhubaneswar, Odisha;
2
Principal, Palli Siksha Bhavana, Visva Bharati
3
Former Professor, Department of Extension Education, OUAT, Bhubaneswar
ABSTRACT: The tribal people are relatively isolates, encysted, tradition bound, inward looking and less
enterprising. During the post independence period, they have been experiencing induced social change through
planned development and interventions. But in spite of such endeavor, the rate of progress and development are
not commensurate with the expectations. Majority of cultivators use land in only in kharif season and migrated
to other places for alternative occupation like brickwork, construction work and industrial purposes in lean
period. Even if they do not hesitate to leave their house including all other resources and migrated to other
districts and continue to work as labourer for the rest period of their life. Due to lack of sufficient scope for
livelihood and deterioration of natural resources on which the tribal people depend much for their hereditary
occupation, they migrate to other occupation or other places in search of job. Pitrim Sorokin (1927) defined
social mobility as “any transition of an individual or social object or value, anything that has been created or
modified by human activity, from one social position to another”. The mobility of the tribal people mainly
depends on the availability of work/job, job satisfaction, relative economic advantage etc. The present study has
been carried out with the objectives of to study the modalities of the occupational mobility from the agriculture
to non-agricultural activities along with the factors responsible for such mobility.The study was conducted in
Mayurbhanj district of Odisha purposefully in which the tribals occupy 58.72 % of the total population. Four
blocks were selected randomly each one from four sub divisions. Fifteen tribal people were selected from each
village as respondents randomly from twelve villages three from each block totaling to sample size of 180. The
finding from the study implies that 86.11 percent respondents were going outside their locality for their
occupation. The table indicates that majority of the respondents (63.88 %) were moving within their own
locality regularly whereas 40% of the respondents were moving within their block. It was observed that majority
of respondents (84.44 percent) were always moving for other occupation during the period of April to June. It
was observed that 48.88 percent respondents regularly visited outside after harvest of own crop. It was also
observed that mobility of the respondents according to their occupation was highest in case of agricultural
labourer (53.88 %) followed by labour in construction work. In the study majority of the respondents opined
that to get more income was the main factor responsible for change in occupation followed by skill developed,
government developmental schemes, communication facility, infrastructural development, change in life style,
educational support, social status, change in climate, extension/technical support, marketability, input support,
credit support and political influence.
Keywords: occupational mobility, tribal, migration, factors responsible for mobility
I. INTRODUCTION
The tribal people are relatively isolates, encysted, tradition bound, inward looking and less enterprising.
During the post independence period, they have been experiencing induced social change through planned
development and interventions. But in spite of such endeavor, the rate of progress and development are not
commensurate with the expectations. Majority of cultivators use land in only in kharif season and migrated to
other places for alternative occupation like brickwork, construction work and industrial purposes in lean period.
In spite of activities of various agencies in the field of tribal development, the food security problem is
not solved. The tribals therefore go for other vocations particularly to work in non agricultural sectors and work
as unskilled labourers. Even if they do not hesitate to leave their house including all other resources and
migrated to other districts and continue to work as labourer for the rest period of their life.
Enough technology in the field of agriculture has been developed in all land situations which is not
only profitable, but also stable, sustainable and equitable. If all these technologies are used by the tribals perhaps
they stay in their village and develop economic condition. It is our prime duty to make them conscious and
develop competency in use of these technologies.
2. Analysis of The Factors Responsible for Occupational Mobility from Agriculture to Non-Agriculture...
www.ijhssi.org 15 | Page
Karn Deo Singh (2005) in his study under three districts viz. Koraput, Phulbani and Mayurbhanj
revealed that most households practice shifting cultivation, which seems to satisfy very essential nutritional
requirements in form of pulses and oilseed as well as supplement the intake of cereal produced in low and
midlands. Production from shifting agriculture is very comparable (even higher) compared to settled subsistence
agriculture, but available only on a periodic basis. The fact is that the people could not meet all their food
requirements and income from agricultural sources (settled and shifting) alone. It is also reported that their
dependence on forests is declining with time due to deforestation and forest degradation arising from shifting
agriculture and changing land use. The hilly terrain, the short and erratic growing season, the small and skewed
land holdings, a very low level of technology and the long hauling distance from the market, impose serious
socio-economic handicaps to tribal agriculture development and make it a very challenging task.
Due to lack of sufficient scope for livelihood and deterioration of natural resources on which the tribal
people depend much for their hereditary occupation, they migrate to other occupation or other places in search
of job. Pitrim Sorokin (1927) defined social mobility as “any transition of an individual or social object or value,
anything that has been created or modified by human activity, from one social position to another”. The
mobility of the tribal people mainly depends on the availability of work/job, job satisfaction, relative economic
advantage etc. Work, job, occupation and position have generally been used interchangeably.
The present study has been carried out with the objectives of to study the socio-economic profile of
tribal people of the district and to analyse the modalities of the occupational mobility from the agriculture to
non-agricultural activities along with the factors responsible for such mobility.
II. REVIEW OF LITERATURE
Sabirianova (2000) from his study found that the restructuring process increased the rate of
occupational reallocation. He noted that structural changes account for a substantial part of the increase in gross
occupational flows. The econometric results also indicated that the local outside opportunities and the scale of
structural change largely determined the probability of occupational switching.
The study of Society for Regional Research and Analysis for Planning Commission (2010) in four
cities Chhatisgarh, Jharkhand, Madhya Pradesh and Orissa among tribal women had revealed that
unemployment, poverty and lack of basic facilities of education, health and hygiene were still a major problem
in the tribal areas forcing them for migration to various towns and cities. The tribal families were not able to
meet their basic needs out of their meager income from their occupations.
III. REASEARCH METHODOLOGY
The study was conducted in Mayurbhanj district of Orissa purposefully as the district enriched with
most number of tribal people. The tribals occupy 58.72 % of the total population. The districts and sub
divisions were selected purposively where as random sampling technique was followed to select blocks, villages
and respondents. Four blocks were selected randomly each one from four sub divisions like Shamakhunta from
Baripada Sadar, Kaptipada from Kaptipada, Bijatala from Rairangpur and Jasipur from Karanjia. Three villages
were selected randomly from each block. Likewise twelve villages in total were selected randomly. Fifteen
tribal people were selected from each village as respondents randomly totaling sample size of 180.
IV. RESULTS AND DISCUSSION
TABLE.1 Distribution of the respondents according to their Age n=180
Sl. No. Category Number Percentage
1 Young (18-35 years) 103 57.22
2 Middle (36-50 years) 46 25.56
3 Old (more than 50 years) 31 17.22
From the table.1, it was indicated that most of the respondents (57.22 percent) belonged to young age group
(between 18- 35 years).
TABLE.2 Distribution of the respondents according to their Educational Status n=180
Sl. No. Category Number Percentage
1 Illiterate 36 20.00
2 Primary Level 40 22.22
3 Middle school Level 33 18.33
4 Matriculation 40 22.22
5 Higher secondary 18 10.00
6 Graduation 06 03.33
7 Post-Graduation and above 04 02.22
8 Any technical degree 03 01.66
3. Analysis of The Factors Responsible for Occupational Mobility from Agriculture to Non-Agriculture...
www.ijhssi.org 16 | Page
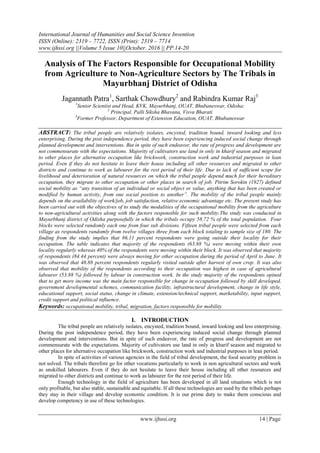
The table presented above implied that majority of the respondents made their education up to primary
level and matriculation level (22.22 percent each) followed by illiterates (20 percent). From the observation it is
evident that most of the respondents had very poor educational background.
Fig. 1 Distribution of the respondents according to their Educational Status
Table.3 Distribution of the respondents according to their Land holding n=180
Sl. No. Category Number Percentage
1 Less than 1 ac 67 37.22
2 Within 1-2 ac 56 31.12
3 Within 2-5 ac 42 23.33
4 More than 5 ac. 15 08.33
From the table, it was found that the majority of the respondents belonged to marginal land holding category
(37.22 percent).
Table.4 Distribution of the respondents according to their Annual Family Income n=180
Sl. No. Category Number Percentage
1 More than 1 lakh 22 12.22
2 75,000-1 lakh 09 05.00
3 50,000-75,000 39 21.66
4 25,000-50,000 74 41.11
5 Less than 25,000 36 20.00
It was found that majority of the respondents had annual family income in the range Rs 25,000 to 50,000 (41.11
percent) followed by in the range of 50,000 to 75,000 (21.66 percent (5 percent).
TABLE.5 Distribution of the respondents according to their Extension Contact n=180
Sl. No. Extension Personnel Extent of Contact
Very frequently Frequently Sometimes Never
Number Number Number Number
1 Field level official/workers 24 (13.33) 51 (28.33) 67 (37.22) 38 (21.11)
2 Block level officials 06 (03.33) 27 (15.00) 51 (28.33) 96 (53.33)
3 Sub division level officials 03 (01.66) 03 (01.66) 57 (31.66) 117 (65.00)
4 District level officials 03 (01.66) 03 (01.66) 21 (11.66) 153 (85.00)
5 State level officials 0 03 (01.66) 03 (01.66) 174 (96.66)
6 Private companies 0 06 (03.33) 21 (11.66) 153 (85.00)
7 NGOs 0 12 (06.66) 30 (16.66) 138 (76.66)
*Figures shown in the parentheses indicates the percentage
The table displayed the extent of extension contact of the tribal people under study in which it was
found that very few were in contact with state, district, sub division and block level extension personnel. They
had also very low rapport with the private companies and non-government organizations.
4. Analysis of The Factors Responsible for Occupational Mobility from Agriculture to Non-Agriculture...
www.ijhssi.org 17 | Page
TABLE. 6 Distribution of respondents according to their nature of occupational mobility n=180
Sl. No. Mobility to Sectors Nature of mobility
More than 6 months/year Less than 6 months/year
Number Percentage Number Percentage
1 Govt. service 13 07.22 0 0
2 Private/NGO service 09 05.00 0 0
3 Business 07 03.88 03 01.66
4 Farming 63 35.00 70 38.88
5 Animal husbandry 12 06.66 63 35.00
6 Fishery 03 01.66 12 06.66
7 Household produces 06 03.33 03 01.66
8 Industrial sector 09 05.00 0 0
9 Wage earner 37 20.55 30 16.66
10 Political work 03 01.66 0 0
11 Contract job 09 05.00 0 0
12 Skilled work 09 05.00 36 14.44
The findings shows that, majority of the respondents (35.0 percent) had fully engaged in the farming
sector more than six months in a year followed by wage earning in which 20.55 percents were engaged more
than six years.
TABLE.7 Distribution of respondents according to mobility towards outside the locality n=180
Sl. No. Mobility Number Percentage
1 Movement towards outside their locality 155 86.11
2 Not going outside their locality 25 13.88
From the above table it was found that 86.11 percent respondents were going outside their locality for
their occupation.
TABLE.8 Distribution of respondents according to extent of mobility by self and with other members n=180
Sl.
No.
Associates Extent of mobility
Regularly Occasionally Never
Number % Number % Number %
1 Self 155 86.11 0 0 25 13.88
2 With wife/husband 43 23.88 36 20.00 101 56.11
3 Own family members 70 38.88 18 10.00 92 51.11
4 With friends/neighbor 0 0 79 43.88 101 56.11
5 With relatives 0 0 70 38.88 110 61.11
It was observed that majority of the respondents (86.11 percent) visited outside the locality alone regularly.
TABLE.9 Distribution of respondents according to their mobility at different places n=180
Sl. No. Places Extent of mobility
Regularly Occasionally Never
Number % Number % Number %
1 Within block 72 40.00 43 23.88 65 36.11
2 Within sub division 30 16.66 33 18.33 117 65.00
3 Within district 22 12.22 36 20.00 122 67.77
4 Within state 09 05.00 18 10.00 153 85.00
5 Outside state 0 0 09 05.00 171 95.00
The table indicates that majority of the respondents (63.88 %) were moving within their own locality
regularly whereas 40% of the respondents were moving within their block.
TABLE.10 Distribution of respondents according to their seasonality of mobility n=180
Sl.
No.
Period Extent of mobility
Always Some times Never
Number % Number % Number %
1 January-March 125 69.44 36 20.00 19 10.55
2 April-June 152 84.44 12 06.66 16 08.88
3 July-September 58 32.22 58 32.22 64 35.55
4 October-December 107 59.44 48 26.66 25 13.88
It was observed that majority of respondents (84.44 percent ) were always moving for other occupation
during the period of April to June followed by 69.44 percent during January to March, 59.44 percent during
October to December and 32.22 percent during July to September.
5. Analysis of The Factors Responsible for Occupational Mobility from Agriculture to Non-Agriculture...
www.ijhssi.org 18 | Page
TABLE.11 Distribution of respondents’ mobility according to crop calendar n=180
Sl. No. Crop calendar Extent of mobility
Regularly Occasionally Never
Number % Number % Number %
1 After harvest of own crops 88 48.88 36 20.00 56 31.11
2 After harvest of crops of locality 88 48.88 36 20.00 56 31.11
3 During the cropping season 27 15.00 58 32.22 95 52.77
4 Throughout the year 80 44.44 36 20.00 64 35.55
5 As and when necessary 58 32.22 57 31.66 65 36.11
It was observed that 48.88 percent respondents regularly visited outside after harvest of own crop and
same number of respondents go after harvest of crops in locality. 44.44 percent go throughout the year, 32.22
percent as and when necessary and 15.0 percent during the cropping season on regular basis.
TABLE.12 Distribution of respondents’ mobility according to their type of occupation n=180
Sl. No. Type of work Extent of mobility
Always Sometimes Never
Number % Number % Number %
1 Agricultural labourer 97 53.88 0 0 83 46.11
2 Labour in industrial sector 09 05.00 0 0 171 95.00
3 Brick making 09 05.00 18 10.00 153 85.00
4 Labour in construction work 18 10.00 09 05.00 153 85.00
5 Domestic servant 0 0 09 05.00 171 95.00
6 Supervising job 09 05.00 0 0 171 95.00
From the table, it was observed that mobility of the respondents according to their occupation was
highest in case of agricultural labourer (53.88 %) followed by labour in construction work.
TABLE.13 Factors responsible for change in occupation by the respondents n=180
Maximum obtainable score- 2
The analysis from the above table indicates the factors responsible for change in occupation among the
tribal people under study. As per the finding of the table, majority of the respondents opined that to get more
income was the main factor responsible for change in occupation followed by skill developed, government
developmental schemes, communication facility, infrastructural development, change in life style, educational
support, social status, change in climate, extension/technical support, marketability, input support, credit support
and political influence.
Sl. No. Factor Extent of agreement Mean score
RankFully agree Agree Disagree
Number Number Number
1 Climatic Imbalance/
Hostile Climate
0 83 97 0.461 IX
2 Educational Support 40 34 106 0.633 VII
3 Skill Developed 66 49 65 1.005 II
4 More Income 80 100 0 1.444 I
5 Infrastructural Deterioration/ development 0 129 51 0.716 V
6 Credit Support 0 22 158 0.122 XIII
7 Input Support 0 40 140 0.222 XII
8 Marketability 0 44 136 0.244 XI
9 Extension/
Technical Support
06 52 122 0.355 X
10 Government developmental scheme 09 136 35 0.855 III
11 Change in life style 25 76 79 0.700 VI
12 Social Status 25 58 97 0.600 VIII
13 Communication Facility 0 140 40 0.777 IV
14 Political Influence 03 0 177 0.033 XIV
6. Analysis of The Factors Responsible for Occupational Mobility from Agriculture to Non-Agriculture...
www.ijhssi.org 19 | Page
TABLE.14 Correlation co-efficient between the occupational mobility with factors responsible for change in
occupation n=180
*Significant at the 5% level **Significant at the 1% level
From the table it was found that climatic imbalance positively influenced the respondents for change of
occupation to business, fishery, industrial sector and skilled job whereas it was negatively correlated with the
government services, private/NGO services, animal husbandry, farming, wage earning and contract job.
Educational support had significant and positive relationship with the government services, private/NGO
services, business, fishery, industrial sector and political work whereas it had significant, but negative
correlation with the farming, animal husbandry, wage earning, contract job and skilled job. The factor like skill
developed by the respondents had positive associationship with the fishery, industrial sector, contract job and
skilled job whereas it was negatively associated with the government services. More income was significantly
and positively correlated with the government services, business, fishery, industrial sector, contract job and
skilled job whereas it was negatively correlated with the private/NGO services and wage earning. Likely the
factor infrastructural development/deterioration was positively correlated with the government services,
business, fishery and skilled job whereas it was negatively correlated with wage earning and political work.
Credit support was positively correlated with the business, farming and fishery whereas it was negatively
correlated with the wage earning and skilled job. Input support was positively correlated with the business,
farming and fishery whereas it was negatively correlated with wage earning and skilled job. Marketability was
positively correlated with the business, farming and fishery whereas it was negatively correlated with the wage
earning and skilled job. Extension/technical support was positively correlated with the business, farming and
fishery whereas it was negatively correlated with the government services. Government developmental schemes
were positively correlated with the farming and wage earning whereas it was negatively correlated with the
government services, private/NGO services and business. Change in life style was significantly correlated with
the government services, private/NGO services, business, fishery and industrial sector whereas it was also
significantly, but negatively correlated with the farming, animal husbandry and wage earning. Social status was
positively correlated with the government services, private/NGO services, business, fishery and industrial sector
whereas it was negatively correlated with the farming, animal husbandry and wage earning. Communication
facility was positively correlated with the government services, private/NGO services, business, industrial sector
and political work whereas it was negatively correlated with the farming, animal husbandry and wage earning.
Political influence was positively correlated with only political work whereas it was negatively correlated with
farming only.
V. CONCLUSIONS
Although the majority of population in the state still depends on agriculture directly or indirectly, the
state economy revolves around the agriculture sector. But in a changing trend there has been diversifying and
shift moving away from the agricultural sector to non-farm sectors. The industry and services sectors have
emerged as main drivers of growth. Despite reduction of the sectoral share of this sector, the agriculture sector is
still vital for the state. This sector still provides employment and sustenance, directly or indirectly, to more than
60 percent of the population.
On the basis of the finding it was suggested for checking mobility of the tribal people from agriculture
to non-agriculture sector like enhancing the literacy level should be among the tribal people to increase their
efficiency and better understanding of the scientific agriculture. The cropping intensity should be enhanced and
other secondary agriculture like poultry farming, goat rearing, mushroom cultivation, bee keeping, dairy
7. Analysis of The Factors Responsible for Occupational Mobility from Agriculture to Non-Agriculture...
www.ijhssi.org 20 | Page
farming, value addition of crop produces and production of household goods must be promoted to provide year
round employment to the tribal people. The development of infrastructure in agriculture and allied fields must
be emphasized including maximising irrigation facility, marketing facility, input availability, farm
mechanisation and post harvest management.
REFERENCES
[1]. Planning Commission Report (2007-2012) on Working Group Report of the Development of Education of SC/ST/Minorities/Girls
and other Disadvantaged Groups, For 11th
, Five Year Plan. http:/ /planipolis. iiep. unesco. org/ upload/ India/ India_
wg11_scst.pdf. Accessed on Nov, 2010
[2]. Sabirianova, Klara (2000). The great human capital reallocation: a study of occupational mobility in transitional Russia. Economics
Education and Research Consortium, Economy and Development, Economic Analyses and Commentaries. http:// www.eerc.ru
[3]. Singh, Karn Deo (2005). The Food and Nutrition Security on Community. Consolidated Report: Tribal Development Strategies
from Phulbani, Orissa Sorokin, P. A. (1927). Social and Cultural Mobility, Harper and Brother: 43