Glaucoma Screening Test By Segmentation of Optical Disc& Cup Segmentation Using MATLAB

Glaucoma is one of the most common causes of blindness and it is becoming even more important considering the ageing society. Because healing of died retinal nerve fibers is not possible early detection and prevention is essential. Robust, automated mass-screening will help to extend the symptom-free life of affected patients. We devised a novel, automated, appearance based glaucoma classification system that does not depend on segmentation based measurements. Our purely data-driven approach is applicable in large-scale screening examinations. The proposed segmentation methods have been evaluated in a database of 650 images with optic disc and optic cup boundaries manually marked by trained professionals. Our expected Experimental results may be average overlapping error of 9.5% and 24.1% in optic disc and optic cup segmentation, respectively.

Recommended
Recommended
More Related Content
What's hot
What's hot (20)
Similar to Glaucoma Screening Test By Segmentation of Optical Disc& Cup Segmentation Using MATLAB
Similar to Glaucoma Screening Test By Segmentation of Optical Disc& Cup Segmentation Using MATLAB (20)
Recently uploaded
Recently uploaded (20)
Glaucoma Screening Test By Segmentation of Optical Disc& Cup Segmentation Using MATLAB
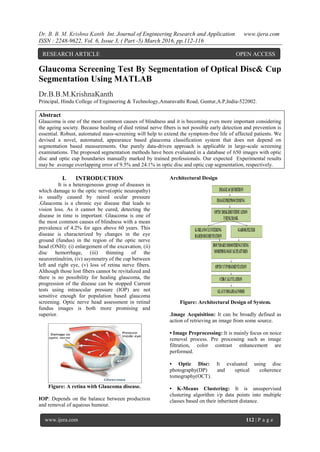
- 1. Dr. B. B. M. Krishna Kanth Int. Journal of Engineering Research and Application www.ijera.com ISSN : 2248-9622, Vol. 6, Issue 3, ( Part -5) March 2016, pp.112-116 www.ijera.com 112 | P a g e Glaucoma Screening Test By Segmentation of Optical Disc& Cup Segmentation Using MATLAB Dr.B.B.M.KrishnaKanth Principal, Hindu College of Engineering & Technology,Amaravathi Road, Guntur,A.P,India-522002. Abstract Glaucoma is one of the most common causes of blindness and it is becoming even more important considering the ageing society. Because healing of died retinal nerve fibers is not possible early detection and prevention is essential. Robust, automated mass-screening will help to extend the symptom-free life of affected patients. We devised a novel, automated, appearance based glaucoma classification system that does not depend on segmentation based measurements. Our purely data-driven approach is applicable in large-scale screening examinations. The proposed segmentation methods have been evaluated in a database of 650 images with optic disc and optic cup boundaries manually marked by trained professionals. Our expected Experimental results may be average overlapping error of 9.5% and 24.1% in optic disc and optic cup segmentation, respectively. I. INTRODUCTION It is a heterogeneous group of diseases in which damage to the optic nerve(optic neuropathy) is usually caused by raised ocular pressure .Glaucoma is a chronic eye disease that leads to vision loss. As it cannot be cured, detecting the disease in time is important. Glaucoma is one of the most common causes of blindness with a mean prevalence of 4.2% for ages above 60 years. This disease is characterized by changes in the eye ground (fundus) in the region of the optic nerve head (ONH): (i) enlargement of the excavation, (ii) disc hemorrhage, (iii) thinning of the neuroretinalrim, (iv) asymmetry of the cup between left and right eye, (v) loss of retina nerve fibers. Although those lost fibers cannot be revitalized and there is no possibility for healing glaucoma, the progression of the disease can be stopped Current tests using intraocular pressure (IOP) are not sensitive enough for population based glaucoma screening. Optic nerve head assessment in retinal fundus images is both more promising and superior. Figure: A retina with Glaucoma disease. IOP: Depends on the balance between production and removal of aqueous humour. Architectural Design Figure: Architectural Design of System. .Image Acquisition: It can be broadly defined as action of retrieving an image from some source. • Image Preprocessing: It is mainly focus on noice removal process. Pre processing such as image filtration, color contrast enhancement are performed. • Optic Disc: It evaluated using disc photography(DP) and optical coherence tomography(OCT). • K-Means Clustering: It is unsupervised clustering algorithm i/p data points into multiple classes based on their inheritent distance. RESEARCH ARTICLE OPEN ACCESS
- 2. Dr. B. B. M. Krishna Kanth Int. Journal of Engineering Research and Application www.ijera.com ISSN : 2248-9622, Vol. 6, Issue 3, ( Part -5) March 2016, pp.112-116 www.ijera.com 113 | P a g e • Gabour Filter: Mainly focus on image processing application. It is used to accurate boundary delineation. • Morphological Features: It is description of the shape of objects /regions. There are two operations are performed dilation and erosion. • Optic Cup: We can use thresholding or binarization for optic cup segmentation process. This process will convert color image into B/W image. • Cdr Calculation: CDR value is greater than threshold, then it is glaucomatous otherwise healthy. • Glaucoma Diagnosis: We can find the disease condition of the patient, usually performed by optometrists and ophthalmologist. Optic cup segmentation: Image segmentation is the process of partitioning an image into multiple segments, as to change the representation of an image is more meaningful and easier to analyze. K-means clustering algorithm is applied for image segmentation. The segmentation estimates the disc boundary, which is a task due to blood vessel occlusions, pathological changes around disc, variable imaging conditions, etc. Circular Hough transform is used to the disc boundary. The segmentation estimates the disc boundary, which is a challenging task due to blood vessel occlusions, pathological changes around disc, variable imaging conditions, etc. Some approaches have been proposed for disc segmentation, which can be generally classified as template based methods circular Hough transform is used to model the disc boundary because of its computational efficiency. We also presentation super pixel classification based approach using histograms to improve the initialization of the disc for deformable models. Both the template and deformable model based methods are based on the edge characteristics. The performance of these methods very much depends on the differentiation of edges from the disc and other structures, especially the PPA. 1).it looks similar to the disc;2).it screscent shape makes it form another ellipse (often stronger) to gether with the disc This paper uses the simple linear iterative clustering algorithm(SLIC) to aggregate nearby pixels into super pixels in retinal fundus images. Compared with other super pixel methods, SLIC is fast, memory efficient and has excellent boundary adherence. SLIC is also simple to use with only one parameter, i.e., the number of desired super pixels k. Here we give a brief introduction of the SLIC algorithm while more details of the algorithms can be found in the SLIC paper. Many features such as colour, appearance, gist, location and texture can be extracted from super pixels for classification. Since colour is one of the main differences between disc and non-disc region, colour histogram from super pixels is an intuitive choice . Motivated by the large contrast variation between images and the use of histogram equalization in biological neural networks histogram equalization is applied to red r, green g, and blue b channels from RGB colour spaces individually to enhance the contrast for easier analysis. It is important to include features that reflect the difference between the PPA region and the disc region. The super pixels from the two regions often appear similar except for the texture: the PPA region contains blob-like structures while the disc region is relatively more homogeneous. The histogram of each super- pixel does not work well as the texture variation in the PPA region is often from a larger area than the super pixel. Optic Cup Segmentation We can use thresholding or binarization for Optic Cup segmentation Process. This process will convert our image into a B/W (Black & White) image where we can easily get our Optic Cup. Detecting the cup boundary from 2D fundus images without depth information is a challenging task as depth is the primary indicator for the cup. boundary. Thresholding is used to determine the cup in, relying on intensity difference between cup and neuroretinalrim. This method and thresholding based methods are essentially based on pallor information. The main challenge in cup segmentation is to determine the cup boundary when the pallor is non obvious or weak Retinal nerve bers converge to the optic disk (OD) and form a cup-shaped region known as the cup. Enlargement of this cup with respect to OD is an important indicator of glaucoma progression and hence ophthalmologists manually examine the OD and cup for evaluation. An automatic assessment of cup region from Colour fundus image (CFI) could reduce the workload of Specialists and help objective recognition of glaucoma. Optic Disc Segmentation Image segmentation is the process of partitioning an image into multiple segments, as to change the representation of an image is more meaningful and easier to analyze. K-means clustering algorithm is applied for image segmentation. The segmentation estimates the disc boundary, which is a task due to blood vessel occlusions, pathological changes around disc, variable imaging conditions, etc. Circular Hough
- 3. Dr. B. B. M. Krishna Kanth Int. Journal of Engineering Research and Application www.ijera.com ISSN : 2248-9622, Vol. 6, Issue 3, ( Part -5) March 2016, pp.112-116 www.ijera.com 114 | P a g e transform is used to the disc boundary. The segmentation estimates the disc boundary, which is a challenging task due to blood vessel occlusions, pathological changes around disc, variable imaging conditions, etc. Some approaches have been proposed for disc segmentation, which can be generally classified as template based methods,deformable model based methods and pixel classification based methods .In circular Hough transform is used to model the disc boundary because of its computational efficiency. We also presentation super pixel classification based approach using histograms to improve the initialization of the disc for deformable models. Both the template and deformable model based methods are based on the edge characteristics. The performance of these methods. Very much depends on the differentiation of edges from the disc and other structures, especially the PPA. 1)it looks similar to the disc;2)it screscent shape makes it form another ellipse (often stronger) to gether with the disc. Cup to Disc Ratio Armaly back in the „70‟s introduced the idea of cup disc ratios (CDR). That is, expressing the proportion of the disc that is occupied by the cup. This notation is commonly used in glaucoma clinics to classify discs and you will see in the casenotes CDR 0.4 or CDR 0.6. But opinions vary as to what CDR constitutes a glaucomatous disc some say 0.3, some 0.5 and some say 0.8. The enormous physiological variation in optic disc size means that a myopic disc with a normal compliment of fibres may have a CDR of 0.6 and be normal but a hypermetropic disc with severely diminished number of fibres as a result of extensive glaucomatous damage may also have a CDR of 0.6. One disc normal, one disc grossly diseased but both having the same cup dis cratio.The CDR notation is also used to chart progression, an increase from 0.3 to 0.7 for example, being a sign of progression. However this technique of evaluating the optic disc has been shown to be inaccurate and highly variable in the way that it is recorded. Studies have shown that clinicians vary widely in the value they give a CDR when compared to each other and when retested themselves. For years, many optometrists felt that the C/D ratio provided ample information to adequately describe and document the optic nerve. While the C/D ratio should be recorded (and it is best to record the horizontal and vertical dimensions), more important information exists that also should be documented. The C/D ratio represents the depression in the optic disc in which neural tissue is absent and is compared to the overall optic disc size. Eyes that have glaucoma may have a small or large C/D ratio. Also, a larger C/D ratio has a greater risk for developing glaucoma. Figure: 1 Figure: 2 Fig 1&2:Major structures of the optic disc: The region enclosed by the blue line is the optic disc; the central bright zone enclosed by the red line is the optic cup; and the region between the red and blue lines is the neuroretinal rim. These statements reflect the reality of clinical practice, and any method that can get practitioners to document the optic nerve/RNFL should be encouraged. If using imaging instrumentation (digital forms) rather than stereo photographs to document the optic nerve/RNFL will get doctors to document the posterior segment, this is an important step. By using the several tests of
- 4. Dr. B. B. M. Krishna Kanth Int. Journal of Engineering Research and Application www.ijera.com ISSN : 2248-9622, Vol. 6, Issue 3, ( Part -5) March 2016, pp.112-116 www.ijera.com 115 | P a g e glaucoma, but the fact is we need more accurate and effective test to detect the glaucoma. That is achieve by using our proposed method. II. PROPOSED METHOD Figure: Block Diagram of the System. Experimental Results a Sets Our experiments uses 2326 images from 2326 different subject eyes including 650 from the Singapore Malay Eye Study (SiMES) and 1676 from the Singapore Chinese Eye Study (SCES). IOP have been measured for these eyes. Among the images, the disc and cup boundaries from 650 SiMES data set with image dimension 3072 × 2048 have been manually marked by trained professionals in previous studies for disc and cup segmentation. The 1676 images from SCES are collected in a screening study. There are two sizes: 3504×2336 and 3888×2592. All the SCES images are resized to be the same size as the SiMES data set, for convenience. Percentage Of Images Per E Interval And Μe Using Different Features Fig. 10. Sample results. From left to right columns: (a) the original images, (b) the manual “ground truth”, (c)-(g) outlines by the MCV , CHT- ASM, EHT , MDM and the proposed method. From top to bottom, the reliability score by the proposed method is 0.99, 0.87, 1.00, 0.97, 0.94, and0.78 respectively. The overlapping errors by the proposed method are: 2.8%, 9.6%, 12.9%, 17.8%, 21.3%, and 37.2% respectively. III. Conclusion Now a days the glaucoma is one of the most popular disease to the eye. This disease has no medicine the solution is only curing. Its necessary to detect glaucoma at earlier stage for curing. We hope this project is provided an efficient method to detect the glaucoma. And We have presented super pixel classification based methods for disc and cup segmentations for glaucoma screening. Despite the bias, the obtained CDRs for very large cups are still high and the CDRs for very small cups are still small, so the proposed method achieves high classification accuracy when differentiating glaucomatous subjects from healthy ones. The accuracy of the proposed method is already much better than the air puff IOP measurement and previous CDR based methods. References [1] H. A. Quigley and A. T. Broman, “The number of people with glaucoma worldwide in 2010 and 2020,” Br. J. Ophthalmol., vol. 90(3), pp. 262– 267, 2006. [2] S. Y. Shen, T. Y. Wong, P. J. Foster, J. L. Loo, M. Rosman, S. C. Loon, W. L. Wong, S. M. Saw, and T. Aung, “The prevalence and types of glaucoma in malay people: the singapore malay eye study,” Invest. Ophthalmol. Vis. Sci., vol. 49(9), pp. 3846– 3851, 2008. [3] P. J. Foster, F. T. Oen, D. Machin, T. P. Ng, J. G. Devereux, G. J. Johnson, P. T. Khaw, and S. K. Seah, “The prevalence of glaucoma in chinese residents of singapore: a cross-sectional population survey of the tanjong pagar district,” Arch. Ophthalmol., vol. 118(8), pp. 1105–1111, 2000. [4] Centre for Eye Research Australia, Tunnel vision : the economic impact of primary open angle glaucoma. [electronic resource], 2008, http://nla.gov.au/nla.arc-86954. [5] J. Meier, R. Bock, G. Michelson, L. G. Nyl, and J. Hornegger, “Effects of preprocessing eye fundus images on appearance based glaucoma classification,” Proc. CAIP, pp. 165–172, 2007.
- 5. Dr. B. B. M. Krishna Kanth Int. Journal of Engineering Research and Application www.ijera.com ISSN : 2248-9622, Vol. 6, Issue 3, ( Part -5) March 2016, pp.112-116 www.ijera.com 116 | P a g e [6] R. Bock, J. Meier, G.Michelson, L. G. Nyl, and J. Hornegger, “Classifying glaucoma with image-based features from fundus photographs,” Proc. of DAGM, pp. 355– 364, 2007. [7] R. Bock, J. Meier, L. G. Nyl, and G. Michelson, “Glaucoma risk index: Automated glaucoma detection from color fundus images,” Med. Image Anal., vol. 14, pp. 471–481, 2010. [8] G. D. Joshi, J. Sivaswamy, and S. R. Krishnadas, “Optic disk and cup segmentation from monocular color retinal images for glaucoma assessment,” IEEE Trans. Med. Imag., vol. 30, pp. 1192–1205, 2011. [9] T. Damms and F. Dannheim, “Sensitivity and specificity of optic disc parameters in chronic glaucoma,” Invest. Ophth. Vis. Sci., vol. 34, pp. 2246–2250, 1993. [10] D. Michael and O. D. Hancox, “Optic disc size, an important consideration in the glaucoma evaluation,” Clinical Eye and Vision Care, vol. 11, pp. 59–62, 1999. [11] N. Harizman, C. Oliveira, A. Chiang, C. Tello, M. Marmor, R. Ritch, and JM. Liebmann, “The isnt rule and differentiation of normal from glaucomatous eyes,” vol. 124, pp. 1579–1583, 2006. [12] J. B. Jonas, M.C. Fernandez, and G.O. Naumann, “Glaucomatous parapapillary atrophy occurrence and correlations,” Arch Ophthalmol, vol. 110, pp. 214–222, 1992. [13] R. R. Allingham, K. F. Damji, S. Freedman, S. E. Moroi, and G. Shafranov, Shields‟ Textbook of Glaucoma, 5th Edition, Lippincott Williams & Wilkins, 2005. [14] J. Xu, O. Chutatape, E. Sung, C. Zheng, and P.C.T. Kuan, “Optic disk feature extraction via modified deformable model technique for glaucoma analysis,” Pattern Recognition, vol. 40, pp. 2063–2076, 2007. [15] M. D. Abr`amoff, W. L. M. Alward, E. C. Greenlee, L. Shuba, C. Y. Kim, J. H. Fingert, and Y. H. Kwon, “Automated segmentation of theoptic disc from stereo color photographs using physiologically plausible features,” Invest. Ophthalmol. Vis. Sci., vol. 48, pp. 1665–1673, 2007.