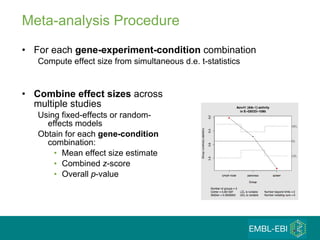
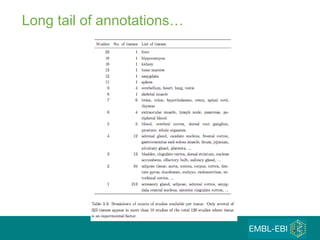
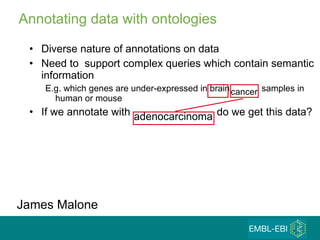
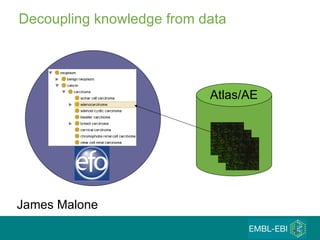
Download to read offline


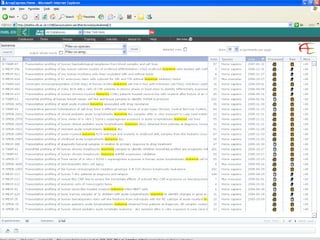
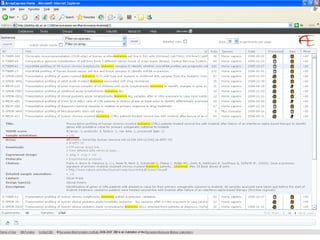
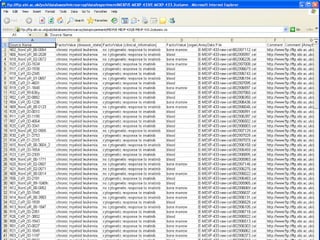
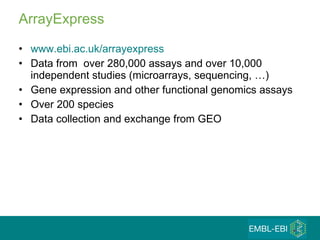
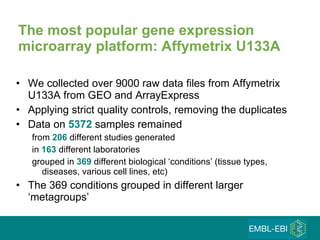
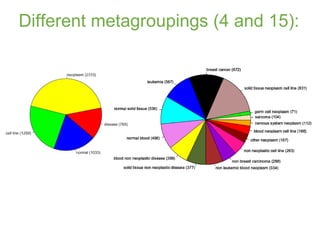
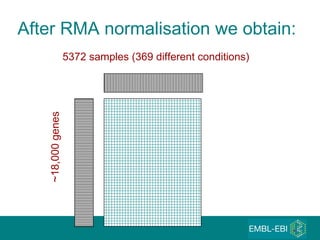
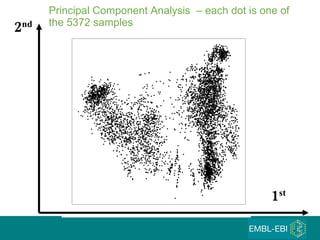
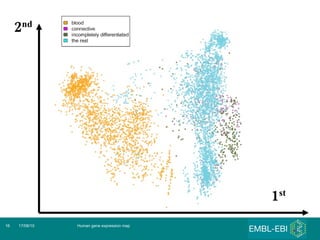
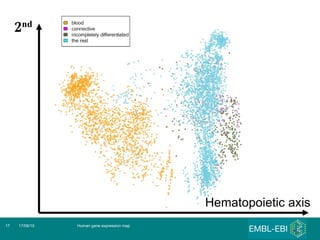
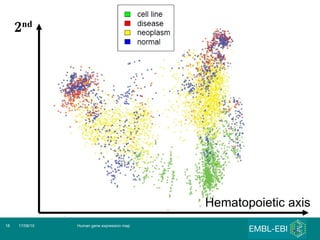
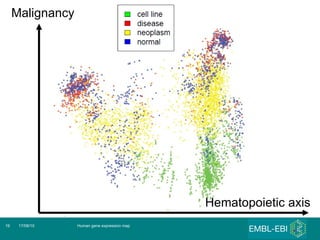
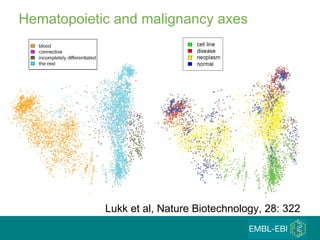
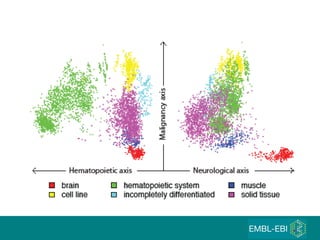

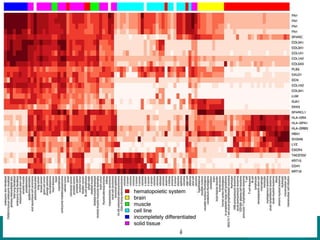
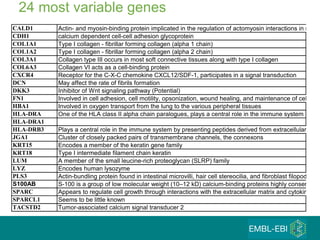
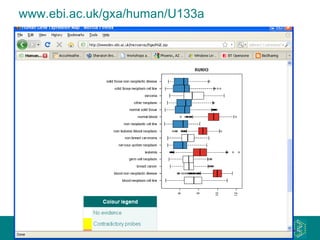
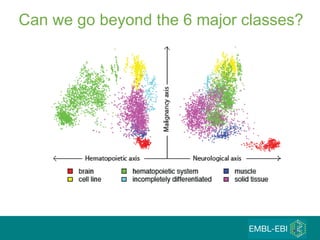
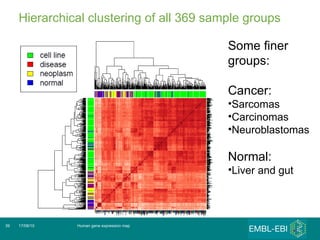
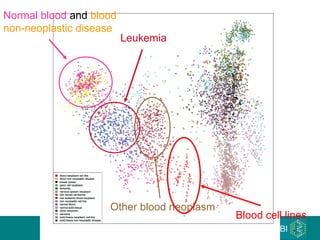
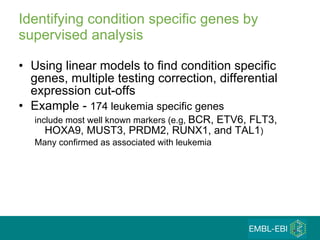
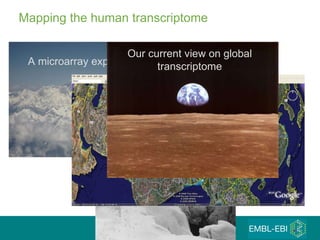
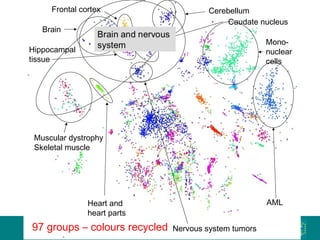
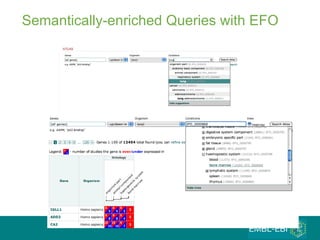
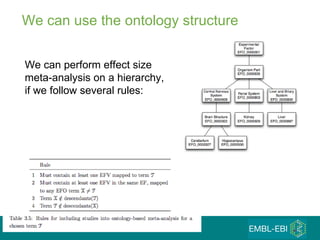
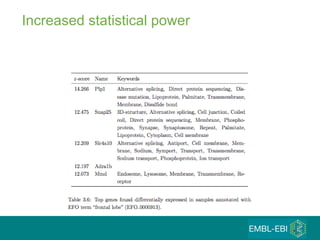
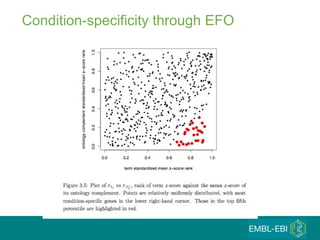
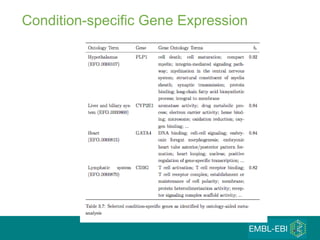

The document discusses building a global map of human gene expression by integrating data from thousands of gene expression experiments deposited in public databases. It describes two approaches: 1) Integrating over 9,000 samples on a quantitative level to identify major expression classes and differentially expressed genes. 2) A meta-analysis approach to identify condition-specific differentially expressed genes across many studies. Combining both approaches could provide a comprehensive global map of human gene expression.