Download as PDF, PPTX
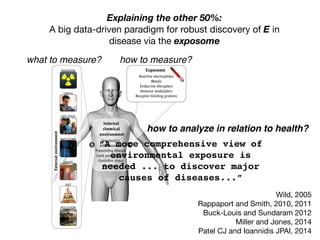
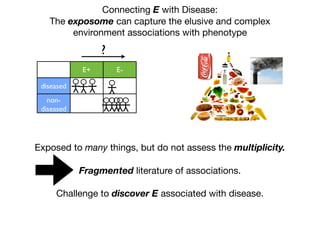
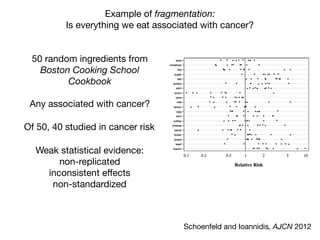
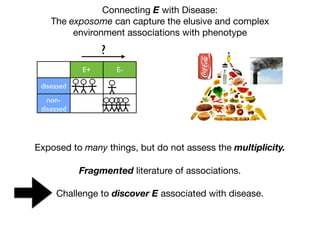
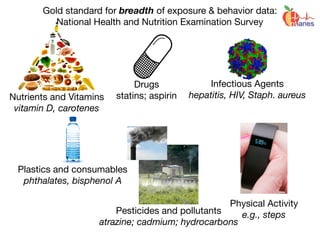
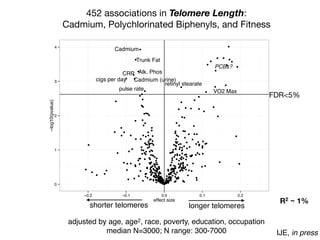
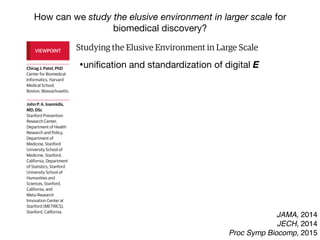

1) The document discusses the need for large-scale studies of environmental exposures, known as environment-wide association studies (EWAS), to discover environmental factors associated with disease and address issues with past fragmented studies of single exposures. 2) EWAS can systematically analyze multiple personal exposures simultaneously and adjust for multiple testing to identify strongest associations, which can then be validated in independent data sets. 3) However, establishing causal inferences from observational EWAS data remains challenging due to complex correlations between many environmental factors.


