Downloaded 124 times
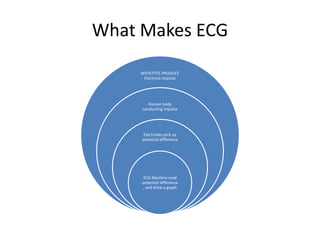
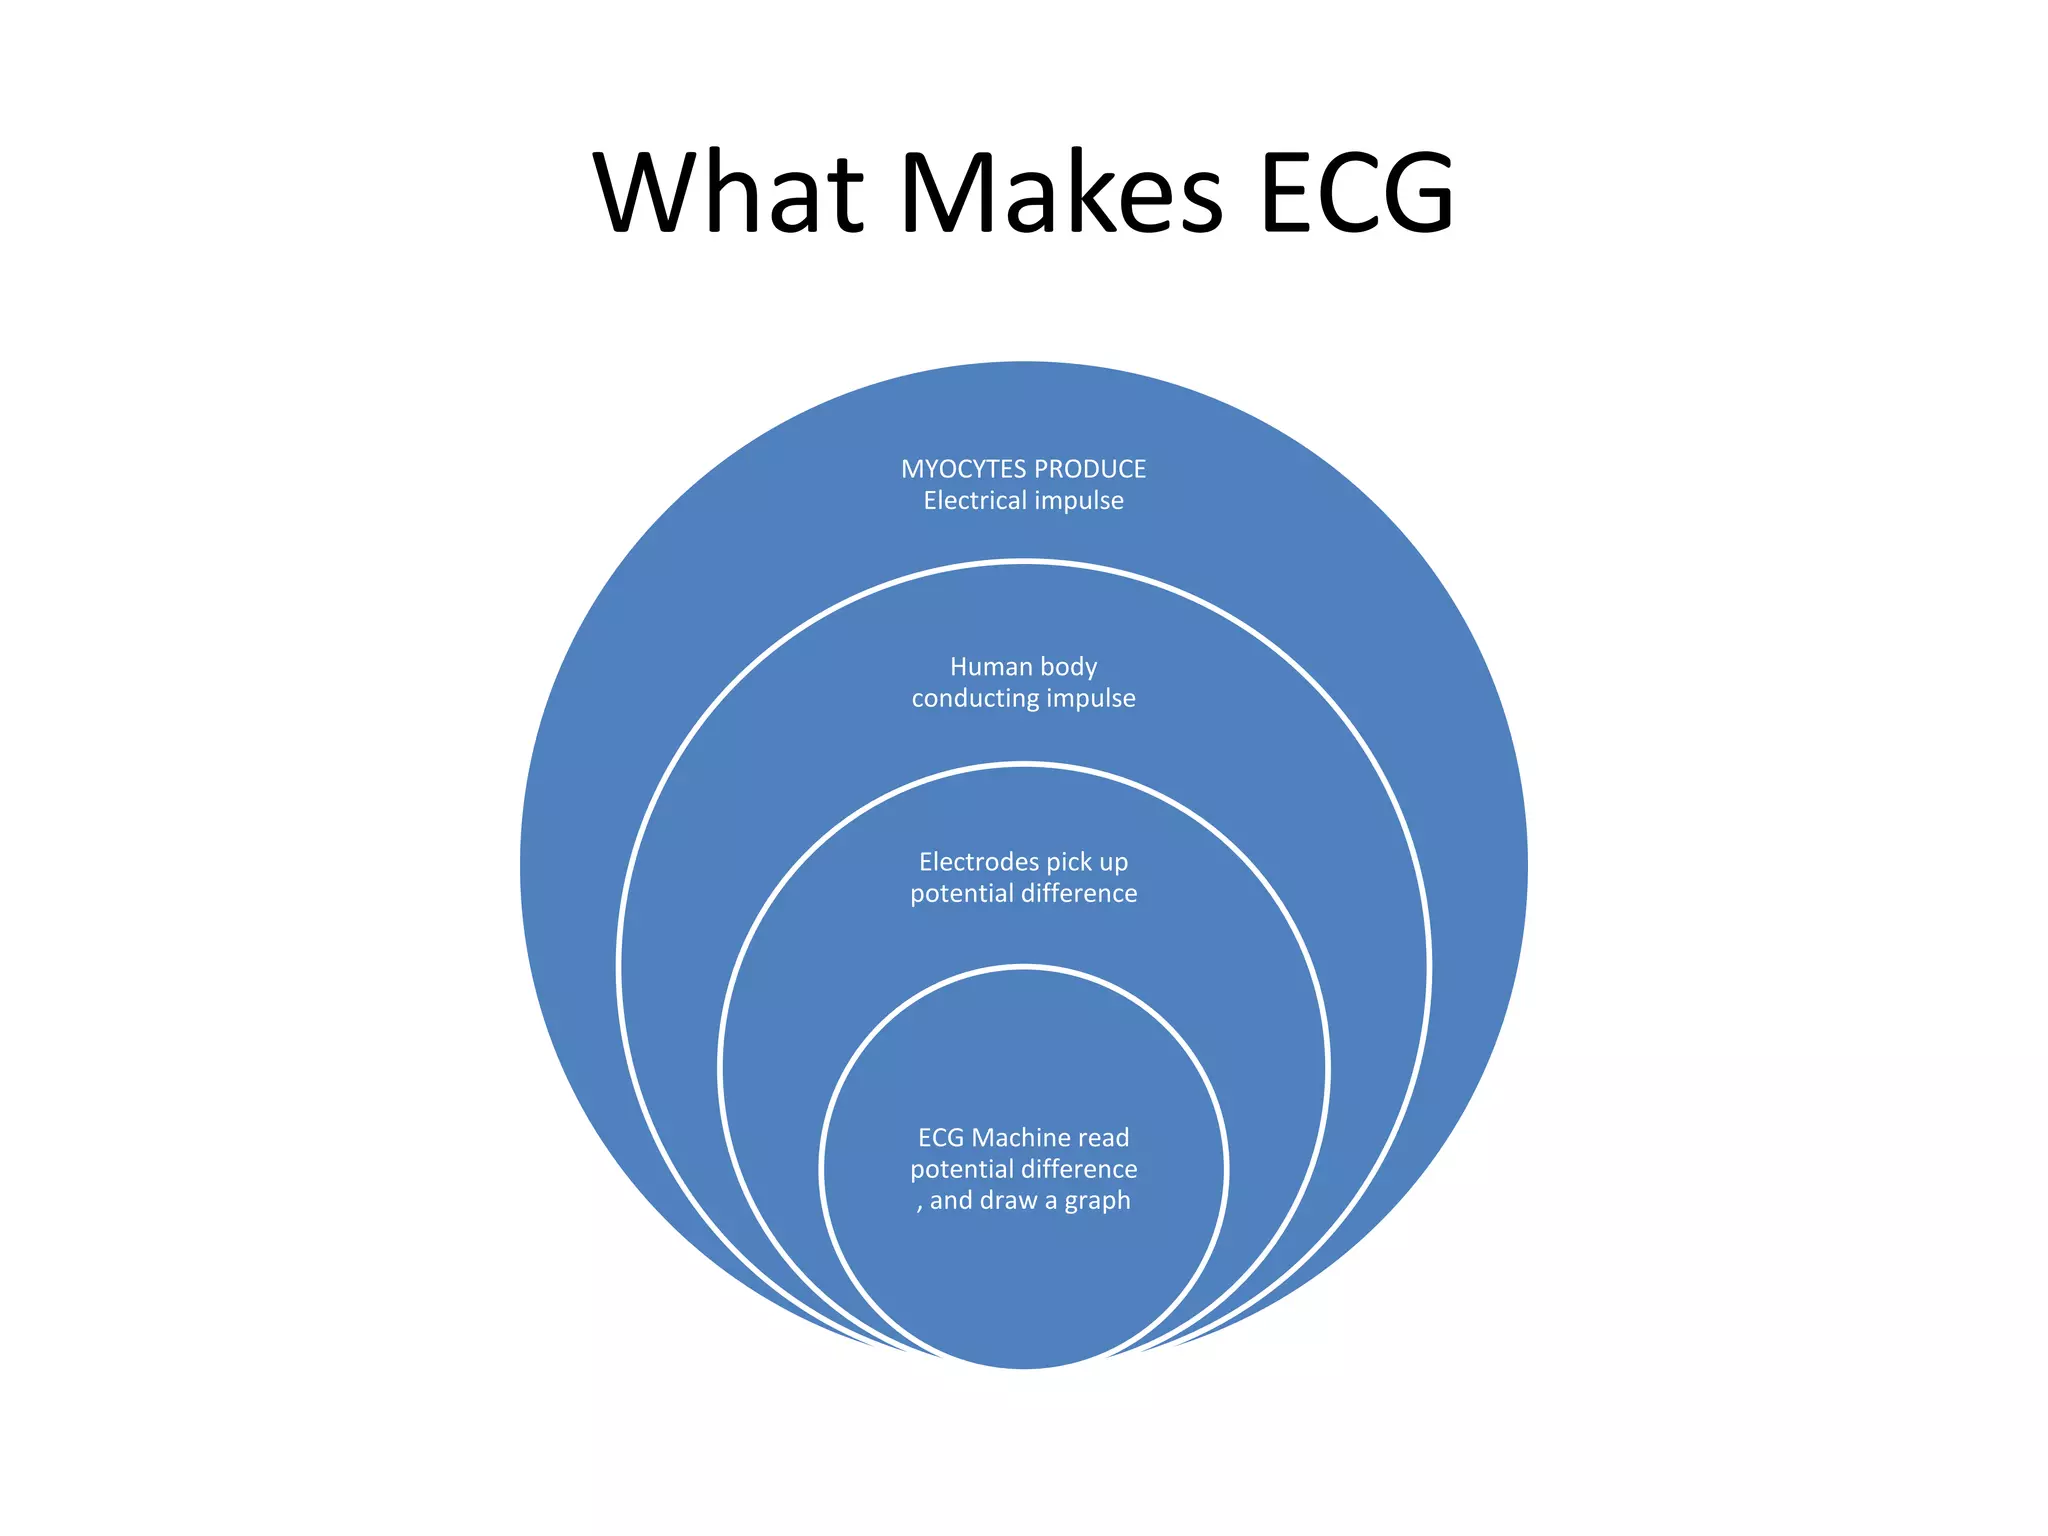
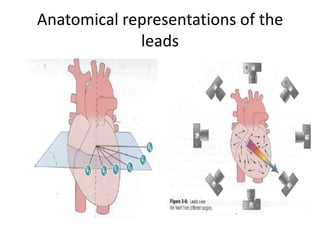
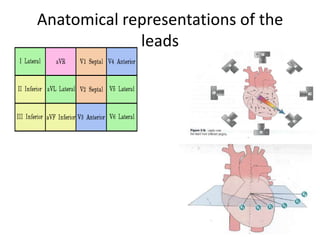
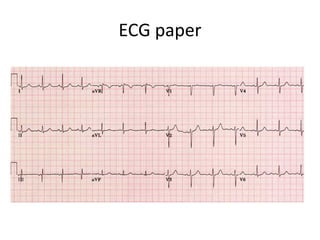
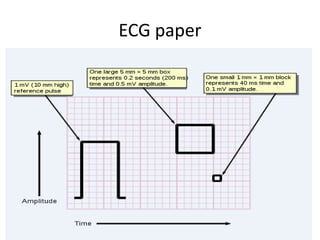
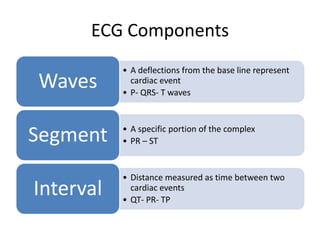
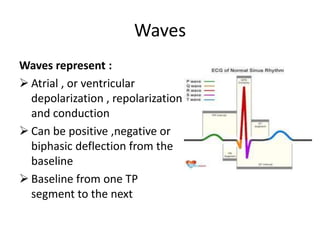
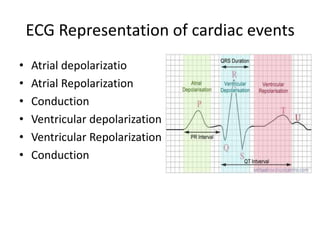

ECGs produce a graph of the heart's electrical activity by detecting the potential differences between electrodes placed on the skin. The electrodes pick up the electrical impulse conducted through the heart muscle and body. The ECG machine reads and records the differences in potential to draw a graph over time. The graph consists of waves, segments, and intervals that provide information about atrial and ventricular depolarization and repolarization during each heartbeat cycle.