More Related Content
Similar to DC State Bridge Profile
Similar to DC State Bridge Profile (18)
DC State Bridge Profile
- 1. © 2014 The American Road & Transportation Builders Association (ARTBA). All rights reserved. No part of this document may be reproduced or
transmitted in any form or by any means, electronic, mechanical, photocopying, recording, or otherwise, without prior written permission of
ARTBA.
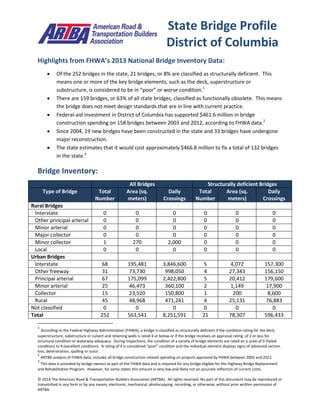
Highlights from FHWA’s 2013 National Bridge Inventory Data:
Of the 252 bridges in the state, 21 bridges, or 8% are classified as structurally deficient. This
means one or more of the key bridge elements, such as the deck, superstructure or
substructure, is considered to be in “poor” or worse condition.1
There are 159 bridges, or 63% of all state bridges, classified as functionally obsolete. This means
the bridge does not meet design standards that are in line with current practice.
Federal-aid investment in District of Columbia has supported $461.6 million in bridge
construction spending on 158 bridges between 2003 and 2012, according to FHWA data.2
Since 2004, 19 new bridges have been constructed in the state and 33 bridges have undergone
major reconstruction.
The state estimates that it would cost approximately $466.8 million to fix a total of 132 bridges
in the state.3
Bridge Inventory:
All Bridges Structurally deficient Bridges
Type of Bridge Total
Number
Area (sq.
meters)
Daily
Crossings
Total
Number
Area (sq.
meters)
Daily
Crossings
Rural Bridges
Interstate 0 0 0 0 0 0
Other principal arterial 0 0 0 0 0 0
Minor arterial 0 0 0 0 0 0
Major collector 0 0 0 0 0 0
Minor collector 1 270 2,000 0 0 0
Local 0 0 0 0 0 0
Urban Bridges
Interstate 68 195,481 3,846,600 5 4,072 157,300
Other freeway 31 73,730 998,050 4 27,343 156,150
Principal arterial 67 175,099 2,422,800 5 20,412 179,600
Minor arterial 25 46,473 360,100 2 1,149 17,900
Collector 15 23,520 150,800 1 200 8,600
Local 45 48,968 471,241 4 25,131 76,883
Not classified 0 0 0 0 0 0
Total 252 563,541 8,251,591 21 78,307 596,433
1
According to the Federal Highway Administration (FHWA), a bridge is classified as structurally deficient if the condition rating for the deck,
superstructure, substructure or culvert and retaining walls is rated 4 or below or if the bridge receives an appraisal rating of 2 or less for
structural condition or waterway adequacy. During inspections, the condition of a variety of bridge elements are rated on a scale of 0 (failed
condition) to 9 (excellent condition). A rating of 4 is considered “poor” condition and the individual element displays signs of advanced section
loss, deterioration, spalling or scour.
2
ARTBA analysis of FHWA data, includes all bridge construction related spending on projects approved by FHWA between 2003 and 2012.
3
This data is provided by bridge owners as part of the FHWA data and is required for any bridge eligible for the Highway Bridge Replacement
and Rehabilitation Program. However, for some states this amount is very low and likely not an accurate reflection of current costs.
State Bridge Profile
District of Columbia
- 2. © 2014 The American Road & Transportation Builders Association (ARTBA). All rights reserved. No part of this document may be reproduced or
transmitted in any form or by any means, electronic, mechanical, photocopying, recording, or otherwise, without prior written permission of
ARTBA.
Proposed bridge work:
Type of Work Number Cost (millions) Daily Crossings Area (sq. meters)
Bridge replacement 1 $20.3 14,300 16,525
Widening & rehabilitation 0 $0.0 0 0
Rehabilitation 15 $176.4 690,600 46,640
Deck rehabilitation/replacement 11 $29.9 374,600 10,849
Other work 105 $240.3 3,160,393 161,607
Top 10 Most Traveled Structurally Deficient Bridges in the State
County Year
Built
Daily
Crossings
Type of Bridge Location
(route/water under the bridge, traffic on the bridge and location)
District of
Columbia
1925 62,000 Urban other
principal arterial
WHITEHURST FRWY, Key Bridge, WHITEHURST FRWY
District of
Columbia
1967 61,400 Urban other
principal arterial
WASH TERMINAL YARDS, NEW YORK AVENUE, NEW YORK
AVENUE OVER RR
District of
Columbia
1932 60,300 Urban local road GWMP (WB) & POTOMAC RIVE, MEMORIAL AVENUE, 0.3
MILES WEST OF LINCOLN
District of
Columbia
1963 58,000 Urban
freeway/expressway
PARK RD CONNECTION, ANACOSTIA FREEWAY, ANACOSTIA
AVENUE S.E.
District of
Columbia
1950 53,800 Urban
freeway/expressway
ANACOSTIA RIVER, SOUTH CAPITOL ST, S CAPITOL
ST/ANACOSTIA R
District of
Columbia
1963 42,400 Urban Interstate S. CAPITOL STREET S.E., ANACOSTIA FREEWAY, ANACOSTIA
FRWY OVER S.CAP
District of
Columbia
1963 42,400 Urban Interstate S.CAPITOL ST S.E., ANACOSTIA FREEWAY, ANACOSTIA &
S.CAP.ST
District of
Columbia
1955 42,100 Urban
freeway/expressway
ANACOSTIA RIVER & PARK R, EAST CAPITOL ST, ANACOSTIA
RIVER AT E CAP
District of
Columbia
1964 40,000 Urban Interstate LITTLE R & GW PKWY, RAMP D TO RT 50, T ROOSEVELT BR.
TO RT. 50
District of
Columbia
1958 30,100 Urban other
principal arterial
MILITARY RD, 16TH STREET N.W., 16TH ST OVER MILITARY
RD
Sources: All data is from the 2013 National Bridge Inventory, released by the Federal Highway Administration in March 2014.
Note that specific conditions on bridge may have changed as a result of recent work. Cost estimates of bridge work provided as
part of the data and have been adjusted to 2013$ for inflation and estimated project costs. Contract awards data is for state
and local government awards and comes from McGraw Hill. Note that additional bridge investment may be a part of other
contract awards if a smaller bridge project is included with a highway project, and that would not be accounted for in the total
in this profile.