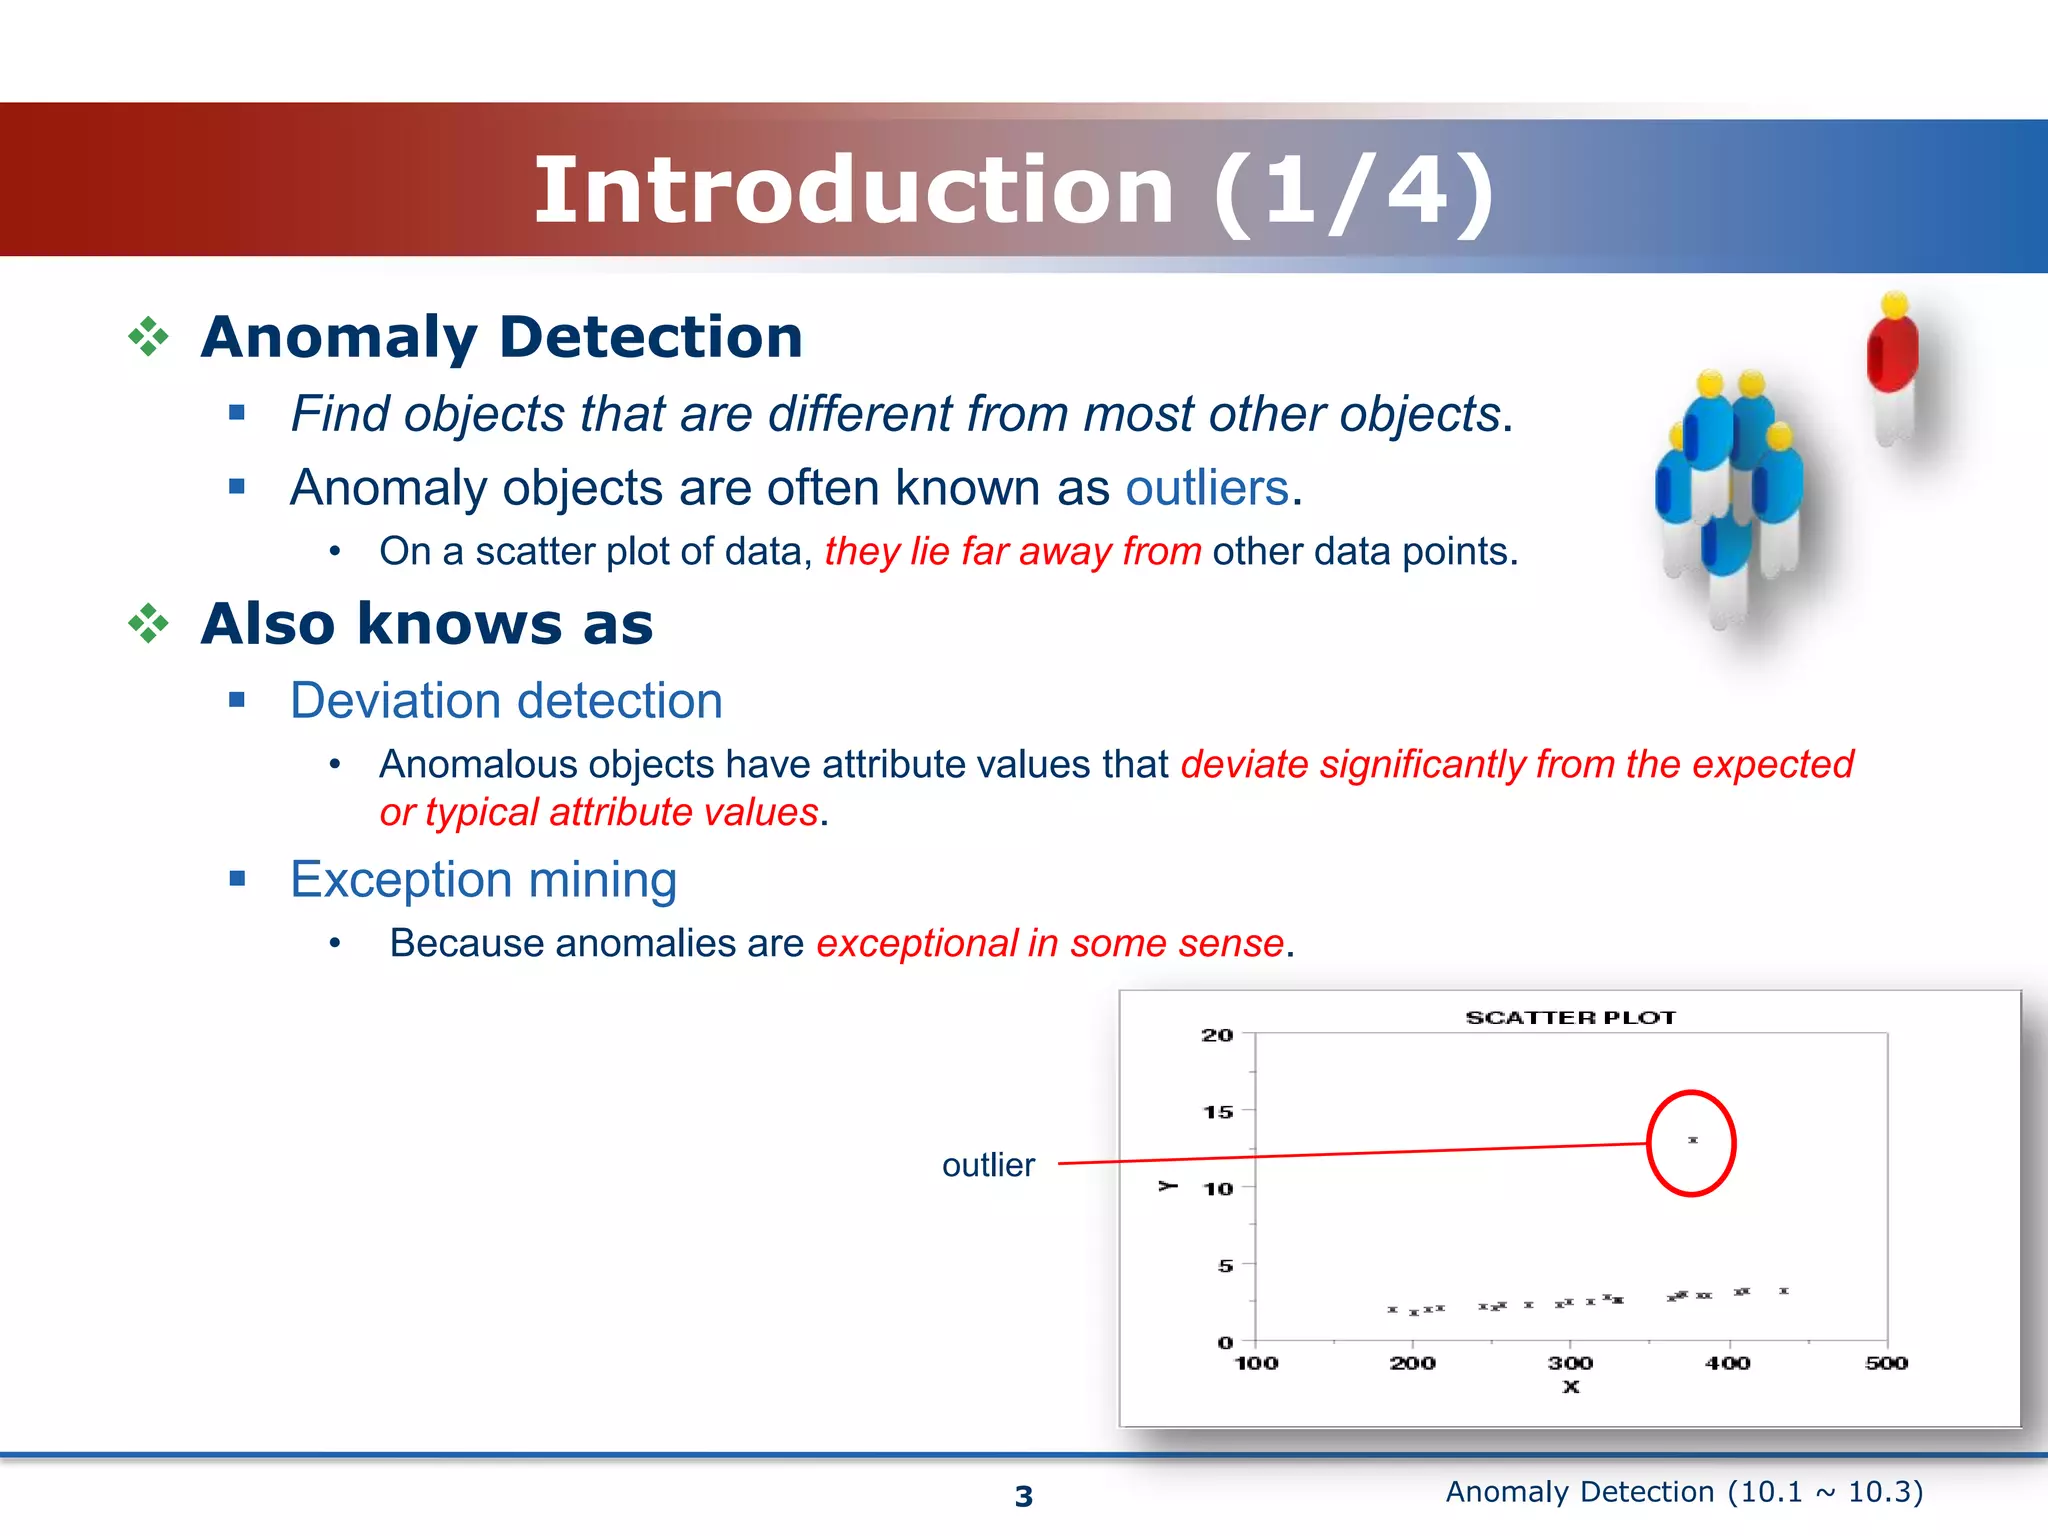
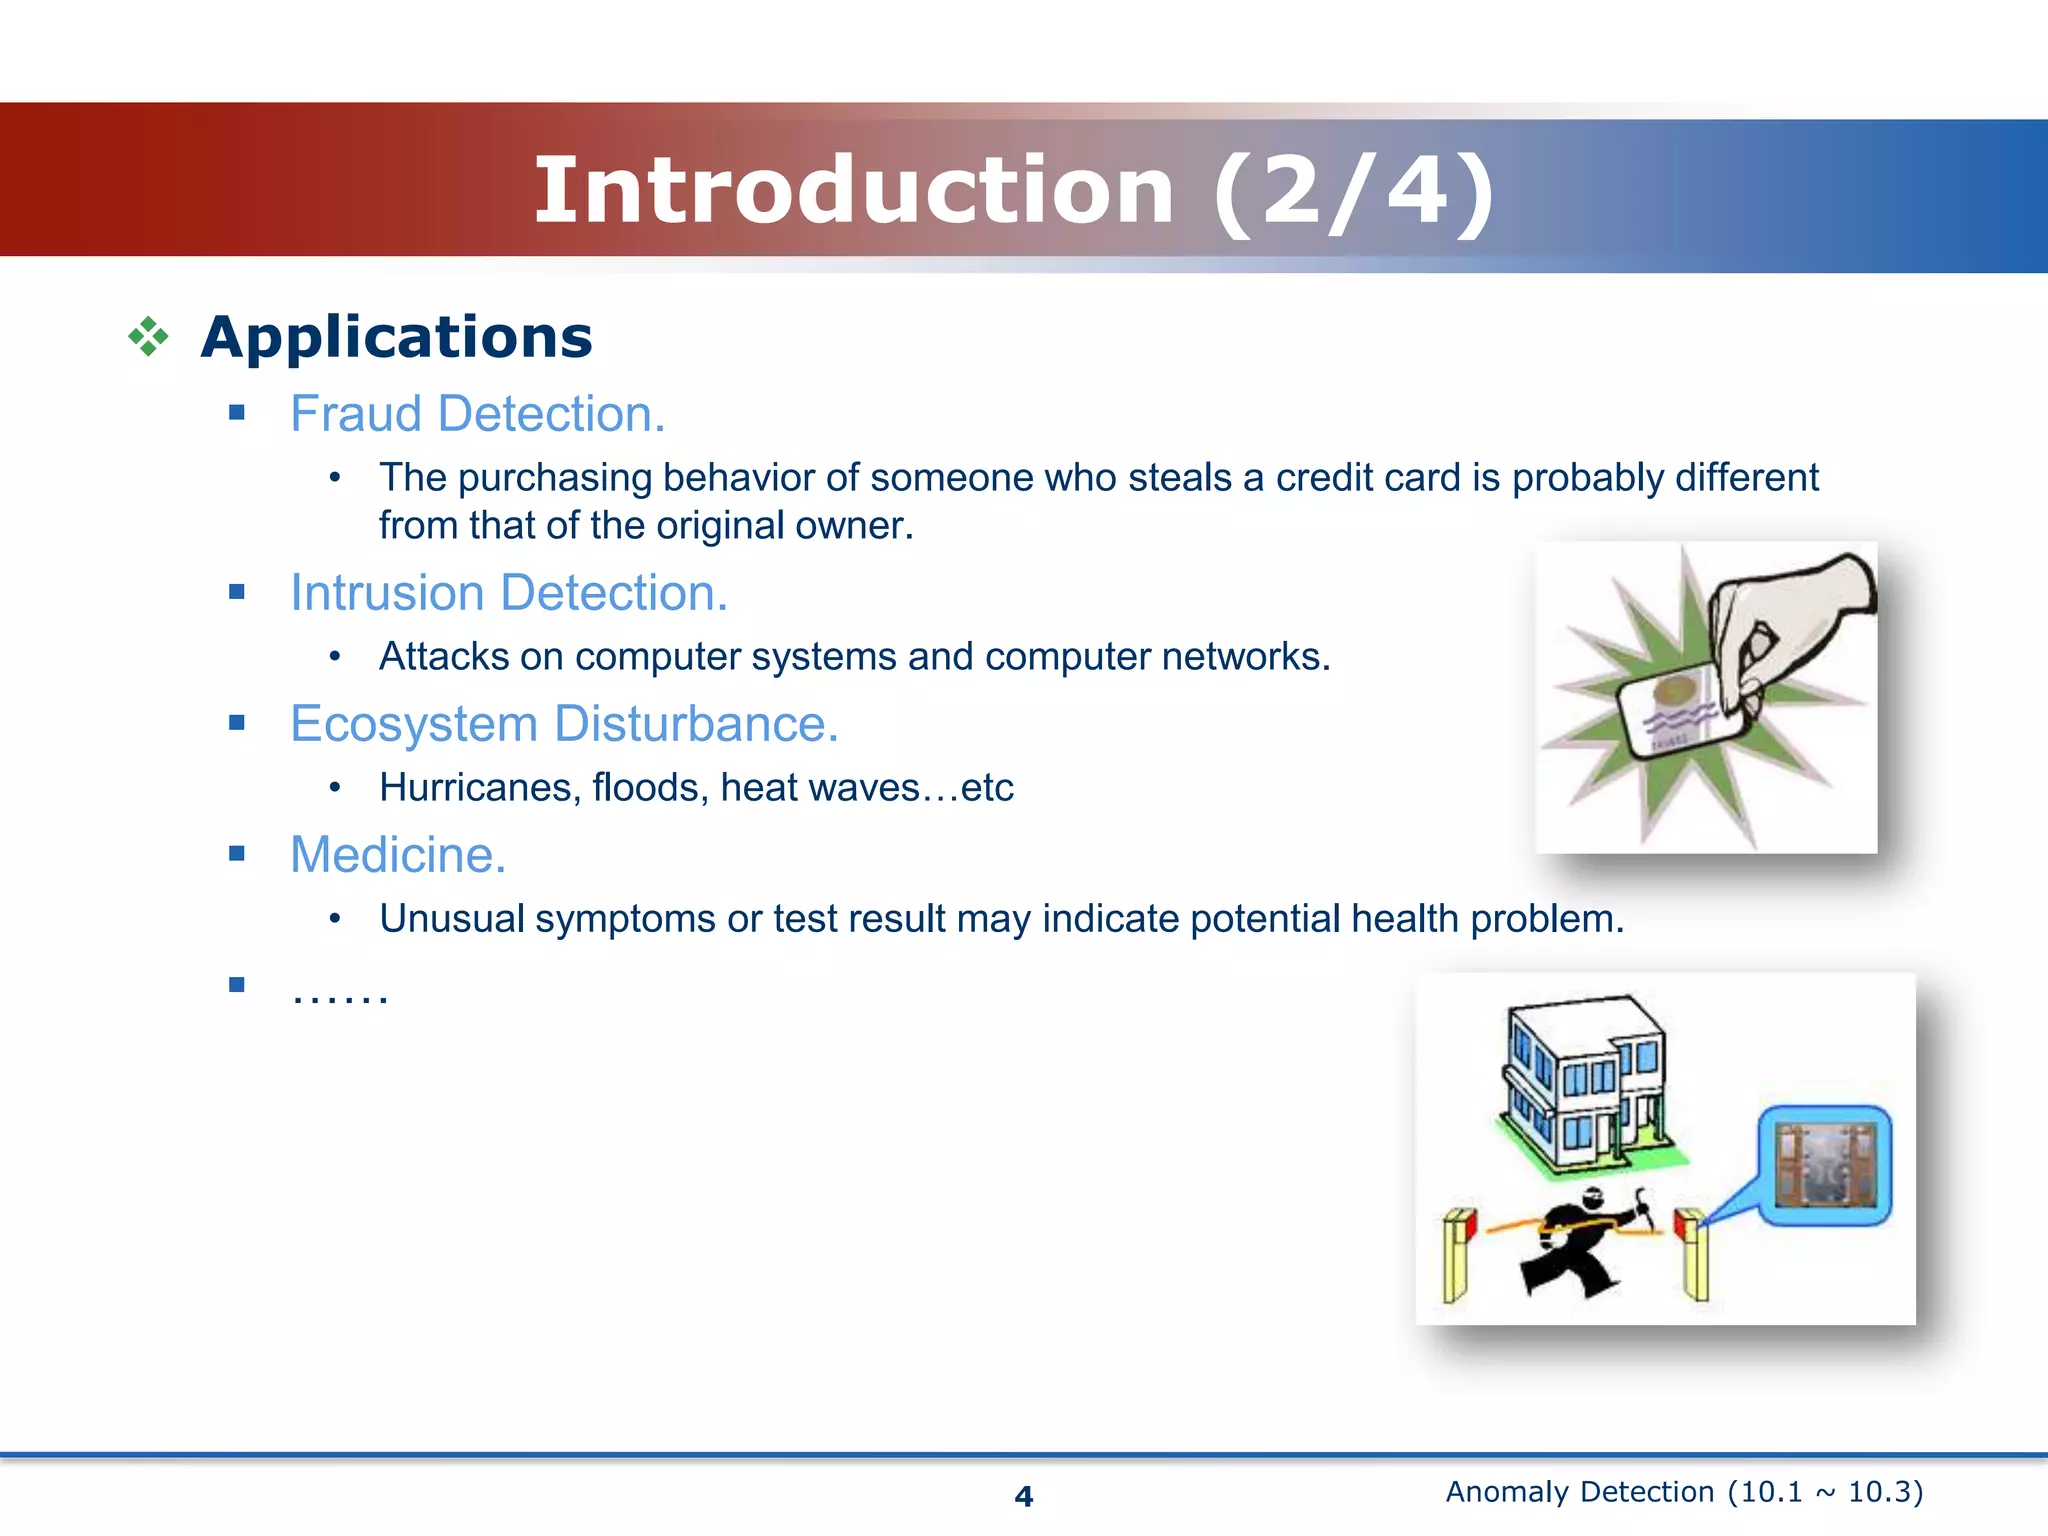
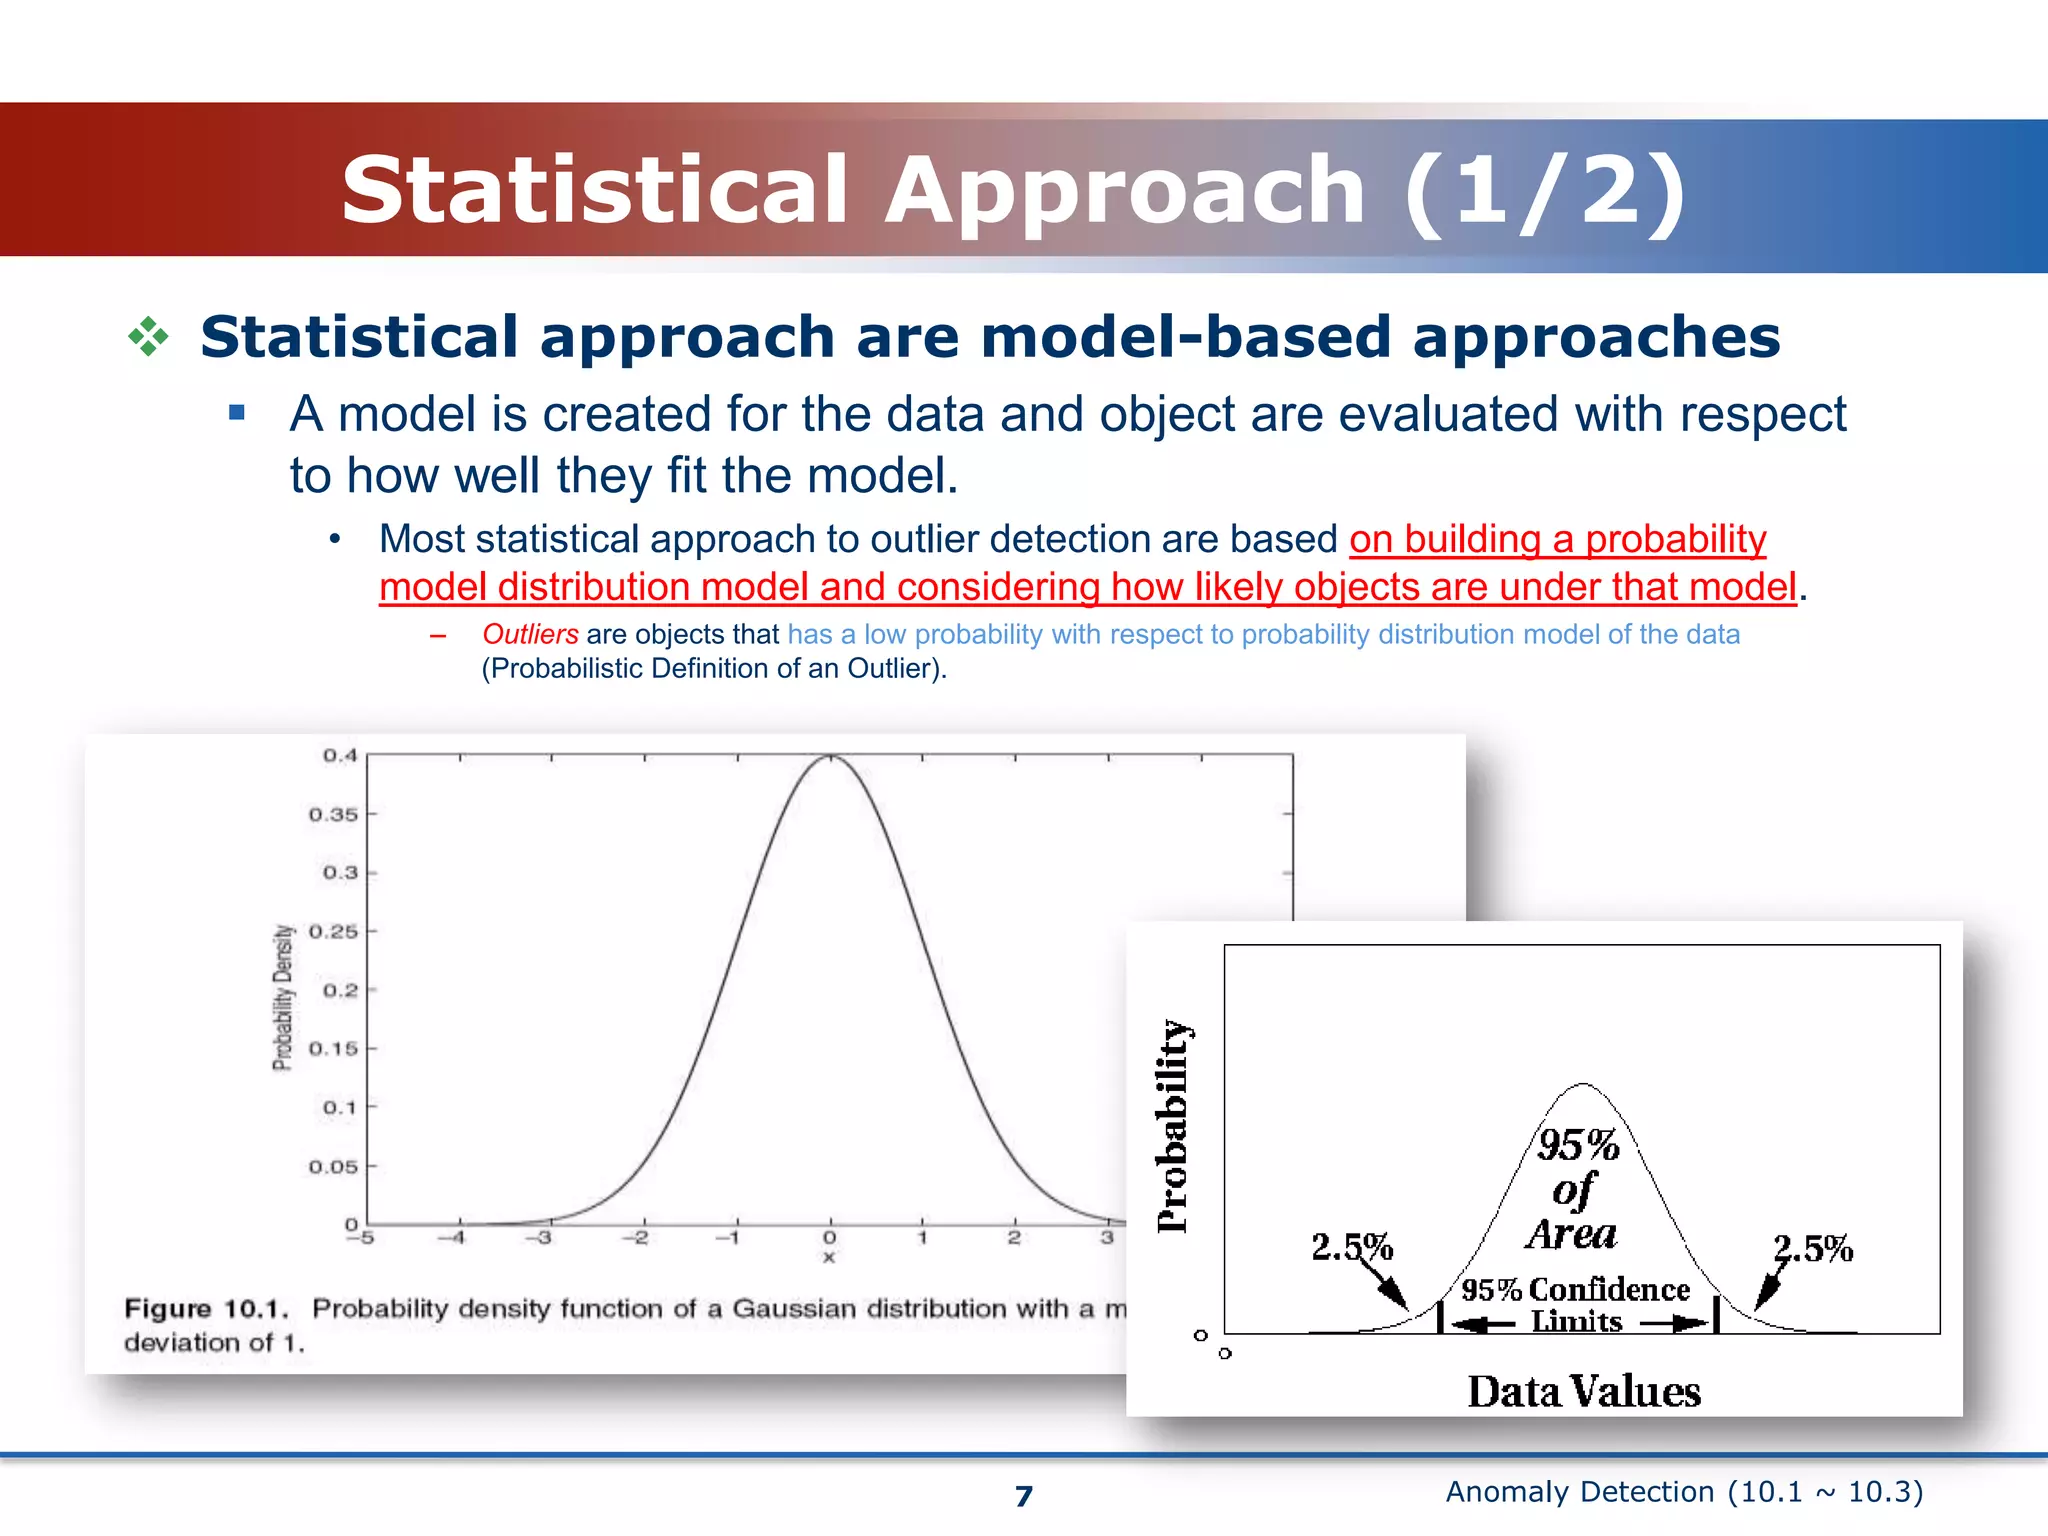
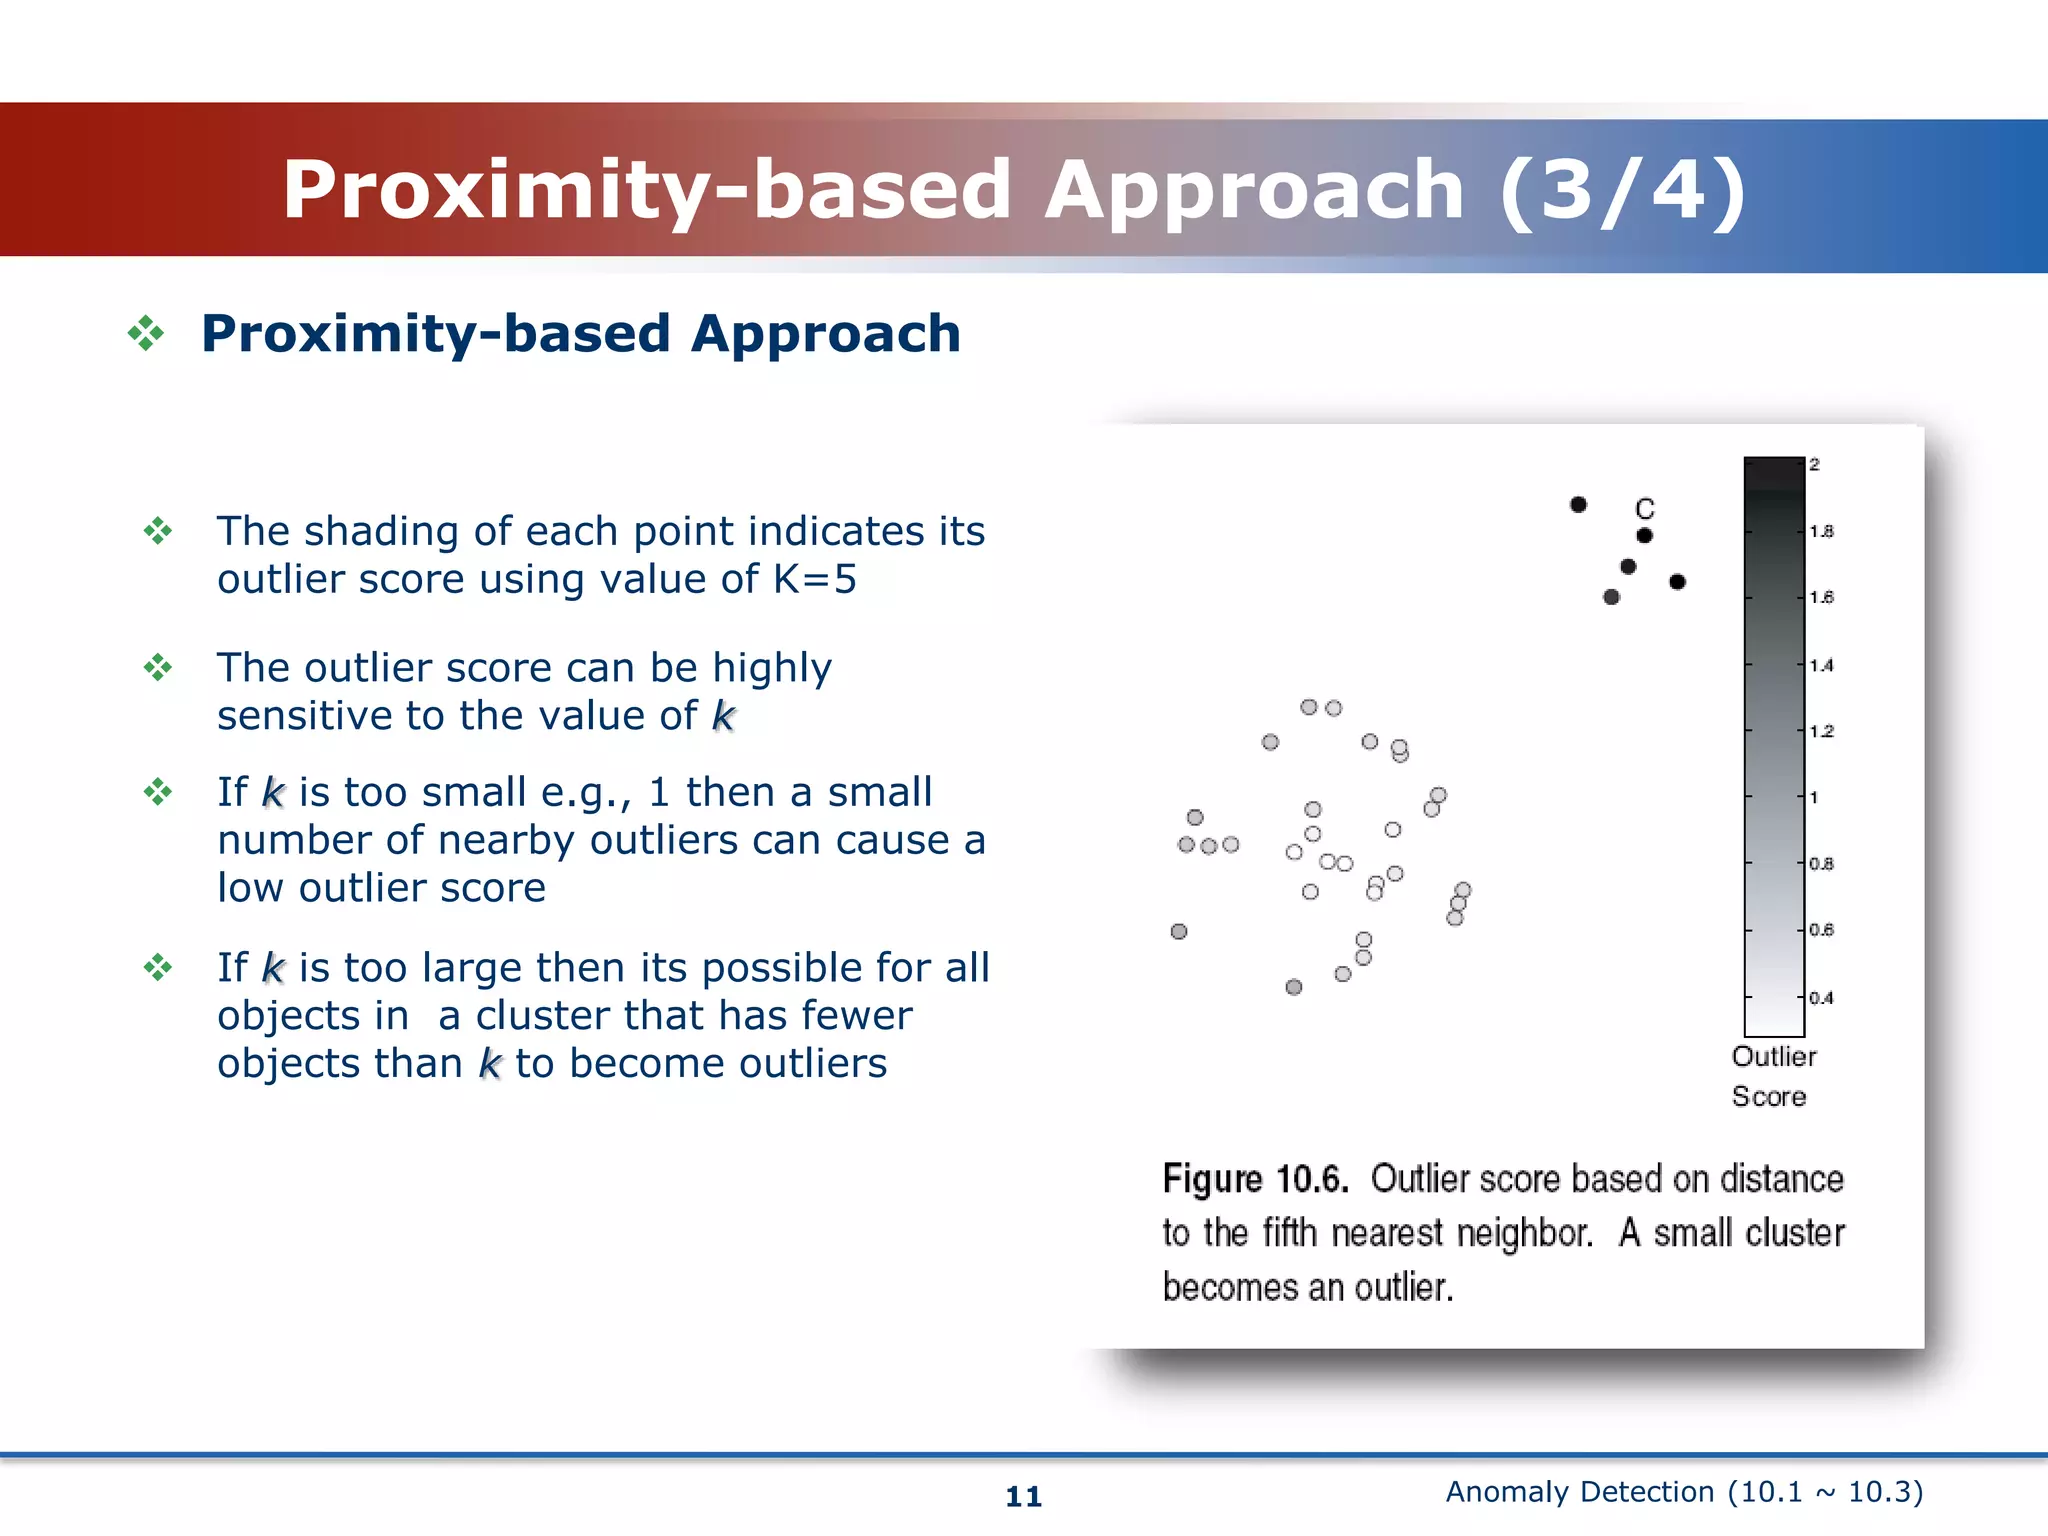
Anomaly Detection(10.1 ~ 10.3)Khalid Elshafieabolkog@dblab.cbnu.ac.krDatabase / Bioinformatics Lab.Chungbuk National University
Anomaly Detection (10.1 ~ 10.3)Contents123IntroductionStatistical ApproachProximity-based Approach2
Anomaly Detection (10.1 ~ 10.3)Introduction (1/4)Anomaly DetectionFind objects that are different from most other objects.Anomaly objects are often known as outliers.On a scatter plot of data, they lie far away from other data points.Also knows asDeviation detectionAnomalous objects have attribute values that deviate significantly from the expected or typical attribute values.Exception miningBecause anomalies are exceptional in some sense.3outlier
Anomaly Detection (10.1 ~ 10.3)Introduction (2/4)ApplicationsFraud Detection.The purchasing behavior of someone who steals a credit card is probably different from that of the original owner.Intrusion Detection.Attacks on computer systems and computer networks.Ecosystem Disturbance.Hurricanes, floods, heat waves…etcMedicine.Unusual symptoms or test result may indicate potential health problem.……4
Anomaly Detection (10.1 ~ 10.3)Introduction (3/4)What causes anomaliesData from Different SourcesSomeone who committing credit card fraud belongs to different class than those people who use credit card legitimately.Such anomalies are often of considerable interest and are the focus of anomaly detection in the field of data mining.An outlier is an observation that differs so much from other observations as to arouse suspicion that it was generated by different mechanism (Hawkins’ Definition of Outlier).Natural VariantMany data sets can be modeled by statistical distribution where the probability of a data object decrease rapidly as the distance of the object from the center of the distribution increases.Most objects are near a center (average object) and the likelihood that an object differs from this average is small.Anomalies that represent extreme or unlikely variations are often interesting.Data Measurement and Collection ErrorError in the data collection or measurement process are another source of anomalies.The goal is to eliminate such anomalies since they provide no interesting information but only reduce the quality of the data and the subsequent data analysis.5
Anomaly Detection (10.1 ~ 10.3)Introduction (4/4)Approach to Anomaly DetectionModel-based Technique.Build a model of the data.Anomalies are objects that do not fit the model very well.Proximity-based Technique.Many of the technique in this area are based on distances and are referred toasdistance-based outlier detection technique.Anomalous object are those that are distant from most of the other objects.Density-Based Technique.Objects that are in regions of low density are relatively distant from their neighbors and can be considered anomalous.6
Anomaly Detection (10.1 ~ 10.3)Statistical Approach (1/2)Statistical approach are model-based approachesA model is created for the data and object are evaluated with respect to how well they fit the model.Most statistical approach to outlier detection are based on building a probability model distribution model and considering how likely objects are under that model.Outliers are objects that has a low probability with respect to probability distribution model of the data (Probabilistic Definition of an Outlier).7
Anomaly Detection (10.1 ~ 10.3)Statistical Approach (2/2)Strength and weakness Have a firm foundation and build on standard statistical techniqueWhen there is sufficient knowledge of the data and the type of the test that should be applied, these tests can be very effective.There are a wide variety of statistical outliers test for single attributes, fewer options are available for multivariate data. Can perform poorly for high-dimensional data.8
Anomaly Detection (10.1 ~ 10.3)Proximity-based Approach (1/3)Proximity-based ApproachThe basic notation of this approach is straightforwardAn object is anomaly if it is distant from most point.More general and more easily applied than statistical approaches.Its easier to determine a meaningful proximity measure for data set than to determine its statistical distribution.One of the simplest way to measure whether an object is distant from most point is to use the distance to the k-nearest neighbor.The outlier score of an object is given by the distance to its k-nearest neighbor.The lowest value of outlier score is 0The highest value is the maximum possible value of the distance function (usually infinity).9
Anomaly Detection (10.1 ~ 10.3)Proximity-based Approach (2/4)10Approach:Compute the distance between every pair of data pointsThere are various ways to define outliers:Data points for which there are fewer than p neighboring points within a distance DThe top n data points whose distance to the kth nearest neighbor is greatestThe top n data points whose average distance to the kth nearest neighbors is greatest
Anomaly Detection (10.1 ~ 10.3)Proximity-based Approach (3/4)11Proximity-based ApproachThe shading of each point indicates its outlier score using value of K=5
The outlier score can be highly sensitive to the value of k
If k is too small e.g., 1 then a small number of nearby outliers can cause a low outlier score

Chapter 10 Anomaly Detection

  • 1.
    Anomaly Detection(10.1 ~10.3)Khalid Elshafieabolkog@dblab.cbnu.ac.krDatabase / Bioinformatics Lab.Chungbuk National University
  • 2.
    Anomaly Detection (10.1~ 10.3)Contents123IntroductionStatistical ApproachProximity-based Approach2
  • 3.
    Anomaly Detection (10.1~ 10.3)Introduction (1/4)Anomaly DetectionFind objects that are different from most other objects.Anomaly objects are often known as outliers.On a scatter plot of data, they lie far away from other data points.Also knows asDeviation detectionAnomalous objects have attribute values that deviate significantly from the expected or typical attribute values.Exception miningBecause anomalies are exceptional in some sense.3outlier
  • 4.
    Anomaly Detection (10.1~ 10.3)Introduction (2/4)ApplicationsFraud Detection.The purchasing behavior of someone who steals a credit card is probably different from that of the original owner.Intrusion Detection.Attacks on computer systems and computer networks.Ecosystem Disturbance.Hurricanes, floods, heat waves…etcMedicine.Unusual symptoms or test result may indicate potential health problem.……4
  • 5.
    Anomaly Detection (10.1~ 10.3)Introduction (3/4)What causes anomaliesData from Different SourcesSomeone who committing credit card fraud belongs to different class than those people who use credit card legitimately.Such anomalies are often of considerable interest and are the focus of anomaly detection in the field of data mining.An outlier is an observation that differs so much from other observations as to arouse suspicion that it was generated by different mechanism (Hawkins’ Definition of Outlier).Natural VariantMany data sets can be modeled by statistical distribution where the probability of a data object decrease rapidly as the distance of the object from the center of the distribution increases.Most objects are near a center (average object) and the likelihood that an object differs from this average is small.Anomalies that represent extreme or unlikely variations are often interesting.Data Measurement and Collection ErrorError in the data collection or measurement process are another source of anomalies.The goal is to eliminate such anomalies since they provide no interesting information but only reduce the quality of the data and the subsequent data analysis.5
  • 6.
    Anomaly Detection (10.1~ 10.3)Introduction (4/4)Approach to Anomaly DetectionModel-based Technique.Build a model of the data.Anomalies are objects that do not fit the model very well.Proximity-based Technique.Many of the technique in this area are based on distances and are referred toasdistance-based outlier detection technique.Anomalous object are those that are distant from most of the other objects.Density-Based Technique.Objects that are in regions of low density are relatively distant from their neighbors and can be considered anomalous.6
  • 7.
    Anomaly Detection (10.1~ 10.3)Statistical Approach (1/2)Statistical approach are model-based approachesA model is created for the data and object are evaluated with respect to how well they fit the model.Most statistical approach to outlier detection are based on building a probability model distribution model and considering how likely objects are under that model.Outliers are objects that has a low probability with respect to probability distribution model of the data (Probabilistic Definition of an Outlier).7
  • 8.
    Anomaly Detection (10.1~ 10.3)Statistical Approach (2/2)Strength and weakness Have a firm foundation and build on standard statistical techniqueWhen there is sufficient knowledge of the data and the type of the test that should be applied, these tests can be very effective.There are a wide variety of statistical outliers test for single attributes, fewer options are available for multivariate data. Can perform poorly for high-dimensional data.8
  • 9.
    Anomaly Detection (10.1~ 10.3)Proximity-based Approach (1/3)Proximity-based ApproachThe basic notation of this approach is straightforwardAn object is anomaly if it is distant from most point.More general and more easily applied than statistical approaches.Its easier to determine a meaningful proximity measure for data set than to determine its statistical distribution.One of the simplest way to measure whether an object is distant from most point is to use the distance to the k-nearest neighbor.The outlier score of an object is given by the distance to its k-nearest neighbor.The lowest value of outlier score is 0The highest value is the maximum possible value of the distance function (usually infinity).9
  • 10.
    Anomaly Detection (10.1~ 10.3)Proximity-based Approach (2/4)10Approach:Compute the distance between every pair of data pointsThere are various ways to define outliers:Data points for which there are fewer than p neighboring points within a distance DThe top n data points whose distance to the kth nearest neighbor is greatestThe top n data points whose average distance to the kth nearest neighbors is greatest
  • 11.
    Anomaly Detection (10.1~ 10.3)Proximity-based Approach (3/4)11Proximity-based ApproachThe shading of each point indicates its outlier score using value of K=5
  • 12.
    The outlier scorecan be highly sensitive to the value of k
  • 13.
    If k istoo small e.g., 1 then a small number of nearby outliers can cause a low outlier score
  • 14.
    If k istoo large then its possible for all objects in a cluster that has fewer objects than k to become outliersAnomaly Detection (10.1 ~ 10.3)Proximity-based Approach (4/4)Strength and Weaknesses Simple schema.Proximity based approach typically take O(m2) time.For large data sets this can be too expensive.Sensitive to the choice of parameters.It can’t handle dataset with regions of widely differing densities12
  • 15.