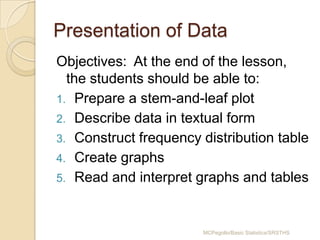
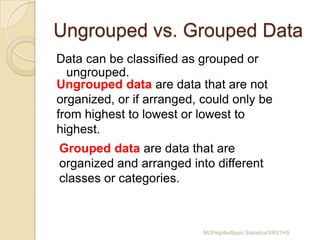
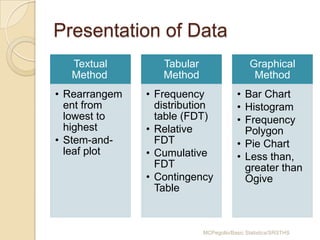
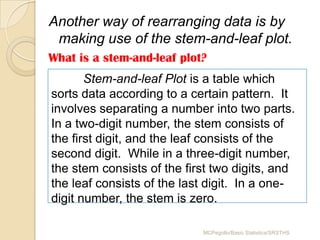
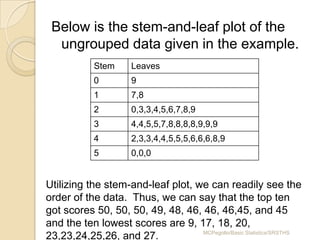
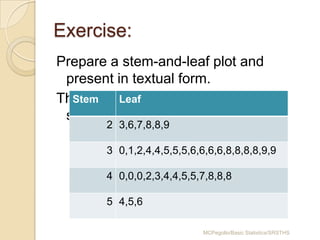
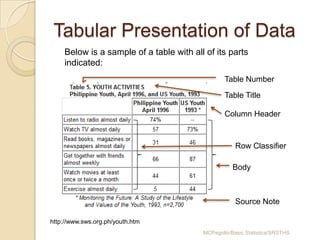
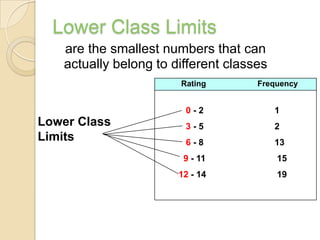
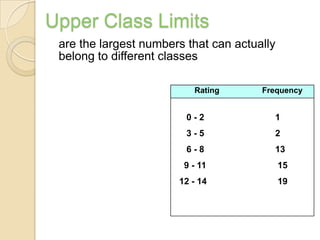
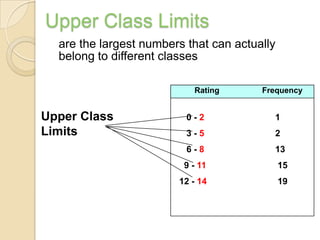
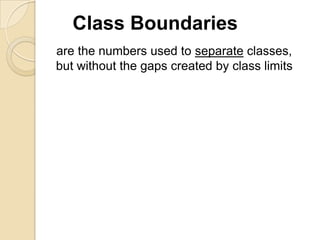
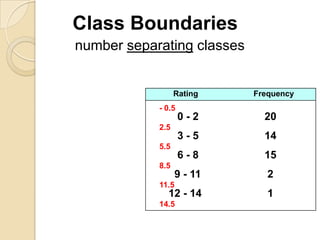
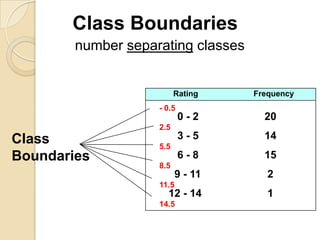
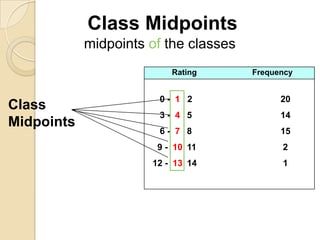
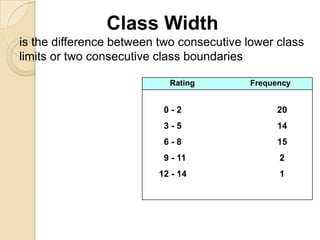
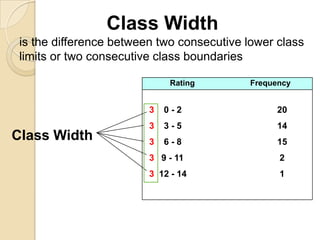
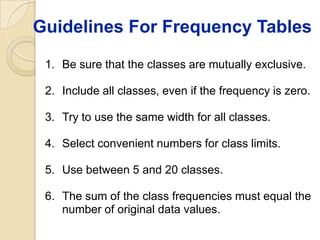
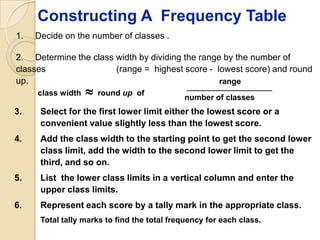
This document provides an overview of methods for presenting data, including textual, tabular, and graphical methods. It discusses topics such as ungrouped vs. grouped data, frequency distribution tables, stem-and-leaf plots, class boundaries, class midpoints, and class width. The objectives are to describe how to prepare a stem-and-leaf plot, describe data textually, construct a frequency distribution table, create graphs, and interpret graphs and tables. Examples are provided to illustrate these concepts and methods.