SlideShare a Scribd company logo
1 of 10
Power BI Tips
and Timesavers
How to use
RELATED in Power
BI
LOOKUP
Table A Table B
What is the Power BI RELATED function
The RELATED function in Power BI is a powerful tool that allows users to
quickly and easily access related data from a related table
It is similar in many ways to using lookups in Excel (VLOOKUP)
In this example we will use the Related function to return a standard cost per
mile using a type of vehicle as a lookup reference
How to use it
You can download the Excel file from our site to follow along
Load the Data and set the
relationships
Vehicle in the Miles tables joins to the
Vehicle ID in the Vehicles Table
Type in the Vehicles table joins to the
Vehicle Type in the Costs Table
Vehicle Type ID in the Vehicle Types table
joins to the Vehicle Type in the Costs table
Add a summary table to the page
Drag a new table visual object to the canvas and bring these fields in
Vehicle from the Miles table, Vehicle Type Name from the Vehicle Types
table, Cost per Mile from the Costs table and Sum of the Distance [mi]
from the Miles table
Now add the calculated
column
On the data pane, select the Miles table and click
the New Column icon
Then paste in this DAX code
Mileage Cost
= related(Costs[Cost per Mile ])*Miles[Distance
[mi]]]
press enter and the new column is created
The RELATED Function
Mileage Cost
= related(Costs[Cost per Mile ])*Miles[Distance
[mi]]]
This highlighted section is the related function, it
requires two parts
The Table Name
= related(Costs[Cost per Mile ])
And the Field Name
= related(Costs[Cost per Mile ])
Errors to avoid
The Related function only works when a single value can be returned
It cannot work if there is no clear relationship to return a single value, if a
relationship returns many possible results it cannot be used
The solution there is to use RELATEDTABLE and perform a aggregation, this topic
will be covered in a future post so it can be fully explained
The Related function is easy to learn, especially if you have some experience
of using LOOKUPS in Excel, and can help to simplify your data modelling
There is not much to go wrong if you focus on getting the correct
relationships between your tables
We hope you find this useful
For more Tips, Tricks and
Timesavers, visit our website
Business Analytics Blog – Select Distinct
Credit: simon.harrison@selectdistinct.co.uk

More Related Content

Similar to What is the Related Function for in Power BI

ACTG Tableau intro labDownload the TableauLab file and look ov.docx
ACTG   Tableau intro labDownload the TableauLab file and look ov.docxACTG   Tableau intro labDownload the TableauLab file and look ov.docx
ACTG Tableau intro labDownload the TableauLab file and look ov.docx
nettletondevon
 
C:\fakepath\ssis ssas sssrs_pps_hong_bingli_v2003
C:\fakepath\ssis ssas sssrs_pps_hong_bingli_v2003C:\fakepath\ssis ssas sssrs_pps_hong_bingli_v2003
C:\fakepath\ssis ssas sssrs_pps_hong_bingli_v2003
Hong-Bing Li
 

Similar to What is the Related Function for in Power BI (20)

Linear modeling in Transportation problem: Need of reliable Public transporta...
Linear modeling in Transportation problem: Need of reliable Public transporta...Linear modeling in Transportation problem: Need of reliable Public transporta...
Linear modeling in Transportation problem: Need of reliable Public transporta...
 
Calculated Columns and Measures in Power BI.pptx
Calculated Columns and Measures in Power BI.pptxCalculated Columns and Measures in Power BI.pptx
Calculated Columns and Measures in Power BI.pptx
 
MS Bi Portfolio Gregory Lee
MS Bi Portfolio Gregory LeeMS Bi Portfolio Gregory Lee
MS Bi Portfolio Gregory Lee
 
Tableau online training
Tableau online trainingTableau online training
Tableau online training
 
Tableau online training || Tableau Server
Tableau online training || Tableau ServerTableau online training || Tableau Server
Tableau online training || Tableau Server
 
Tableau online training || Tableau Server
Tableau online training || Tableau ServerTableau online training || Tableau Server
Tableau online training || Tableau Server
 
Ac_2007_397_Use_of_Spreadsheets_with_Sca.pdf
Ac_2007_397_Use_of_Spreadsheets_with_Sca.pdfAc_2007_397_Use_of_Spreadsheets_with_Sca.pdf
Ac_2007_397_Use_of_Spreadsheets_with_Sca.pdf
 
Fahri tugas cloud1
Fahri tugas cloud1Fahri tugas cloud1
Fahri tugas cloud1
 
ACTG Tableau intro labDownload the TableauLab file and look ov.docx
ACTG   Tableau intro labDownload the TableauLab file and look ov.docxACTG   Tableau intro labDownload the TableauLab file and look ov.docx
ACTG Tableau intro labDownload the TableauLab file and look ov.docx
 
DATA SCIENCE TRAINING IN HYDERABAD
DATA SCIENCE TRAINING IN HYDERABADDATA SCIENCE TRAINING IN HYDERABAD
DATA SCIENCE TRAINING IN HYDERABAD
 
Getting power bi
Getting power biGetting power bi
Getting power bi
 
Office excel tips and tricks 201101
Office excel tips and tricks 201101Office excel tips and tricks 201101
Office excel tips and tricks 201101
 
Dax best practices.pdf
Dax best practices.pdfDax best practices.pdf
Dax best practices.pdf
 
C:\fakepath\ssis ssas sssrs_pps_hong_bingli_v2003
C:\fakepath\ssis ssas sssrs_pps_hong_bingli_v2003C:\fakepath\ssis ssas sssrs_pps_hong_bingli_v2003
C:\fakepath\ssis ssas sssrs_pps_hong_bingli_v2003
 
HARJOT.ppt
HARJOT.pptHARJOT.ppt
HARJOT.ppt
 
ADVANCED MODELLING.pptx
ADVANCED MODELLING.pptxADVANCED MODELLING.pptx
ADVANCED MODELLING.pptx
 
Weka term paper(siddharth 10 bm60086)
Weka term paper(siddharth 10 bm60086)Weka term paper(siddharth 10 bm60086)
Weka term paper(siddharth 10 bm60086)
 
1a s4 i creating runcharts final
1a s4 i creating runcharts final1a s4 i creating runcharts final
1a s4 i creating runcharts final
 
Excel for research
Excel  for researchExcel  for research
Excel for research
 
How to use Power Pivot in Excel
How to use Power Pivot in ExcelHow to use Power Pivot in Excel
How to use Power Pivot in Excel
 

More from Select Distinct Limited

Power BI Tips Top N Measures.pptx
Power BI Tips Top N Measures.pptxPower BI Tips Top N Measures.pptx
Power BI Tips Top N Measures.pptx
Select Distinct Limited
 

More from Select Distinct Limited (20)

Year on Year Comparison in Power BI.pptx
Year on Year Comparison in Power BI.pptxYear on Year Comparison in Power BI.pptx
Year on Year Comparison in Power BI.pptx
 
Sync Slicers in Power BI a step by step guide
Sync Slicers in Power BI a step by step guideSync Slicers in Power BI a step by step guide
Sync Slicers in Power BI a step by step guide
 
Using Google Search Console Data in Power BI.pptx
Using Google Search Console Data in Power BI.pptxUsing Google Search Console Data in Power BI.pptx
Using Google Search Console Data in Power BI.pptx
 
Data Lake v Data Warehouse. What is the difference?
Data Lake v Data Warehouse. What is the difference?Data Lake v Data Warehouse. What is the difference?
Data Lake v Data Warehouse. What is the difference?
 
How to Create Drop Down Lists in Excel, step by step
How to Create Drop Down Lists in Excel, step by stepHow to Create Drop Down Lists in Excel, step by step
How to Create Drop Down Lists in Excel, step by step
 
Top 5 SQL Tips and Timesaver 2023, our most popular posts
Top 5 SQL Tips and Timesaver 2023, our most popular postsTop 5 SQL Tips and Timesaver 2023, our most popular posts
Top 5 SQL Tips and Timesaver 2023, our most popular posts
 
Top 5 Power BI tips 2023 most popular blog posts
Top 5 Power BI tips 2023 most popular blog postsTop 5 Power BI tips 2023 most popular blog posts
Top 5 Power BI tips 2023 most popular blog posts
 
CTEs in SQL.pptx
CTEs in SQL.pptxCTEs in SQL.pptx
CTEs in SQL.pptx
 
Divide by Zero Errors
Divide by Zero ErrorsDivide by Zero Errors
Divide by Zero Errors
 
When to transform data for Power BI.pptx
When to transform data for Power BI.pptxWhen to transform data for Power BI.pptx
When to transform data for Power BI.pptx
 
Power BI KPIs
Power BI KPIsPower BI KPIs
Power BI KPIs
 
Direction of travel on a map in Power BI.pptx
Direction of travel on a map in Power BI.pptxDirection of travel on a map in Power BI.pptx
Direction of travel on a map in Power BI.pptx
 
UNION in DAX
UNION in DAXUNION in DAX
UNION in DAX
 
APPEND data in Power Query
APPEND data in Power QueryAPPEND data in Power Query
APPEND data in Power Query
 
Power BI Connect to Google BigQuery.pptx
Power BI Connect to Google BigQuery.pptxPower BI Connect to Google BigQuery.pptx
Power BI Connect to Google BigQuery.pptx
 
Group by ROLLUP in SQL Server
Group by ROLLUP in SQL ServerGroup by ROLLUP in SQL Server
Group by ROLLUP in SQL Server
 
Advanced Top N Measures in Power BI
Advanced Top N Measures in Power BIAdvanced Top N Measures in Power BI
Advanced Top N Measures in Power BI
 
Custom Formats in Power BI
Custom Formats in Power BICustom Formats in Power BI
Custom Formats in Power BI
 
Power BI Tips Top N Measures.pptx
Power BI Tips Top N Measures.pptxPower BI Tips Top N Measures.pptx
Power BI Tips Top N Measures.pptx
 
SQL Tips UNPIVOT Function.pptx
SQL Tips UNPIVOT Function.pptxSQL Tips UNPIVOT Function.pptx
SQL Tips UNPIVOT Function.pptx
 

Recently uploaded

一比一原版西悉尼大学毕业证成绩单如何办理
一比一原版西悉尼大学毕业证成绩单如何办理一比一原版西悉尼大学毕业证成绩单如何办理
一比一原版西悉尼大学毕业证成绩单如何办理
pyhepag
 
一比一原版纽卡斯尔大学毕业证成绩单如何办理
一比一原版纽卡斯尔大学毕业证成绩单如何办理一比一原版纽卡斯尔大学毕业证成绩单如何办理
一比一原版纽卡斯尔大学毕业证成绩单如何办理
cyebo
 
一比一原版(Monash毕业证书)莫纳什大学毕业证成绩单如何办理
一比一原版(Monash毕业证书)莫纳什大学毕业证成绩单如何办理一比一原版(Monash毕业证书)莫纳什大学毕业证成绩单如何办理
一比一原版(Monash毕业证书)莫纳什大学毕业证成绩单如何办理
pyhepag
 
一比一原版阿德莱德大学毕业证成绩单如何办理
一比一原版阿德莱德大学毕业证成绩单如何办理一比一原版阿德莱德大学毕业证成绩单如何办理
一比一原版阿德莱德大学毕业证成绩单如何办理
pyhepag
 
Fuzzy Sets decision making under information of uncertainty
Fuzzy Sets decision making under information of uncertaintyFuzzy Sets decision making under information of uncertainty
Fuzzy Sets decision making under information of uncertainty
RafigAliyev2
 
一比一原版加利福尼亚大学尔湾分校毕业证成绩单如何办理
一比一原版加利福尼亚大学尔湾分校毕业证成绩单如何办理一比一原版加利福尼亚大学尔湾分校毕业证成绩单如何办理
一比一原版加利福尼亚大学尔湾分校毕业证成绩单如何办理
pyhepag
 
Abortion pills in Dammam Saudi Arabia// +966572737505 // buy cytotec
Abortion pills in Dammam Saudi Arabia// +966572737505 // buy cytotecAbortion pills in Dammam Saudi Arabia// +966572737505 // buy cytotec
Abortion pills in Dammam Saudi Arabia// +966572737505 // buy cytotec
Abortion pills in Riyadh +966572737505 get cytotec
 
一比一原版麦考瑞大学毕业证成绩单如何办理
一比一原版麦考瑞大学毕业证成绩单如何办理一比一原版麦考瑞大学毕业证成绩单如何办理
一比一原版麦考瑞大学毕业证成绩单如何办理
cyebo
 

Recently uploaded (20)

一比一原版西悉尼大学毕业证成绩单如何办理
一比一原版西悉尼大学毕业证成绩单如何办理一比一原版西悉尼大学毕业证成绩单如何办理
一比一原版西悉尼大学毕业证成绩单如何办理
 
Supply chain analytics to combat the effects of Ukraine-Russia-conflict
Supply chain analytics to combat the effects of Ukraine-Russia-conflictSupply chain analytics to combat the effects of Ukraine-Russia-conflict
Supply chain analytics to combat the effects of Ukraine-Russia-conflict
 
Webinar One View, Multiple Systems No-Code Integration of Salesforce and ERPs
Webinar One View, Multiple Systems No-Code Integration of Salesforce and ERPsWebinar One View, Multiple Systems No-Code Integration of Salesforce and ERPs
Webinar One View, Multiple Systems No-Code Integration of Salesforce and ERPs
 
一比一原版纽卡斯尔大学毕业证成绩单如何办理
一比一原版纽卡斯尔大学毕业证成绩单如何办理一比一原版纽卡斯尔大学毕业证成绩单如何办理
一比一原版纽卡斯尔大学毕业证成绩单如何办理
 
一比一原版(Monash毕业证书)莫纳什大学毕业证成绩单如何办理
一比一原版(Monash毕业证书)莫纳什大学毕业证成绩单如何办理一比一原版(Monash毕业证书)莫纳什大学毕业证成绩单如何办理
一比一原版(Monash毕业证书)莫纳什大学毕业证成绩单如何办理
 
2024 Q1 Tableau User Group Leader Quarterly Call
2024 Q1 Tableau User Group Leader Quarterly Call2024 Q1 Tableau User Group Leader Quarterly Call
2024 Q1 Tableau User Group Leader Quarterly Call
 
一比一原版阿德莱德大学毕业证成绩单如何办理
一比一原版阿德莱德大学毕业证成绩单如何办理一比一原版阿德莱德大学毕业证成绩单如何办理
一比一原版阿德莱德大学毕业证成绩单如何办理
 
Data analytics courses in Nepal Presentation
Data analytics courses in Nepal PresentationData analytics courses in Nepal Presentation
Data analytics courses in Nepal Presentation
 
How I opened a fake bank account and didn't go to prison
How I opened a fake bank account and didn't go to prisonHow I opened a fake bank account and didn't go to prison
How I opened a fake bank account and didn't go to prison
 
Fuzzy Sets decision making under information of uncertainty
Fuzzy Sets decision making under information of uncertaintyFuzzy Sets decision making under information of uncertainty
Fuzzy Sets decision making under information of uncertainty
 
Easy and simple project file on mp online
Easy and simple project file on mp onlineEasy and simple project file on mp online
Easy and simple project file on mp online
 
basics of data science with application areas.pdf
basics of data science with application areas.pdfbasics of data science with application areas.pdf
basics of data science with application areas.pdf
 
一比一原版加利福尼亚大学尔湾分校毕业证成绩单如何办理
一比一原版加利福尼亚大学尔湾分校毕业证成绩单如何办理一比一原版加利福尼亚大学尔湾分校毕业证成绩单如何办理
一比一原版加利福尼亚大学尔湾分校毕业证成绩单如何办理
 
2024 Q2 Orange County (CA) Tableau User Group Meeting
2024 Q2 Orange County (CA) Tableau User Group Meeting2024 Q2 Orange County (CA) Tableau User Group Meeting
2024 Q2 Orange County (CA) Tableau User Group Meeting
 
Abortion pills in Dammam Saudi Arabia// +966572737505 // buy cytotec
Abortion pills in Dammam Saudi Arabia// +966572737505 // buy cytotecAbortion pills in Dammam Saudi Arabia// +966572737505 // buy cytotec
Abortion pills in Dammam Saudi Arabia// +966572737505 // buy cytotec
 
Atlantic Grupa Case Study (Mintec Data AI)
Atlantic Grupa Case Study (Mintec Data AI)Atlantic Grupa Case Study (Mintec Data AI)
Atlantic Grupa Case Study (Mintec Data AI)
 
Generative AI for Trailblazers_ Unlock the Future of AI.pdf
Generative AI for Trailblazers_ Unlock the Future of AI.pdfGenerative AI for Trailblazers_ Unlock the Future of AI.pdf
Generative AI for Trailblazers_ Unlock the Future of AI.pdf
 
一比一原版麦考瑞大学毕业证成绩单如何办理
一比一原版麦考瑞大学毕业证成绩单如何办理一比一原版麦考瑞大学毕业证成绩单如何办理
一比一原版麦考瑞大学毕业证成绩单如何办理
 
Pre-ProductionImproveddsfjgndflghtgg.pptx
Pre-ProductionImproveddsfjgndflghtgg.pptxPre-ProductionImproveddsfjgndflghtgg.pptx
Pre-ProductionImproveddsfjgndflghtgg.pptx
 
Artificial_General_Intelligence__storm_gen_article.pdf
Artificial_General_Intelligence__storm_gen_article.pdfArtificial_General_Intelligence__storm_gen_article.pdf
Artificial_General_Intelligence__storm_gen_article.pdf
 

What is the Related Function for in Power BI

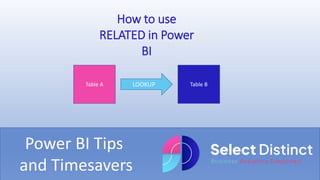
  • 1. Power BI Tips and Timesavers How to use RELATED in Power BI LOOKUP Table A Table B
  • 2. What is the Power BI RELATED function The RELATED function in Power BI is a powerful tool that allows users to quickly and easily access related data from a related table It is similar in many ways to using lookups in Excel (VLOOKUP) In this example we will use the Related function to return a standard cost per mile using a type of vehicle as a lookup reference
  • 3. How to use it You can download the Excel file from our site to follow along
  • 4. Load the Data and set the relationships Vehicle in the Miles tables joins to the Vehicle ID in the Vehicles Table Type in the Vehicles table joins to the Vehicle Type in the Costs Table Vehicle Type ID in the Vehicle Types table joins to the Vehicle Type in the Costs table
  • 5. Add a summary table to the page Drag a new table visual object to the canvas and bring these fields in Vehicle from the Miles table, Vehicle Type Name from the Vehicle Types table, Cost per Mile from the Costs table and Sum of the Distance [mi] from the Miles table
  • 6. Now add the calculated column On the data pane, select the Miles table and click the New Column icon Then paste in this DAX code Mileage Cost = related(Costs[Cost per Mile ])*Miles[Distance [mi]]] press enter and the new column is created
  • 7. The RELATED Function Mileage Cost = related(Costs[Cost per Mile ])*Miles[Distance [mi]]] This highlighted section is the related function, it requires two parts The Table Name = related(Costs[Cost per Mile ]) And the Field Name = related(Costs[Cost per Mile ])
  • 8. Errors to avoid The Related function only works when a single value can be returned It cannot work if there is no clear relationship to return a single value, if a relationship returns many possible results it cannot be used The solution there is to use RELATEDTABLE and perform a aggregation, this topic will be covered in a future post so it can be fully explained
  • 9. The Related function is easy to learn, especially if you have some experience of using LOOKUPS in Excel, and can help to simplify your data modelling There is not much to go wrong if you focus on getting the correct relationships between your tables We hope you find this useful
  • 10. For more Tips, Tricks and Timesavers, visit our website Business Analytics Blog – Select Distinct Credit: simon.harrison@selectdistinct.co.uk