Custom Formats in Power BI
•Download as PPTX, PDF•
0 likes•3 views

Power BI comes ready loaded with a wide range of format options But did you know that you are not limited to the pre-defined options Some organisations have specific standards for things such as date formats, these can be catered for using custom formats https://www.selectdistinct.co.uk/2023/07/20/custom-formats-in-power-bi/ #powerbi #dataviz #customformats
Report
Share
Report
Share

Recommended
BA 385, Principles of FinanceCapstone Assignment Group Pro For.docx
BA 385, Principles of Finance
Capstone Assignment Group Pro Forma Financial Statement Project
In your groups, using the Financial Statement Projection Spreadsheet used for BA499, develop a full set of projected financial statements for a hypothetical company.
To complete this project provide the following:
1. A description of your hypothetical company. This description must make it clear to me what the company does; the product or service it will be providing; the target market to be served and what portion of the target market the company plans to serve (this must be realistic and specify the number of people), where it will be located, the number of employees it will have, how the company anticipates financing the business, and any other information necessary for me to understand the company.
2. A detailed list of assumptions used to project the financial statements. These assumptions must include how sales were computed based on the target market you will serve.
3. The excel file that includes the group’s projected financial statements. This will show 3 years of projections with the first year by month.
4. A short description (300-600 words for each group member) written by each member of the group describing what they learned from the project. These should be written separately, not as a group, although I want you to include them in one WORD file. Be sure to show each members name at the beginning of their section.
5. The project will be submitted the same way you have submitted each of the previous Bb assignments into the Bb submission folder. This is a challenging project, but will substantially help prepare you for BA 499. The time to start is upon you. Your financial statements will not be perfect, but you must be clear about all your assumptions. When you are making a wild guess make it clear in your assumptions that you are doing that. You can be far more accurate than you think. Be reasonable, talk to other business people, and use ratios for your industry to help you with your projections. Your sales projections should be based on your target market. How many people will you sell to, how many times, and what will be the average amount of a transaction. Demonstrate how you have the capacity to sell to that number of people.
Good luck! Remember this assignment uses the same financial statement projection model that you use in BA 499. See http://www.sou.edu/business/dungan/ba385/Projects/GradeSheetProject2R.doc for grade sheet.
TOCFinancial Plan Forecast TemplateBA499Table of ContentsWorksheetContentsInput WorksheetsIntroIntroduction plus basic inputs for company name and start dateSalesInputs for Sales and COS by product/servicePeopleInputs for personnel expenses including benefitsISInputs for other income statement items (includes summary IS)BSInputs for other balance sheet items (includes summary BS)CFInputs for other cash flow items (includes summary CF)BreakInputs for breakeven analysisPVInputs for present value analy ...
Odoo 13 Report Layout Configuration
Report Layout Configuration is enabled in Odoo 13. We can Customize the look of reports in Odoo 13. Odoo 13 offers us features such as style,colour,Background,etc to our likes.
8 Factors to Keep in Mind for Your Next Business Report.pptx
Unlock the potential of your business reports with Debt Nirvana's expert guidance. Our comprehensive approach to crafting efficient business information reports ensures that your data is not just presented, but truly understood. From easy-to-understand visualizations to strategic color palettes and clear structural layouts, we empower you to convey your message effectively. With attention to detail on every aspect, including background design and font selection, our solutions guarantee a professional and impactful presentation of your achievements. Say goodbye to mundane reports and hello to insightful presentations that command attention. Contact us at +91-9810010294 or via email at rvm@debtnirvana.com to elevate your reporting game today!
Report Layout Configuration in Odoo 13
Reports can be easily customized in Odoo 13. Odoo 13 enables us to change the style, color, background etc of our report.
How to make effective presentation.pptx
To make an effective presentation on PowerPoint, here are some tips to keep in mind:
1. **Start with a goal**: Identify the purpose of your presentation and what you want to achieve with it. This will help you structure your content and ensure that it is relevant to your audience ¹.
2. **Less is more**: Avoid cluttering your slides with too much text or images. Keep your slides simple and easy to read. Use bullet points to highlight key information and avoid using too many transitions ¹⁴.
3. **Consider your typeface**: Choose a font that is easy to read and use it consistently throughout your presentation. Avoid using too many different fonts or font sizes, as this can be distracting ¹.
4. **Make bullet points count**: Use bullet points to highlight key information and keep your content concise. Avoid using full sentences or paragraphs on your slides ¹².
5. **Think in color**: Use color to highlight important information and make your slides visually appealing. However, avoid using too many colors or bright colors that can be hard on the eyes ¹.
6. **Take a look from the top down**: Review your presentation from the perspective of your audience. Ensure that your content is easy to read and that your slides are visually appealing ¹.
7. **Start with templates**: Consider using pre-designed templates to help you create a professional-looking presentation. This can save you time and ensure that your presentation looks polished ¹⁵.
I hope these tips help you create an effective PowerPoint presentation! Let me know if you have any other questions.
Source: Conversation with Bing, 11/01/2024
(1) 8 Tips to Make the Best PowerPoint Presentations - How-To Geek. https://www.howtogeek.com/712825/8-tips-to-make-the-best-powerpoint-presentations/.
(2) Tips for creating and delivering an effective presentation. https://support.microsoft.com/en-us/office/tips-for-creating-and-delivering-an-effective-presentation-f43156b0-20d2-4c51-8345-0c337cefb88b.
(3) Tips for Making Effective PowerPoint Presentations. https://www.ncsl.org/legislative-staff/lscc/tips-for-making-effective-powerpoint-p
Cable Slides How To
This Presenation was created and presented to help real estate agents to use PowerPoint as a graphics program and save .jpg images for slides advertised on Cable One Showcase of Homes.
Online business communication Assignment Help
We provide live online tutoring which can be accessed at anytime and anywhere according to student’s convenience. We have tutors in every subject such as Math, Chemistry, Biology, Physics and English whatever be the school level. Our college and university level tutors provide engineering online tutoring in areas such as Computer Science, Electrical and Electronics engineering, Mechanical engineering and Chemical engineering.
• www.onlineassignmenthelp.com.au
• www.cheapassignmenthelp.co.uk
• www.freeassignmenthelp.com
• www.cheapassignmenthelp.com.au
• http://btechndassignment.cheapassignmenthelp.co.uk/
10 Chart Ideas for Exciting Business Presentations
Simple chart ideas for more exciting business presentations. Break away from what we see everyday in PowerPoint.
What is Microsoft Word used for.docx
Learn how to perform a mail merge to personalize and send mass emails or letters with customized content.
Use the “Mailings” tab to set up mail merge and merge fields.
NOTE:- If you Feel like that you should know all of these in details then make sure to join our online Course of M.s Word Contact Us to get more informationWhat is Microsoft Word used for?
Odoo 15 Spreadsheet in CRM - How It's a Beneficial Tool
The spreadsheet tool can be used to generate regular reports based on the database that is automatically updated. Using this tool you can improve your business by inserting data in a pivot view to a spreadsheet.How Accounts Are Affected When an Invoice or Bill Is Generated in Odoo 15. Managers can constantly monitor the team’s performance in order to help to take accurate and relevant decisions for the company. After adding required measures and filtration to the report it can be added and automatically updated in a spreadsheet.
Making a Pie Chart
How to make a pie chart in Excel. Simple instructions for beginners, some knowledge of excel needed.
Level - Easy. 2nd in a series on Pie Charts
TOCFinancial Plan Forecast TemplateBA499Table of ContentsWorksheet.docx
TOCFinancial Plan Forecast TemplateBA499Table of ContentsWorksheetContentsInput WorksheetsIntroIntroduction plus basic inputs for company name and start dateSalesInputs for Sales and COS by product/servicePeopleInputs for personnel expenses including benefitsISInputs for other income statement items (includes summary IS)BSInputs for other balance sheet items (includes summary BS)CFInputs for other cash flow items (includes summary CF)BreakInputs for breakeven analysisPVInputs for present value analysisReport WorksheetsReportsIntroductionYR-CFAnnual Cash FlowYR-ISAnnual Income StatementYR-BSAnnual Balance SheetYR-BreakAnnual Breakeven AnalysisYR-RatiosAnnual Ratio AnalysisYR-PVAnnual Present Value AnalysisMth-CFMonthly Cash Flow for Year 1Mth-ISMonthly Income Statement for Year 1Mth-BSMonthly Balance Sheet for Year 1AssumptionsBlank Page to enter AssumptionsClick the blue "Return to TOC" box to return here anywhere in the workbookVersion 1.03 7/14/03All rights reserved. Copyright Andy T. Dungan, 2002. No copying, re-publication, or use of this spreadsheet, other than as authorized by Andy T. Dungan or the Southern Oregon University School of Business for its BA 499 students, may be made unless otherwise specifically authorized in writing by Andy T. Dungan or the Dean of the School of Business.
RETURN TO TOC
Intro
Sales
People
IS
BS
CF
Break
PV
YR-CF
YR-IS
YR-BS
YR-Break
YR-Ratios
YR-PV
Mth-CF
Mth-IS
Mth-BS
Assumptions
Reports
IntroIntroduction
Welcome to the BA499 integrated model for projecting financial statements for your business plan.
This brief introduction has been divided into several pieces. They are:
- A discussion of intimidation
- Organization of the workbook
- Where the assumptions are found
- What the background colors mean
- A note on startup costs
- First things to enter
- Tips and tricks
- A final word from the author
If any of us as professors can help please ask. If you have specific technical questions your professor can not answer please contact the author of this workbook, Dr. Andy DunganAre You Intimidated by Financial Statements?
Many of you may be intimidated by the financial statements. We have two pieces of advice: 1. You can do this! and 2. DON'T WAIT TO GET STARTED. The sooner you start, the sooner you will finish. A significant amount of time is required to do a reasonable job on your financials. If you procrastinate, you will have a difficult time finishing the financials in time. The process of projecting financial statements is an iterative one. What that means is that it will take multiple attempts to figure out your financials; you will try one thing and then another. In the beginning you may be confused and not understand how changing one variable changes another. Keep working. Eventually you will see how your inputs relate to the financial statements and you will have a much better understanding of how the different statements relate to each other.Organi ...
Powerpoint Training - Ten golden rules for making effective Presentations
Mr. Siddhartha Roy takes you through the Dos and Donts of preparing Presentations. If his 10 golden rules are followed your presentation will be effective, readable and of minimal file size.
Power BI Report.pdf
Learn the essentials of creating effective Power BI reports and discover how you can use them to tell compelling visual stories about your data.
Why is Report Design Important?
It's now easier than ever to design reports and dashboards thanks to a huge variety of BI platforms. However, many of these fail to live up to their purpose and provide true business value.
Fortunately, there are some good design guidelines that you can follow to ensure that your reports are useful and able to convey key business insights to those who use them. In particular, a well-designed report should be able to:
Simplify complex information
Convey insights as concisely as possible
Elaborate on information only as needed
10 design ideas of simple and exciting charts for business presentations
Design ideas for making simple and exciting charts for business presentations.
Create a PivotTable to analyze worksheet data.pdf
Watch more here https://www.youtube.com/channel/UCXM8vUNSxGNhqepy8d_QsBg
Excel Tips and Tricks
Multivendor Sales Event PowerPoint Presentation Slides
Promoting your sales event raises awareness about both the event itself and your brand in general. Use our multivendor sales event PowerPoint template as it consists of a set of several slides which gives an appealing representation of your sales and promotion methods. By generating attention for the sales event, you may reach potential customers who aren't familiar with your company and products. Incorporating our multivendor sales event PPT slides will allow you to represent information related to your competitor’s participation, trade show objectives, trade show budgeting, timeline, planning checklist, performance dashboards, etc. All these important aspects can be easily highlighted with our multivendor sales event PPT visuals. Take an active role in advertising and spreading the word about your products and services with our multivendor sales event Presentation slide deck. We also have other PPT templates which can be downloaded by you to meet your presentation requirements. Ensure an assiduous examination with our Multivendor Sales Event PowerPoint Presentation Slides. Give every detail the focus it deserves.
Year on Year Comparison in Power BI.pptx
Year on Year comparison by weekday in power BI
A Step by Step guide to avoid potential errors when using SAMEPERIODLASTYEAR and a simple solution to ensure you compare matching weekdays
https://www.selectdistinct.co.uk/2024/04/16/year-on-year-power-bi/
#PowerBI #SAMEPERIODLASTYEAR #DataViz
Sync Slicers in Power BI a step by step guide
Sync Your Slicers in Power BI
A Step by Step guide, to keeping separate slicers in sync across different data sets using slicer groups
https://www.selectdistinct.co.uk/2024/03/12/sync_slicers_in_power_bi/
#PowerBI #Slicers #DataViz
More Related Content
Similar to Custom Formats in Power BI
Cable Slides How To
This Presenation was created and presented to help real estate agents to use PowerPoint as a graphics program and save .jpg images for slides advertised on Cable One Showcase of Homes.
Online business communication Assignment Help
We provide live online tutoring which can be accessed at anytime and anywhere according to student’s convenience. We have tutors in every subject such as Math, Chemistry, Biology, Physics and English whatever be the school level. Our college and university level tutors provide engineering online tutoring in areas such as Computer Science, Electrical and Electronics engineering, Mechanical engineering and Chemical engineering.
• www.onlineassignmenthelp.com.au
• www.cheapassignmenthelp.co.uk
• www.freeassignmenthelp.com
• www.cheapassignmenthelp.com.au
• http://btechndassignment.cheapassignmenthelp.co.uk/
10 Chart Ideas for Exciting Business Presentations
Simple chart ideas for more exciting business presentations. Break away from what we see everyday in PowerPoint.
What is Microsoft Word used for.docx
Learn how to perform a mail merge to personalize and send mass emails or letters with customized content.
Use the “Mailings” tab to set up mail merge and merge fields.
NOTE:- If you Feel like that you should know all of these in details then make sure to join our online Course of M.s Word Contact Us to get more informationWhat is Microsoft Word used for?
What is Microsoft Word used for.docx
Learn how to perform a mail merge to personalize and send mass emails or letters with customized content.
Use the “Mailings” tab to set up mail merge and merge fields.
NOTE:- If you Feel like that you should know all of these in details then make sure to join our online Course of M.s Word Contact Us to get more informationWhat is Microsoft Word used for?
Odoo 15 Spreadsheet in CRM - How It's a Beneficial Tool
The spreadsheet tool can be used to generate regular reports based on the database that is automatically updated. Using this tool you can improve your business by inserting data in a pivot view to a spreadsheet.How Accounts Are Affected When an Invoice or Bill Is Generated in Odoo 15. Managers can constantly monitor the team’s performance in order to help to take accurate and relevant decisions for the company. After adding required measures and filtration to the report it can be added and automatically updated in a spreadsheet.
Making a Pie Chart
How to make a pie chart in Excel. Simple instructions for beginners, some knowledge of excel needed.
Level - Easy. 2nd in a series on Pie Charts
TOCFinancial Plan Forecast TemplateBA499Table of ContentsWorksheet.docx
TOCFinancial Plan Forecast TemplateBA499Table of ContentsWorksheetContentsInput WorksheetsIntroIntroduction plus basic inputs for company name and start dateSalesInputs for Sales and COS by product/servicePeopleInputs for personnel expenses including benefitsISInputs for other income statement items (includes summary IS)BSInputs for other balance sheet items (includes summary BS)CFInputs for other cash flow items (includes summary CF)BreakInputs for breakeven analysisPVInputs for present value analysisReport WorksheetsReportsIntroductionYR-CFAnnual Cash FlowYR-ISAnnual Income StatementYR-BSAnnual Balance SheetYR-BreakAnnual Breakeven AnalysisYR-RatiosAnnual Ratio AnalysisYR-PVAnnual Present Value AnalysisMth-CFMonthly Cash Flow for Year 1Mth-ISMonthly Income Statement for Year 1Mth-BSMonthly Balance Sheet for Year 1AssumptionsBlank Page to enter AssumptionsClick the blue "Return to TOC" box to return here anywhere in the workbookVersion 1.03 7/14/03All rights reserved. Copyright Andy T. Dungan, 2002. No copying, re-publication, or use of this spreadsheet, other than as authorized by Andy T. Dungan or the Southern Oregon University School of Business for its BA 499 students, may be made unless otherwise specifically authorized in writing by Andy T. Dungan or the Dean of the School of Business.
RETURN TO TOC
Intro
Sales
People
IS
BS
CF
Break
PV
YR-CF
YR-IS
YR-BS
YR-Break
YR-Ratios
YR-PV
Mth-CF
Mth-IS
Mth-BS
Assumptions
Reports
IntroIntroduction
Welcome to the BA499 integrated model for projecting financial statements for your business plan.
This brief introduction has been divided into several pieces. They are:
- A discussion of intimidation
- Organization of the workbook
- Where the assumptions are found
- What the background colors mean
- A note on startup costs
- First things to enter
- Tips and tricks
- A final word from the author
If any of us as professors can help please ask. If you have specific technical questions your professor can not answer please contact the author of this workbook, Dr. Andy DunganAre You Intimidated by Financial Statements?
Many of you may be intimidated by the financial statements. We have two pieces of advice: 1. You can do this! and 2. DON'T WAIT TO GET STARTED. The sooner you start, the sooner you will finish. A significant amount of time is required to do a reasonable job on your financials. If you procrastinate, you will have a difficult time finishing the financials in time. The process of projecting financial statements is an iterative one. What that means is that it will take multiple attempts to figure out your financials; you will try one thing and then another. In the beginning you may be confused and not understand how changing one variable changes another. Keep working. Eventually you will see how your inputs relate to the financial statements and you will have a much better understanding of how the different statements relate to each other.Organi ...
Powerpoint Training - Ten golden rules for making effective Presentations
Mr. Siddhartha Roy takes you through the Dos and Donts of preparing Presentations. If his 10 golden rules are followed your presentation will be effective, readable and of minimal file size.
Power BI Report.pdf
Learn the essentials of creating effective Power BI reports and discover how you can use them to tell compelling visual stories about your data.
Why is Report Design Important?
It's now easier than ever to design reports and dashboards thanks to a huge variety of BI platforms. However, many of these fail to live up to their purpose and provide true business value.
Fortunately, there are some good design guidelines that you can follow to ensure that your reports are useful and able to convey key business insights to those who use them. In particular, a well-designed report should be able to:
Simplify complex information
Convey insights as concisely as possible
Elaborate on information only as needed
10 design ideas of simple and exciting charts for business presentations
Design ideas for making simple and exciting charts for business presentations.
Create a PivotTable to analyze worksheet data.pdf
Watch more here https://www.youtube.com/channel/UCXM8vUNSxGNhqepy8d_QsBg
Excel Tips and Tricks
Multivendor Sales Event PowerPoint Presentation Slides
Promoting your sales event raises awareness about both the event itself and your brand in general. Use our multivendor sales event PowerPoint template as it consists of a set of several slides which gives an appealing representation of your sales and promotion methods. By generating attention for the sales event, you may reach potential customers who aren't familiar with your company and products. Incorporating our multivendor sales event PPT slides will allow you to represent information related to your competitor’s participation, trade show objectives, trade show budgeting, timeline, planning checklist, performance dashboards, etc. All these important aspects can be easily highlighted with our multivendor sales event PPT visuals. Take an active role in advertising and spreading the word about your products and services with our multivendor sales event Presentation slide deck. We also have other PPT templates which can be downloaded by you to meet your presentation requirements. Ensure an assiduous examination with our Multivendor Sales Event PowerPoint Presentation Slides. Give every detail the focus it deserves.
Similar to Custom Formats in Power BI (20)
10 Chart Ideas for Exciting Business Presentations
10 Chart Ideas for Exciting Business Presentations
Odoo 15 Spreadsheet in CRM - How It's a Beneficial Tool
Odoo 15 Spreadsheet in CRM - How It's a Beneficial Tool
TOCFinancial Plan Forecast TemplateBA499Table of ContentsWorksheet.docx
TOCFinancial Plan Forecast TemplateBA499Table of ContentsWorksheet.docx
Standard Grade Administration - Software Applications
Standard Grade Administration - Software Applications
Powerpoint Training - Ten golden rules for making effective Presentations
Powerpoint Training - Ten golden rules for making effective Presentations
10 design ideas of simple and exciting charts for business presentations
10 design ideas of simple and exciting charts for business presentations
Multivendor Sales Event PowerPoint Presentation Slides
Multivendor Sales Event PowerPoint Presentation Slides
More from Select Distinct Limited
Year on Year Comparison in Power BI.pptx
Year on Year comparison by weekday in power BI
A Step by Step guide to avoid potential errors when using SAMEPERIODLASTYEAR and a simple solution to ensure you compare matching weekdays
https://www.selectdistinct.co.uk/2024/04/16/year-on-year-power-bi/
#PowerBI #SAMEPERIODLASTYEAR #DataViz
Sync Slicers in Power BI a step by step guide
Sync Your Slicers in Power BI
A Step by Step guide, to keeping separate slicers in sync across different data sets using slicer groups
https://www.selectdistinct.co.uk/2024/03/12/sync_slicers_in_power_bi/
#PowerBI #Slicers #DataViz
Using Google Search Console Data in Power BI.pptx
Make your Google Search Console Data more useful with Power BI
Here is a simple step by step guide to taking the daily GSC data, smoothing it into weekly summary data and presenting a nice clean report to show progress without all of the noise that the daily data shows
https://www.selectdistinct.co.uk/2024/03/01/using-google-search-console-data-in-power-bi/
#SEO #DataAnalytics #PowerBI #GSC
Data Lake v Data Warehouse. What is the difference?
Data Lake v Data Warehouse
Do you know the difference?
Data lakes and data warehouses are both storage systems for big data, but they have several key differences.
A data lake is designed to store raw data of all types, including structured, semi-structured, and unstructured data. It’s a great option for companies that benefit from raw data for machine learning.
A data warehouse is designed to be a repository for already structured data to be queried and analysed for very specific purposes. It’s a better fit for companies whose business analysts need to decipher analytics in a structured system.
Understanding these key differences is important for any aspiring data professional
https://www.selectdistinct.co.uk/2024/01/02/difference-between-a-data-lake-and-a-data-warehouse/
#datawarehouse #datalake #dataanalytics
How to Create Drop Down Lists in Excel, step by step
How to create a drop down list in Excel
Use this feature to help get your data input right at source, with built in data validation and in cell drop down
Limit the amount of spelling variations, inconsistencies and errors in Excel
https://www.selectdistinct.co.uk/2024/01/02/dropdown-lists-in-excel/
#Excel #dropdown #datavalidation
Top 5 SQL Tips and Timesaver 2023, our most popular posts
Top 5 SQL tips 2023
Presenting our most popular SQL tips for 2023
1. How to calculate running totals in SQL server
2. How to use the LEAD and LAG functions in SQL
3. Group by ROLLUP in SQL
4. Divide by Zero Errors
5. How to split a column in SQL Server
https://www.selectdistinct.co.uk/2023/12/19/top-sql-tips-for-2023/
#SQL #businessanalytics #data #analytics #sqltips
Top 5 Power BI tips 2023 most popular blog posts
Top 5 Power Bi tips 2023
Presenting our most popular Power BI tips for 2023
1. Show values in Rows
2. Use SAMEPERIODLASTYEAR
3. How to sort dates properly
4. Toggle Measures with SWITCH
5. Advanced TOPN filter
https://www.selectdistinct.co.uk/2023/12/18/top-power-bi-tips-for-2023/
#PowerBI #dataviz #businessanalytics #data #analytics
Music by www.bensound.com
CTEs in SQL.pptx
What are CTE's in SQL
WITH Statements?
What the benefits, limitations and Syntax are
https://www.selectdistinct.co.uk/2023/12/05/how-to-use-a-cte/
#SQL #CTE #SQLWITH #DATA
Calculated Columns and Measures in Power BI.pptx
Do you know the difference between calculated columns and measures in Power BI?
In this article, you’ll learn what calculated columns and measures are, how they work, and when to use them.
You’ll also get some tips and best practices for choosing between them.
https://www.selectdistinct.co.uk/2023/11/21/calculated-columns-and-measures-in-power-bi/
#powerBI #measures #calculatedcolumns
Divide by Zero Errors
Divide by zero errors and how to avoid them
Examples and code samples for SQL, Big Query, Excel, Power BI including DAX and Power Query
https://www.selectdistinct.co.uk/2023/11/01/divide-by-zero-errors/
#dividebyzero #SQL #PowerBI
music by www.bensound.com
When to transform data for Power BI.pptx
How to choose between DAX, Power Query or SQL
to transform data for your Power BI reporting
https://www.selectdistinct.co.uk/2023/10/25/when-to-transform-data/
#powerbi #DAX #PowerQuery
Power BI KPIs
KPIs in Power BI are a great way to focus attention on what matters
This step by step guide shows you how to set them up with tips on their best use
https://www.selectdistinct.co.uk/2023/10/18/power-bi-kpis/
#powerbi #KPIs #dataviz
Direction of travel on a map in Power BI.pptx
Need to show the direction of travel on a map in Power BI
We had a client which needed us to do this very thing
This short guide shows how to do it using the Icon Map
https://www.selectdistinct.co.uk/2023/10/11/direction-of-travel-on-a-map-in-power-bi/
#PowerBI #IconMap #businessintelligence
UNION in DAX
How to combine data tables in DAX in Power BI using the UNION command
This guide shows you how to create a seamless data set from 2 or more tables to make further analysis and reporting much easier
https://www.selectdistinct.co.uk/2023/10/04/union-in-dax/
#PowerBI #DAX #UNION
APPEND data in Power Query
Combine data sets with APPEND in Power Query
You can use this simple technique to consolidate data from different sources into a single data set to make analysis easier
This is useful if you can't combine the data at source or if you dont have the facility
https://www.selectdistinct.co.uk/2023/09/27/append-data-in-power-query/
#PowerQuery #Append #PowerBI
Power BI Connect to Google BigQuery.pptx
Connect Power BI to Google BigQuery
Use the public datasets to develop your skills and demonstrate the power of both platforms for FREE
In this example we use the actual wholesale sales data for the US state of Iowa that is one of the public datasets
https://www.selectdistinct.co.uk/2023/09/07/connect-power-bi-to-google-big-query/
This is a great starting point for anyone wanting to build their skills with data that can be refreshed
#PowerBI #BigQuery #PublicData
Group by ROLLUP in SQL Server
Easily add subtotals into your queries with the Group by ROLLUP clause in SQL server
We explain the syntax, the logic, and the benefits of using ROLLUP to create subtotals and grand totals in your queries. With examples you can follow
https://www.selectdistinct.co.uk/2023/08/23/group-by-rollup-in-sql-server
#ROLLUP #SQL #DATAANALYTICS
Advanced Top N Measures in Power BI
Advanced Top N in Power BI
Here we set up a slicer to define how many Top items we want to see, but importantly classify the rest as 'Others'
This allows us to see the whole picture and focus on the leading items
https://www.selectdistinct.co.uk/2023/07/27/advanced-top-n-filter-power-bi/
#PowerBI #TOPN #DataVisualisation
Power BI Tips Top N Measures.pptx
You have heard of the 80:20 rule (Pareto)
Power BI has a TOPN function in DAX
This guide shows you how to start using it
https://www.selectdistinct.co.uk/2023/06/28/topn-in-power-bi/
#powerbi #topn #businessintelligence
In the world of data analysis, having the ability to efficiently rank and prioritize information is crucial. This is where the TOPN function in Power BI comes into play. By utilizing this powerful ranking function, analysts and data professionals can gain valuable insights from their datasets.
The TOPN function, short for "top n," allows users to identify and retrieve the top or bottom records based on a specified criteria. This function is particularly useful when dealing with large datasets that require quick and accurate analysis.
With Power BI's extensive capabilities, the TOPN function can be utilized through its native DAX (Data Analysis Expressions) formula language. By incorporating this formula into your Power BI reports and dashboards, you can effectively sort and filter data to highlight key trends, outliers, or patterns.
The importance of the TOPN function lies in its ability to streamline decision-making processes by presenting relevant information in a concise manner. Whether you are analysing sales figures, customer satisfaction ratings, or any other dataset, being able to quickly identify the top performers or underperformers can greatly impact strategic decision-making.
In this section, we will delve deeper into understanding how the TOPN function works within Power BI and explore real-world use cases where it can be applied effectively. So let's dive in and unlock the full potential of this essential feature in Power BI!
SQL Tips UNPIVOT Function.pptx
Do you want to learn how to unpivot a table in SQL Server?
Unpivot is a handy operator that converts columns into rows, making your data more normalized and readable.
Check out my latest blog post to see how it works and why you should use it.
https://www.selectdistinct.co.uk/2023/06/12/unpivot-function-in-sql/
#sql #unpivot #datatransformation #sqlserver #blogpost
More from Select Distinct Limited (20)
Data Lake v Data Warehouse. What is the difference?
Data Lake v Data Warehouse. What is the difference?
How to Create Drop Down Lists in Excel, step by step
How to Create Drop Down Lists in Excel, step by step
Top 5 SQL Tips and Timesaver 2023, our most popular posts
Top 5 SQL Tips and Timesaver 2023, our most popular posts
Recently uploaded
Algorithmic optimizations for Dynamic Levelwise PageRank (from STICD) : SHORT...
Techniques to optimize the pagerank algorithm usually fall in two categories. One is to try reducing the work per iteration, and the other is to try reducing the number of iterations. These goals are often at odds with one another. Skipping computation on vertices which have already converged has the potential to save iteration time. Skipping in-identical vertices, with the same in-links, helps reduce duplicate computations and thus could help reduce iteration time. Road networks often have chains which can be short-circuited before pagerank computation to improve performance. Final ranks of chain nodes can be easily calculated. This could reduce both the iteration time, and the number of iterations. If a graph has no dangling nodes, pagerank of each strongly connected component can be computed in topological order. This could help reduce the iteration time, no. of iterations, and also enable multi-iteration concurrency in pagerank computation. The combination of all of the above methods is the STICD algorithm. [sticd] For dynamic graphs, unchanged components whose ranks are unaffected can be skipped altogether.
做(mqu毕业证书)麦考瑞大学毕业证硕士文凭证书学费发票原版一模一样
原版定制【Q微信:741003700】《(mqu毕业证书)麦考瑞大学毕业证硕士文凭证书》【Q微信:741003700】成绩单 、雅思、外壳、留信学历认证永久存档查询,采用学校原版纸张、特殊工艺完全按照原版一比一制作(包括:隐形水印,阴影底纹,钢印LOGO烫金烫银,LOGO烫金烫银复合重叠,文字图案浮雕,激光镭射,紫外荧光,温感,复印防伪)行业标杆!精益求精,诚心合作,真诚制作!多年品质 ,按需精细制作,24小时接单,全套进口原装设备,十五年致力于帮助留学生解决难题,业务范围有加拿大、英国、澳洲、韩国、美国、新加坡,新西兰等学历材料,包您满意。
【业务选择办理准则】
一、工作未确定,回国需先给父母、亲戚朋友看下文凭的情况,办理一份就读学校的毕业证【Q微信741003700】文凭即可
二、回国进私企、外企、自己做生意的情况,这些单位是不查询毕业证真伪的,而且国内没有渠道去查询国外文凭的真假,也不需要提供真实教育部认证。鉴于此,办理一份毕业证【微信741003700】即可
三、进国企,银行,事业单位,考公务员等等,这些单位是必需要提供真实教育部认证的,办理教育部认证所需资料众多且烦琐,所有材料您都必须提供原件,我们凭借丰富的经验,快捷的绿色通道帮您快速整合材料,让您少走弯路。
留信网认证的作用:
1:该专业认证可证明留学生真实身份
2:同时对留学生所学专业登记给予评定
3:国家专业人才认证中心颁发入库证书
4:这个认证书并且可以归档倒地方
5:凡事获得留信网入网的信息将会逐步更新到个人身份内,将在公安局网内查询个人身份证信息后,同步读取人才网入库信息
6:个人职称评审加20分
7:个人信誉贷款加10分
8:在国家人才网主办的国家网络招聘大会中纳入资料,供国家高端企业选择人才
【关于价格问题(保证一手价格)】
我们所定的价格是非常合理的,而且我们现在做得单子大多数都是代理和回头客户介绍的所以一般现在有新的单子 我给客户的都是第一手的代理价格,因为我想坦诚对待大家 不想跟大家在价格方面浪费时间
对于老客户或者被老客户介绍过来的朋友,我们都会适当给一些优惠。
一比一原版(TWU毕业证)西三一大学毕业证成绩单
TWU毕业证【微信95270640】西三一大学没毕业>办理西三一大学毕业证成绩单【微信TWU】TWU毕业证成绩单TWU学历证书TWU文凭《TWU毕业套号文凭网认证西三一大学毕业证成绩单》《哪里买西三一大学毕业证文凭TWU成绩学校快递邮寄信封》《开版西三一大学文凭》TWU留信认证本科硕士学历认证
[留学文凭学历认证(留信认证使馆认证)西三一大学毕业证成绩单毕业证证书大学Offer请假条成绩单语言证书国际回国人员证明高仿教育部认证申请学校等一切高仿或者真实可查认证服务。
多年留学服务公司,拥有海外样板无数能完美1:1还原海外各国大学degreeDiplomaTranscripts等毕业材料。海外大学毕业材料都有哪些工艺呢?工艺难度主要由:烫金.钢印.底纹.水印.防伪光标.热敏防伪等等组成。而且我们每天都在更新海外文凭的样板以求所有同学都能享受到完美的品质服务。
国外毕业证学位证成绩单办理方法:
1客户提供办理西三一大学西三一大学本科学位证成绩单信息:姓名生日专业学位毕业时间等(如信息不确定可以咨询顾问:我们有专业老师帮你查询);
2开始安排制作毕业证成绩单电子图;
3毕业证成绩单电子版做好以后发送给您确认;
4毕业证成绩单电子版您确认信息无误之后安排制作成品;
5成品做好拍照或者视频给您确认;
6快递给客户(国内顺丰国外DHLUPS等快读邮寄)
— — — — 我们是挂科和未毕业同学们的福音我们是实体公司精益求精的工艺! — — — -
一真实留信认证的作用(私企外企荣誉的见证):
1:该专业认证可证明留学生真实留学身份同时对留学生所学专业等级给予评定。
2:国家专业人才认证中心颁发入库证书这个入网证书并且可以归档到地方。
3:凡是获得留信网入网的信息将会逐步更新到个人身份内将在公安部网内查询个人身份证信息后同步读取人才网入库信息。
4:个人职称评审加20分个人信誉贷款加10分。
5:在国家人才网主办的全国网络招聘大会中纳入资料供国家500强等高端企业选择人才。广州火车东站的那一刻山娃感受到了一种从未有过的激动和震撼太美了可爱的广州父亲的城山娃惊喜得几乎叫出声来山娃觉得父亲太伟大了居然能单匹马地跑到这么远这么大这么美的地方赚大钱高楼大厦鳞次栉比大街小巷人潮涌动山娃一路张望一路惊叹他发现城里的桥居然层层叠叠扭来扭去桥下没水却有着水一般的车水马龙山娃惊诧于城里的公交车那么大那么美不用买票乖乖地掷下二枚硬币空调享受还能坐着看电视呢屡经辗转山娃终于跟着父亲到拉
一比一原版(NYU毕业证)纽约大学毕业证成绩单
NYU毕业证【微信95270640】《如何办理NYU毕业证纽约大学文凭学历》【Q微信95270640】《纽约大学文凭学历证书》《纽约大学毕业证书与成绩单样本图片》毕业证书补办 Fake Degree做学费单《毕业证明信-推荐信》成绩单,录取通知书,Offer,在读证明,雅思托福成绩单,真实大使馆教育部认证,回国人员证明,留信网认证。网上存档永久可查!
【本科硕士】纽约大学纽约大学毕业证学位证(GPA修改);学历认证(教育部认证);大学Offer录取通知书留信认证使馆认证;雅思语言证书等高仿类证书。
办理流程:
1客户提供办理纽约大学纽约大学毕业证学位证信息:姓名生日专业学位毕业时间等(如信息不确定可以咨询顾问:我们有专业老师帮你查询);
2开始安排制作毕业证成绩单电子图;
3毕业证成绩单电子版做好以后发送给您确认;
4毕业证成绩单电子版您确认信息无误之后安排制作成品;
5成品做好拍照或者视频给您确认;
6快递给客户(国内顺丰国外DHLUPS等快读邮寄)
真实网上可查的证明材料
1教育部学历学位认证留服官网真实存档可查永久存档。
2留学回国人员证明(使馆认证)使馆网站真实存档可查。
我们对海外大学及学院的毕业证成绩单所使用的材料尺寸大小防伪结构(包括:纽约大学纽约大学毕业证学位证隐形水印阴影底纹钢印LOGO烫金烫银LOGO烫金烫银复合重叠。文字图案浮雕激光镭射紫外荧光温感复印防伪)都有原版本文凭对照。质量得到了广大海外客户群体的认可同时和海外学校留学中介做到与时俱进及时掌握各大院校的(毕业证成绩单资格证结业证录取通知书在读证明等相关材料)的版本更新信息能够在第一时间掌握最新的海外学历文凭的样版尺寸大小纸张材质防伪技术等等并在第一时间收集到原版实物以求达到客户的需求。
本公司还可以按照客户原版印刷制作且能够达到客户理想的要求。有需要办理证件的客户请联系我们在线客服中心微信:95270640 或咨询在线已转到了尽头他的城市生活也将划上一个不很圆满的句号了值得庆幸的是山娃早记下了他们的学校和联系方式说也奇怪在山娃离城的头一天父亲居然请假陪山娃耍了一天那一天父亲陪着山娃辗转长隆水上乐园疯了一整天水上漂流高空冲浪看大马戏大凡里面有的父亲都带着他去疯一把山娃算了算这一次足足花了老爸元够他挣上半个月的山娃很不解一向节俭的父亲啥时变得如此阔绰大方大把大把掏钱时居然连眉头也不皱一下车票早买好了直达卧铺车得经子
一比一原版(CBU毕业证)不列颠海角大学毕业证成绩单
CBU毕业证【微信95270640】《如何办理不列颠海角大学毕业证认证》【办证Q微信95270640】《不列颠海角大学文凭毕业证制作》《CBU学历学位证书哪里买》办理不列颠海角大学学位证书扫描件、办理不列颠海角大学雅思证书!
国际留学归国服务中心《如何办不列颠海角大学毕业证认证》《CBU学位证书扫描件哪里买》实体公司,注册经营,行业标杆,精益求精!
1:1完美还原海外各大学毕业材料上的工艺:水印阴影底纹钢印LOGO烫金烫银LOGO烫金烫银复合重叠。文字图案浮雕激光镭射紫外荧光温感复印防伪。
可办理以下真实不列颠海角大学存档留学生信息存档认证:
1不列颠海角大学真实留信网认证(网上可查永久存档无风险百分百成功入库);
2真实教育部认证(留服)等一切高仿或者真实可查认证服务(暂时不可办理);
3购买英美真实学籍(不用正常就读直接出学历);
4英美一年硕士保毕业证项目(保录取学校挂名不用正常就读保毕业)
留学本科/硕士毕业证书成绩单制作流程:
1客户提供办理信息:姓名生日专业学位毕业时间等(如信息不确定可以咨询顾问:我们有专业老师帮你查询不列颠海角大学不列颠海角大学本科学位证成绩单);
2开始安排制作不列颠海角大学毕业证成绩单电子图;
3不列颠海角大学毕业证成绩单电子版做好以后发送给您确认;
4不列颠海角大学毕业证成绩单电子版您确认信息无误之后安排制作成品;
5不列颠海角大学成品做好拍照或者视频给您确认;
6快递给客户(国内顺丰国外DHLUPS等快读邮寄)
— — — — — — — — — — — 《文凭顾问Q/微:95270640》这么大这么美的地方赚大钱高楼大厦鳞次栉比大街小巷人潮涌动山娃一路张望一路惊叹他发现城里的桥居然层层叠叠扭来扭去桥下没水却有着水一般的车水马龙山娃惊诧于城里的公交车那么大那么美不用买票乖乖地掷下二枚硬币空调享受还能坐着看电视呢屡经辗转山娃终于跟着父亲到家了山娃没想到父亲城里的家会如此寒碜更没料到父亲的城里竟有如此简陋的鬼地方父亲的家在高楼最底屋最下面很矮很黑是很不显眼的地下室父亲的家安在别人脚底下孰
Malana- Gimlet Market Analysis (Portfolio 2)
A market analysys on Spotify's parent Podcast company Gimlet.
Empowering Data Analytics Ecosystem.pptx
Show drafts
volume_up
Empowering the Data Analytics Ecosystem: A Laser Focus on Value
The data analytics ecosystem thrives when every component functions at its peak, unlocking the true potential of data. Here's a laser focus on key areas for an empowered ecosystem:
1. Democratize Access, Not Data:
Granular Access Controls: Provide users with self-service tools tailored to their specific needs, preventing data overload and misuse.
Data Catalogs: Implement robust data catalogs for easy discovery and understanding of available data sources.
2. Foster Collaboration with Clear Roles:
Data Mesh Architecture: Break down data silos by creating a distributed data ownership model with clear ownership and responsibilities.
Collaborative Workspaces: Utilize interactive platforms where data scientists, analysts, and domain experts can work seamlessly together.
3. Leverage Advanced Analytics Strategically:
AI-powered Automation: Automate repetitive tasks like data cleaning and feature engineering, freeing up data talent for higher-level analysis.
Right-Tool Selection: Strategically choose the most effective advanced analytics techniques (e.g., AI, ML) based on specific business problems.
4. Prioritize Data Quality with Automation:
Automated Data Validation: Implement automated data quality checks to identify and rectify errors at the source, minimizing downstream issues.
Data Lineage Tracking: Track the flow of data throughout the ecosystem, ensuring transparency and facilitating root cause analysis for errors.
5. Cultivate a Data-Driven Mindset:
Metrics-Driven Performance Management: Align KPIs and performance metrics with data-driven insights to ensure actionable decision making.
Data Storytelling Workshops: Equip stakeholders with the skills to translate complex data findings into compelling narratives that drive action.
Benefits of a Precise Ecosystem:
Sharpened Focus: Precise access and clear roles ensure everyone works with the most relevant data, maximizing efficiency.
Actionable Insights: Strategic analytics and automated quality checks lead to more reliable and actionable data insights.
Continuous Improvement: Data-driven performance management fosters a culture of learning and continuous improvement.
Sustainable Growth: Empowered by data, organizations can make informed decisions to drive sustainable growth and innovation.
By focusing on these precise actions, organizations can create an empowered data analytics ecosystem that delivers real value by driving data-driven decisions and maximizing the return on their data investment.
一比一原版(RUG毕业证)格罗宁根大学毕业证成绩单
RUG毕业证【微信95270640】办文凭{格罗宁根大学毕业证}Q微Q微信95270640RUG毕业证书成绩单/学历认证RUG Diploma未毕业、挂科怎么办?+QQ微信:Q微信95270640-大学Offer(申请大学)、成绩单(申请考研)、语言证书、在读证明、使馆公证、办真实留信网认证、真实大使馆认证、学历认证
办理国外格罗宁根大学毕业证书 #成绩单改成绩 #教育部学历学位认证 #毕业证认证 #留服认证 #使馆认证(留学回国人员证明) #(证)等
真实教育部认证教育部存档中国教育部留学服务中心认证(即教育部留服认证)网站100%可查.
真实使馆认证(即留学人员回国证明)使馆存档可通过大使馆查询确认.
留信网认证国家专业人才认证中心颁发入库证书留信网永久存档可查.
格罗宁根大学格罗宁根大学毕业证学历书毕业证 #成绩单等全套材料从防伪到印刷从水印到钢印烫金跟学校原版100%相同.
国际留学归国服务中心:实体公司注册经营行业标杆精益求精!
国外毕业证学位证成绩单办理流程:
1客户提供办理格罗宁根大学格罗宁根大学毕业证学历书信息:姓名生日专业学位毕业时间等(如信息不确定可以咨询顾问:我们有专业老师帮你查询);
2开始安排制作格罗宁根大学毕业证成绩单电子图;
3格罗宁根大学毕业证成绩单电子版做好以后发送给您确认;
4格罗宁根大学毕业证成绩单电子版您确认信息无误之后安排制作成品;
5格罗宁根大学成品做好拍照或者视频给您确认;
6快递给客户(国内顺丰国外DHLUPS等快递邮寄格罗宁根大学格罗宁根大学毕业证学历书)。也得开灯开风扇山娃不想浪费电总将小方桌搁在门口看书写作业有一次山娃坐在门口写作业写着写着竟伏在桌上睡着了迷迷糊糊中山娃似乎听到了父亲的脚步声当他晃晃悠悠站起来时才诧然发现一位衣衫破旧的妇女挎着一只硕大的蛇皮袋手里拎着长铁钩正站在门口朝黑色的屋内张望不好坏人小偷山娃一怔却也灵机一动立马仰起头双手拢在嘴边朝楼上大喊:“爸爸爸——有人找——那人一听朝山娃尴尬地笑笑悻悻地走了山娃立马“嘭的一声将铁门锁死受
Q1’2024 Update: MYCI’s Leap Year Rebound
Key things you need to know on consumer confidence, key behavioral, tech, e-wallet & esports trends in Malaysia.
一比一原版(CU毕业证)卡尔顿大学毕业证成绩单
CU毕业证【微信95270640】(卡尔顿大学毕业证成绩单本科学历)Q微信95270640(补办CU学位文凭证书)卡尔顿大学留信网学历认证怎么办理卡尔顿大学毕业证成绩单精仿本科学位证书硕士文凭证书认证Seneca College diplomaoffer,Transcript办理硕士学位证书造假卡尔顿大学假文凭学位证书制作CU本科毕业证书硕士学位证书精仿卡尔顿大学学历认证成绩单修改制作,办理真实认证、留信认证、使馆公证、购买成绩单,购买假文凭,购买假学位证,制造假国外大学文凭、毕业公证、毕业证明书、录取通知书、Offer、在读证明、雅思托福成绩单、假文凭、假毕业证、请假条、国际驾照、网上存档可查!
如果您是以下情况,我们都能竭诚为您解决实际问题:【公司采用定金+余款的付款流程,以最大化保障您的利益,让您放心无忧】
1、在校期间,因各种原因未能顺利毕业,拿不到官方毕业证+微信95270640
2、面对父母的压力,希望尽快拿到卡尔顿大学卡尔顿大学毕业证文凭证书;
3、不清楚流程以及材料该如何准备卡尔顿大学卡尔顿大学毕业证文凭证书;
4、回国时间很长,忘记办理;
5、回国马上就要找工作,办给用人单位看;
6、企事业单位必须要求办理的;
面向美国乔治城大学毕业留学生提供以下服务:
【★卡尔顿大学卡尔顿大学毕业证文凭证书毕业证、成绩单等全套材料,从防伪到印刷,从水印到钢印烫金,与学校100%相同】
【★真实使馆认证(留学人员回国证明),使馆存档可通过大使馆查询确认】
【★真实教育部认证,教育部存档,教育部留服网站可查】
【★真实留信认证,留信网入库存档,可查卡尔顿大学卡尔顿大学毕业证文凭证书】
我们从事工作十余年的有着丰富经验的业务顾问,熟悉海外各国大学的学制及教育体系,并且以挂科生解决毕业材料不全问题为基础,为客户量身定制1对1方案,未能毕业的回国留学生成功搭建回国顺利发展所需的桥梁。我们一直努力以高品质的教育为起点,以诚信、专业、高效、创新作为一切的行动宗旨,始终把“诚信为主、质量为本、客户第一”作为我们全部工作的出发点和归宿点。同时为海内外留学生提供大学毕业证购买、补办成绩单及各类分数修改等服务;归国认证方面,提供《留信网入库》申请、《国外学历学位认证》申请以及真实学籍办理等服务,帮助众多莘莘学子实现了一个又一个梦想。
专业服务,请勿犹豫联系我
如果您真实毕业回国,对于学历认证无从下手,请联系我,我们免费帮您递交
诚招代理:本公司诚聘当地代理人员,如果你有业余时间,或者你有同学朋友需要,有兴趣就请联系我
你赢我赢,共创双赢
你做代理,可以帮助卡尔顿大学同学朋友
你做代理,可以拯救卡尔顿大学失足青年
你做代理,可以挽救卡尔顿大学一个个人才
你做代理,你将是别人人生卡尔顿大学的转折点
你做代理,可以改变自己,改变他人,给他人和自己一个机会他交友与城里人交友但他俩就好像是两个世界里的人根本拢不到一块儿不知不觉山娃倒跟周围出租屋里的几个小伙伴成了好朋友因为他们也是从乡下进城过暑假的小学生快乐的日子总是过得飞快山娃尚未完全认清那几位小朋友时他们却一个接一个地回家了山娃这时才恍然发现二个月的暑假已转到了尽头他的城市生活也将划上一个不很圆满的句号了值得庆幸的是山娃早记下了他们的学校和联系方式说也奇怪在山娃离城的头一天父亲居然请假陪山娃耍了活
Predicting Product Ad Campaign Performance: A Data Analysis Project Presentation
Predicting Product Ad Campaign Performance: A Data Analysis Project PresentationBoston Institute of Analytics
Explore our comprehensive data analysis project presentation on predicting product ad campaign performance. Learn how data-driven insights can optimize your marketing strategies and enhance campaign effectiveness. Perfect for professionals and students looking to understand the power of data analysis in advertising. for more details visit: https://bostoninstituteofanalytics.org/data-science-and-artificial-intelligence/哪里卖(usq毕业证书)南昆士兰大学毕业证研究生文凭证书托福证书原版一模一样
原版定制【Q微信:741003700】《(usq毕业证书)南昆士兰大学毕业证研究生文凭证书》【Q微信:741003700】成绩单 、雅思、外壳、留信学历认证永久存档查询,采用学校原版纸张、特殊工艺完全按照原版一比一制作(包括:隐形水印,阴影底纹,钢印LOGO烫金烫银,LOGO烫金烫银复合重叠,文字图案浮雕,激光镭射,紫外荧光,温感,复印防伪)行业标杆!精益求精,诚心合作,真诚制作!多年品质 ,按需精细制作,24小时接单,全套进口原装设备,十五年致力于帮助留学生解决难题,业务范围有加拿大、英国、澳洲、韩国、美国、新加坡,新西兰等学历材料,包您满意。
【业务选择办理准则】
一、工作未确定,回国需先给父母、亲戚朋友看下文凭的情况,办理一份就读学校的毕业证【Q微信741003700】文凭即可
二、回国进私企、外企、自己做生意的情况,这些单位是不查询毕业证真伪的,而且国内没有渠道去查询国外文凭的真假,也不需要提供真实教育部认证。鉴于此,办理一份毕业证【微信741003700】即可
三、进国企,银行,事业单位,考公务员等等,这些单位是必需要提供真实教育部认证的,办理教育部认证所需资料众多且烦琐,所有材料您都必须提供原件,我们凭借丰富的经验,快捷的绿色通道帮您快速整合材料,让您少走弯路。
留信网认证的作用:
1:该专业认证可证明留学生真实身份
2:同时对留学生所学专业登记给予评定
3:国家专业人才认证中心颁发入库证书
4:这个认证书并且可以归档倒地方
5:凡事获得留信网入网的信息将会逐步更新到个人身份内,将在公安局网内查询个人身份证信息后,同步读取人才网入库信息
6:个人职称评审加20分
7:个人信誉贷款加10分
8:在国家人才网主办的国家网络招聘大会中纳入资料,供国家高端企业选择人才
【关于价格问题(保证一手价格)】
我们所定的价格是非常合理的,而且我们现在做得单子大多数都是代理和回头客户介绍的所以一般现在有新的单子 我给客户的都是第一手的代理价格,因为我想坦诚对待大家 不想跟大家在价格方面浪费时间
对于老客户或者被老客户介绍过来的朋友,我们都会适当给一些优惠。
Adjusting primitives for graph : SHORT REPORT / NOTES
Graph algorithms, like PageRank Compressed Sparse Row (CSR) is an adjacency-list based graph representation that is
Multiply with different modes (map)
1. Performance of sequential execution based vs OpenMP based vector multiply.
2. Comparing various launch configs for CUDA based vector multiply.
Sum with different storage types (reduce)
1. Performance of vector element sum using float vs bfloat16 as the storage type.
Sum with different modes (reduce)
1. Performance of sequential execution based vs OpenMP based vector element sum.
2. Performance of memcpy vs in-place based CUDA based vector element sum.
3. Comparing various launch configs for CUDA based vector element sum (memcpy).
4. Comparing various launch configs for CUDA based vector element sum (in-place).
Sum with in-place strategies of CUDA mode (reduce)
1. Comparing various launch configs for CUDA based vector element sum (in-place).
社内勉強会資料_LLM Agents .
単純な応答だけでなく、複雑な課題に対応できる柔軟性を持つLLM Agents。主要コンポーネントのPlanning、Memory、Tool Useについて解説しています。
一比一原版(QU毕业证)皇后大学毕业证成绩单
QU毕业证【微信95270640】办理皇后大学毕业证原版一模一样、QU毕业证制作【Q微信95270640】《皇后大学毕业证购买流程》《QU成绩单制作》皇后大学毕业证书QU毕业证文凭皇后大学
本科毕业证书,学历学位认证如何办理【留学国外学位学历认证、毕业证、成绩单、大学Offer、雅思托福代考、语言证书、学生卡、高仿教育部认证等一切高仿或者真实可查认证服务】代办国外(海外)英国、加拿大、美国、新西兰、澳大利亚、新西兰等国外各大学毕业证、文凭学历证书、成绩单、学历学位认证真实可查。
1:1完美还原海外各大学毕业材料上的工艺:水印阴影底纹钢印LOGO烫金烫银LOGO烫金烫银复合重叠。文字图案浮雕激光镭射紫外荧光温感复印防伪。
可办理以下真实皇后大学存档留学生信息存档认证:
1皇后大学真实留信网认证(网上可查永久存档无风险百分百成功入库);
2真实教育部认证(留服)等一切高仿或者真实可查认证服务(暂时不可办理);
3购买英美真实学籍(不用正常就读直接出学历);
4英美一年硕士保毕业证项目(保录取学校挂名不用正常就读保毕业)
留学本科/硕士毕业证书成绩单制作流程:
1客户提供办理信息:姓名生日专业学位毕业时间等(如信息不确定可以咨询顾问:我们有专业老师帮你查询皇后大学皇后大学硕士毕业证成绩单);
2开始安排制作皇后大学毕业证成绩单电子图;
3皇后大学毕业证成绩单电子版做好以后发送给您确认;
4皇后大学毕业证成绩单电子版您确认信息无误之后安排制作成品;
5皇后大学成品做好拍照或者视频给您确认;
6快递给客户(国内顺丰国外DHLUPS等快读邮寄)
— — — — — — — — — — — 《文凭顾问Q/微:95270640》很感动很无奈房东的儿子小伍笨手笨脚的不会说普通话满口粤语态度十分傲慢一副盛气凌人的样子山娃试图接近他跟他交友与城里人交友但他俩就好像是两个世界里的人根本拢不到一块儿不知不觉山娃倒跟周围出租屋里的几个小伙伴成了好朋友因为他们也是从乡下进城过暑假的小学生快乐的日子总是过得飞快山娃尚未完全认清那几位小朋友时他们却一个接一个地回家了山娃这时才恍然发现二个月的暑假已转到了尽头他的城市生活也将划上一个不很圆义
Recently uploaded (20)
Algorithmic optimizations for Dynamic Levelwise PageRank (from STICD) : SHORT...
Algorithmic optimizations for Dynamic Levelwise PageRank (from STICD) : SHORT...
tapal brand analysis PPT slide for comptetive data
tapal brand analysis PPT slide for comptetive data
Business update Q1 2024 Lar España Real Estate SOCIMI
Business update Q1 2024 Lar España Real Estate SOCIMI
Best best suvichar in gujarati english meaning of this sentence as Silk road ...
Best best suvichar in gujarati english meaning of this sentence as Silk road ...
Predicting Product Ad Campaign Performance: A Data Analysis Project Presentation
Predicting Product Ad Campaign Performance: A Data Analysis Project Presentation
Adjusting primitives for graph : SHORT REPORT / NOTES
Adjusting primitives for graph : SHORT REPORT / NOTES
Custom Formats in Power BI
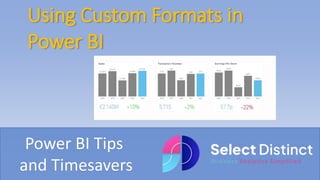
- 1. Power BI Tips and Timesavers Using Custom Formats in Power BI
- 2. Power BI comes ready loaded with a wide range of format options But did you know that you are not limited to the pre-defined options Some organisations have specific standards for things such as date formats, these can be catered for using custom formats
- 3. Custom Formats on Cards Cards are a great way to feature key pieces of information But if you have a need to use a custom format that is not one of the standard formats then its not obvious how to do it Show data as Millions Prefix with a ‘+’ Show as pence
- 4. Show data as Millions Select the card you need to format On the Visualizations panel Format Visual Call out Value Then select the relevant display units
- 5. Prefix with a Plus (or minus) By default, if the field we want to show on the card is set as a percentage, it looks like this To change the card to look as we want it, we need to go to the model and select a custom format in there By setting the format to +0%; -0% the format will prefix all positives with a plus, the semi colon ; then tells it to apply a different value for negatives It now looks as we need it to
- 6. Show values as pence If we set the field to be a currency format, in our case GBP then the value is expected to be in £ Earnings per share for example are reported usually in pence (So remember to multiply by 100!) Then we can set a custom format to show p suffix in a similar way, in this example we have not set a negative option By using the format code 0.0p, this sets it to 1 decimal place
- 7. Custom Format Strings If you are used to setting custom formats in Excel, it is the same type of process The semi colon splits the rules into [Positives];[Negatives];[Zero] ;[Text Values] In your Power BI desktop, click ‘Learn More’ to read further
- 8. Custom Format Strings for dates Here is an example for a date format At first, date formats appear to be limited to a few common formats But if we want to use the format dd-mm-yyyy then we need to create it as a custom format On the modelling tab, select the field, then in the properties you can apply this custom format
- 9. Mastering the array of options that you can apply using custom formats can give you more control over the look and feel of your reporting in Power BI
- 10. For more Tips, Tricks and Timesavers, visit our website Business Analytics Blog – Select Distinct Credit: simon.harrison@selectdistinct.co.uk