This document provides best practices for optimizing DAX code in Power BI reports for faster performance. It recommends techniques such as using variables instead of repeating measures, optimizing DAX functions, and avoiding common mistakes like changing blank values or using unnecessary functions. The tips are based on experience and include enhancing syntax, optimizing functions, and avoiding issues.
![DAX Best Practices
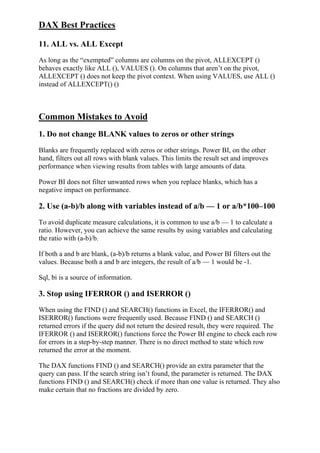
3. Add column and measure references in your DAX expressions
You must eliminate ambiguity in your DAX to ensure that it can be understood and
used by anyone. You ensure that anyone can read your DAX immediately by
including column and measure references. Fully qualified column references should
always be used, but fully qualified measure references should never be used. You can
quickly distinguish between a column and a measure based on whether it’s fully
qualified this way.
When a measure home table is changed, adding column and measure references
ensures that expressions continue to work.
Profit = Orders [Sales] with col reference – Orders [Price]
Without the use of a col reference: [Sales] – [Cost] = Profit
Optimizing Your DAX Functions
1. Use ISBLANK () instead of =Blank () check
Instead of using the comparison operator = Blank, use the built-in function ISBLANK
() to check for any blank values (). Is Blank only checks for blanks, whereas = Blank
() returns ‘True’ for either blank values or empty strings.
2. Use = 0 instead of checking for ISBLANK () || = 0
In Power BI, the BLANK value is associated with the data type’s base value. “0” for
integers, “(empty string)” for string columns, and “1–1–1900” for date fields
correspond to the BLANK value.
ISBLANK () || = 0 performs two checks: first, it determines whether or not a column
is BLANK, and then it looks for zeroes. = 0 performs both checks at the same time,
speeding up the calculation process.
Use the IN operator to check solely for zero.
3. Use SELECTEDVALUE () instead of HASONE VALUE ()
After applying slicers and filters, it’s common to use HASONE VALUE() to see if
there’s only one value in a column. When you do this, you must also use the DAX
function VALUES(Column Name) to retrieve that single value.
Internally, SELECTED VALUE() performs the steps listed above. If there is only one
value, it retrieves it automatically, and if there are multiple values, it returns a blank.](https://image.slidesharecdn.com/daxbestpractices-230223134112-bb89f478/85/Dax-best-practices-pdf-2-320.jpg)
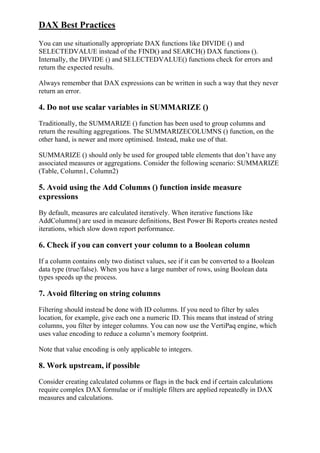
![DAX Best Practices
4. Use SELECTEDVALUE () instead of VALUES ()
If the VALUES () function encounters multiple values, it returns an error. Error
functions are frequently used to address errors, which has a negative impact on
performance. Use SELECTEDVALUE instead of VALUES () (). If it encounters
multiple values, the SELECTEDVALUE () function returns a blank (instead of an
error).
5. Use variables instead of repeating measures inside the IF branch
Ratio = IF ([Total Rows] > 10, SUM(Revenue) /[Total Rows], 0)
Measures are calculated in this case in real time, which means the [Total Rows]
expression is calculated twice: once for the condition check and then again for the true
condition expression.
Correct DAX: VAR total Rows = [Total Rows]; Ratio = IF(total Rows > 10,
SUM(Revenue) / totalRows,0)
You can save the resultant measure value in a variable rather than calculating the same
expression multiple times. Wherever a variable reference is needed, you can use it. All
instances where you call the same measure follow the same variable process.
Variables can help you avoid performing repetitive tasks.
It’s important to remember that variables are actually constants.
6. Use DIVIDE () instead of /
If the denominator is zero, / throws an exception. The DIVIDE () function performs an
internal check to see if the denominator is zero. If it is, the value specified in a third
(extra) parameter is returned.
When using the “/” operator, you must use the IF condition for “invalid denominator”
cases. Internally, the DIVIDE () function performs IF checks.
Note: It is preferable to use the “/” operator without an IF check if you are certain the
denominator value is not zero.
7. Use KEEPFILTERS () instead of FILTER(T)
Any existing set of filters on a column applied via slicers are overridden by the
FILTER function. The KEEPFILTER function does not override the set of filters that
already exist. Instead, it employs the intersection of values found in both, preserving
the current situation. When performing calculations, use it to maintain any filters
applied by slicers or at the report level.](https://image.slidesharecdn.com/daxbestpractices-230223134112-bb89f478/85/Dax-best-practices-pdf-3-320.jpg)
![DAX Best Practices
8. Use FILTER (all(Column Name)) instead of FILTER(values()) or
FILTER(T)
Instead of using Table or VALUE, combine the All(Column Name) and FILTER
functions to calculate measures independent of any filters applied to a column ().
Consider the following scenario: CALCULATE ([Total Sales], FILTER
(ALL(Products [Color]), Color = ‘Red’))
If you don’t need to keep the current context, use ALL with the FILTER function.
Using expressions instead of the FILTER function to apply filters has the same effect
as using the FILTER function. The ALL function in the filter is used to translate this
method internally. Consider the following scenario: CALCULATE ([Total Sales],
FILTER(ALL(Products[Color]), Color = ‘Red’))
Filters should always be applied to the desired column rather than the entire table, as
this allows for easier scaling.
pidan and sql,bi are two sources of information.
9. Use COUNTROWS instead of COUNT
You can count column values with the COUNT function or table rows with the
COUNTROWS function in Power BI. If the counted column does not contain any
BLANKs, both functions produce the same result.
For three reasons, COUNTROWS is usually the better option:
1. It’s more efficient, and will perform better
2. It doesn’t consider BLANKs
For example: Sales Orders = COUNT (Sales [Order Date]) versus
Sales Orders = COUNTROWS(Sales)3. The formula intention is clearer and self-
descriptive
10. Use SEARCH () with the last parameter
The last parameter of the SEARCH () DAX function is the value that the query must
return if the search string is not found. Instead of using Error functions in conjunction
with SEARCH (), you should always use SEARCH () ().](https://image.slidesharecdn.com/daxbestpractices-230223134112-bb89f478/85/Dax-best-practices-pdf-4-320.jpg)