1. source: http://www.MSSQLTips.com/tip.asp?id=2704 -- printed: 6/5/2013 11:29:35 PM
Developing a SSRS report using a SSAS Data Source
Written By: Scott Murray -- 6/11/2012
Problem
After designing several SSRS reports based on regular relational databases, your boss would now like
several new reports to be designed and rolled out to production based on your organization's SSAS OLAP
cube. How do you get started with designing a report based on a cube?
Solution
The creation of an OLAP SSAS report is similar to other SSRS report development once you get to the
actual report layout. However, designing your data sources and datasets varies quite a bit from normal
relational database data sources and datasets.
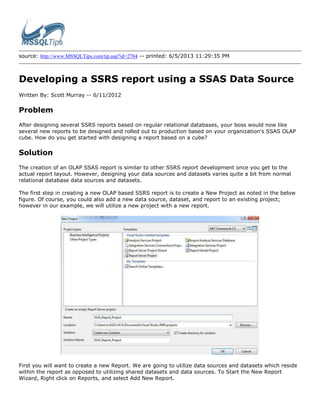
The first step in creating a new OLAP based SSRS report is to create a New Project as noted in the below
figure. Of course, you could also add a new data source, dataset, and report to an existing project;
however in our example, we will utilize a new project with a new report.
First you will want to create a new Report. We are going to utilize data sources and datasets which reside
within the report as opposed to utilizing shared datasets and data sources. To Start the New Report
Wizard, Right click on Reports, and select Add New Report.
2. The New Report Wizard opens and the first step in the wizard allows for the creation of a data source. You
will fill in the New Data Source Name and change the Type to Microsoft SQL Server Analysis Services.
Next, select the Connection String Edit button. Fill in your Server Name and then select or type in the
appropriate SSAS database name. Be sure to test the connection using the Test Connection.
Depending on the roles created for SSAS Cube you are connecting to, you may have to change the access
details noted in the Credentials window. In our demo we will use integrated security, so on the Connection
Properties dialog box, click OK.
After setting up your data source and clicking next, you will now create your dataset to be used in the
report. This step requires planning and forethought as to what fields will be displayed on the report and
what fields will be used to filter the data both when establishing the dataset and during report generation
as parameters. These decisions will impact how the data is returned to the design grid and ultimately to
the report itself. In order to define your dataset, click the Query Builder button.
3. The Query Builder button opens the Query Designer Window as displayed in the below figure.
The SSAS query designer has several options and methods that will ultimately affect your end report.
Initially, you will notice that you have the ability to drag and drop both dimensions and measures onto the
results grids. You will additionally notice how the results grid actually flattens your datasets. You can add
4. entire dimensions in one motion by clicking and dragging the Dimension folder onto the results area. Also,
the same process works for hierarchies, although you can also add individual attributes from the hierarchy
if needed.
There are several buttons in tool bar of the Query Builder that should be noted. For full descriptions of the
buttons, please see Analysis Services MDX Query Designer User Interface at
http://msdn.microsoft.com/en-us/library/ms403829.aspx. The Show Empty Cells works this same as the
MDX Non Empty clause; basically it shows / hides non empty cell values. The Auto Exec button turns on
and off the auto execution of queries as you drag and drop dimensions, measures, hierarchies, and
attributes onto the results pane. As the results get larger and more complex, it could take longer and
longer for the query results to return. The Show Aggregates button again toggles the view of aggregates
on and off. Last, the Add Calculated Members button allows for the addition of calculations at the query
level. These calculated members could also potentially be added at the report level instead.
Furthermore, the query designer contains a filter grid in the upper half of the design area. This filter area
serves several purposes:
1. Acts as a method to filter the dataset at the query level.
2. Allows for the easy creation of filters which can also act as parameters. (see additional details
about parameters below).
Filters can either be individual attributes or individual parts hierarchies.
5. The above example filters the dataset at the query level; basically, the query will be restricted to only
those items who Calendar Year equals CY 2003. You will also notice that the parameter box is not checked
in this first example. Last, since the Auto Exec button is toggled on, the query results will display Calendar
Year 2003 data. At this point, we will complete the rest of the wizard setup to create a basic report. Later
in our tip, we will discuss the parameter option. Going back to change this option later will also allow us to
review making changes to the Data Set after completing the Wizard. Clicking Ok on the Query Builder
screen returns you to the Report Wizard with the MDX query now being displayed in the Query String as
noted in the next figure. Furthermore, notice that the Calendar Year filter is part of the MDX query text.
6. The report type is selected on the next screen; a matrix report will be used in this demo.
We will complete the report by placing Year and Quarter in the Column group, Country in the Row group,
and Internet Group Profit and Internet Order Count in the Details area.
Next, accept the Matrix Style of Slate.
7. Now, finish out the report by completing the Report Name.
The initial SSAS Report design is now complete. A preview of the design and end report is displayed in the
next two figures.
8. Of course to completely finish the report you may want to complete some formatting. As such, the
numeric fields were immediately formatted to display commas and no decimals.
Our next step is to adjust the dataset filters and replace the hard coded filter for the Calendar Year to a
parameter based filter where the report consumers can select which year to display. As noted in the next
figure, expand the Datasets folder, and then right click on DataSet1, and select Query to display the
Query designer..
9. Now, change the Filter Expression to include CY 2002, CY 2003, and CY 2004. Also, check the Parameters
check box.
Adding these changes now creates a parameter for the Calendar Year which is displayed by expanding the
Parameters folder, as shown in the following figure.
10. Checking the parameter box also adds a hidden dataset, that can be shown by right clicking Datasets and
selecting Show Hidden Datasets.
After making this change to add the Calendar Year parameters and previewing the report, as shown in the
next figure, you will notice two Alls, Select All and All Periods, appear in the drop down list. The first All is
driven by the Report Server MultiParameter option while the second is driven from the MDX query that
SSRS runs to populate the Parameters list.
11. To alleviate this situation, we have several options. Either we can adjust the MDX query or we can add a
filter to the dataset to remove the All Member from the results. Using the first option, right click on the
Date Calendar Year hidden dataset (after using the technique noted above to show the hidden data set),
and then select Query. The first figure below displays the current query. Changing the highlighted word,
ALLMEMBERS to CHILDREN adjusts the query to display only the Children of the Calendar Year list and not
the All member option.
12. Alternately, we can filter the dataset using the filter dataset method; right click on the Date Calendar Year
hidden dataset (after using the technique noted above to show the hidden data set), and then select
Query Properties. The first figure below displays the current query with its related result set. Within the
Dataset Properties Window, clicking on the Filter Option, allows us to filter on any of the fields being
returned from the query. In this particular instance, I see that we can easily exclude the All Periods item,
by using a filter of ParameterLevel> 0 which is displayed in the second figure below.
Now when we run the report, as displayed in the next figure, only the individual years are displayed which
provides for a much cleaner option for the report consumers.
13. Conclusion-Creating a Cube Based Reporting Services Report
In this tutorial, we reviewed the process of creating a Report Services report based on a SSAS OLAP cube.
We learned about the process of creating an initial report using the Create Report Wizard and identified
the specific places where attention needs to be focused during the wizard steps. In particular we need to
pay close attention to the fields we place on the results grid along with the attributes and dimensions used
in the filter area. Furthermore we addressed adding a parameter to a report and specifically adjusting the
parameter query or filter to properly display the parameter options.
Next Steps
Jen Underwood's SQL Saturday Presentation on SSAS data sources.
http://www.jenunderwood.com/presentations/SQLSaturdaySSRSExcelCubeReporting.pdf
Check out these related resources:
o SQL Server Reporting Services Tutorial
o Reporting Services Development Tips
14. source: http://www.MSSQLTips.com/tip.asp?id=2866 -- printed: 6/5/2013 11:33:54 PM
SQL Server Reporting Services Using Multi-value
Parameters
Written By: Scott Murray -- 1/21/2013
Problem
After working with SQL Server Reporting Services ( SSRS ) for a time, eventually a report user will
want to select more than one value for a parameter. How does SSRS handle multi-value parameters?
Solution
Allowing users to select multiple values from a parameter list is a great feature in SSRS; it allows
report consumers more selection flexibility when running reports. However, how the parameters are
passed to the dataset (or report object filters if used) varies depending on if the datasource is based on
T-SQL embedded in a dataset within a report or if the data is passed via a stored procedure.
Furthermore, once the report is run, a good practice is to display the selected parameter list
somewhere within the report. The below instructions will convey the various techniques needed to
utilize multi-value parameters. Finally, we will cover using a filter based multi-value parameters.
Embedded Parameters
Of the various options, passing multi value parameters to an embedded query is the less complex of
the two methods. Utilizing this method, the report designer just needs to write a normal query, and
utilize the "IN" key word in the criteria section of the query and then refer to the multi-value parameter
using the @parameter name syntax within the parentheses portion of the IN statement. Using an
AdventureWorks database and report example, the below code, inserted into a report dataset, notates
the required syntax. This syntax should be somewhat standard to many of you who write T-SQL on a
daily basis.
SELECT P.FirstName + ' ' + P.LastName AS Employee
,DATEPART(Year, SOH.OrderDate) AS Year
,DATEPART(Month, SOH.OrderDate) AS MonthNumber
,DATENAME(Month, SOH.OrderDate) AS Month
,SUM(DET.LineTotal) AS Sales
FROM Sales.SalesPerson AS SP
INNER JOIN Sales.SalesOrderHeader AS SOH ON SP.BusinessEntityID = SOH.SalesPersonID
INNER JOIN Sales.SalesOrderDetail AS DET ON SOH.SalesOrderID = DET.SalesOrderID
INNER JOIN Sales.SalesTerritory AS ST ON SP.TerritoryID = ST.TerritoryID
INNER JOIN HumanResources.Employee AS E ON SOH.SalesPersonID = E.BusinessEntityID
INNER JOIN Person.Person AS P ON P.BusinessEntityID = SP.BusinessEntityID
WHERE (YEAR(SOH.OrderDate) IN (@ReportYear))
GROUP BY P.FirstName + ' ' + P.LastName
,SOH.SalesPersonID
15. ,DATEPART(Year, SOH.OrderDate)
,DATEPART(Month, SOH.OrderDate)
,DATENAME(Month, SOH.OrderDate)
Next we will setup the parameter to accept multiple values. In the below example, a parameter called
@ReportYear is already created, so right mouse clicking on the parameter (Report Year in the below
example ) and selecting Parameter Properties will open the Report Parameter Properties window. Now
check the Allow multiple values option. If you are setting up a new parameter, right mouse click on
Parameters and then select New Parameter.
Subsequently, we will define the values to be used for our parameter list; this list will be the values
presented to the report consumer. First, we define a dataset using the following simple query to
generate a list of values for the ReportYear field.
SELECT
Year(SOH.OrderDate) AS Year
FROM
Sales.SalesOrderHeader AS SOH
GROUP BY
Year(SOH.OrderDate)
16. ORDER BY SOH.Year
Finally, we set the dataset, Year_Lookup, to be used for the available values for the ReportYear
parameter, and note below.
Now, the parameter is setup to accept multiple values. The setup required several steps including
setting up our main report query to accept a parameter using the IN criteria, changing the allow
multiple values option on the parameter properties, and last, generating a list of available values, in
this example using another query. The end result is two fold. First, the report consumer now sees
17. check boxes next to each parameter item which allows the user to select multiple values, as displayed
below. Second, the report displays only the years selected.
Finally, the report data displays the years selected.
You may notice in the above figure that the title shows #Error after Sales Report for:.This field
references the @ReportYear parameter; when this parameter was just a single value, it displayed
correctly. However, now that the parameter is multiple values, SSRS is unable to display a value.
Fortunately, the SSRS Join function can be used to display all the values selected and separate them
with a fixed symbol. For this report we will break up the years with an &. The exact formula used is as
follows:
=JOIN(Parameters!ReportYear.Value, " & ")
The report with the JOIN function utilized is displayed below.
18. Multiple Value Parameters and Stored Procedure Based Datasets
Using stored procedures as the basis for SSRS datasets offers many advantages including potential
reuse by other reports and potential performance advantages. However, multi-value parameters do not
work well when getting passed to a stored procedure. Embedded SQL datasets noted above handle the
parsing of the multiple values used in the IN criteria. To the contrary, when the multiple values are
passed to a stored procedure, all the values are conveyed as one value.
The ReportYear parameter in our example report, for instance, would get passed as one value,
"2006,2007,2008" which, of course would return no rows. Fortunately, we can use a string splitter
function as part of our stored procedure to break up the years into multiple values. We will once again
turn to using a Tally table by Jeff Moden; please see this article on using the Tally table to parse out
the values, http://www.sqlservercentral.com/articles/Tally+Table/72993/.
I am not going to repeat Mr. Moden's code in the article, since it would be beneficial for you to
understand what it can and cannot do. We will however use this function in dataset stored procedure
which is noted below. Please make the following notes about the stored procedure. First we are passing
in the concatenated multi-value parameter as a single entity and we use a varchar parameter (which
must be large enough to accept the maximum length of all the parameters which might be selected).
Next using the splitter function, the values are parsed out and placed into a temporary table,
#YEAR_LIST. Last, the year criteria is moved from being part of the where clause to being part of the
joins.
SET ANSI_NULLS ON
GO
SET QUOTED_IDENTIFIER ON
GO
-- =============================================
-- Author: Scott Murray
-- Create date: 01/01/2013
-- Description: Sales by year query with parameter breakout
-- =============================================
ALTER PROCEDURE dbo.usp_Sales_by_Year
@ReportYearvarchar(50)
AS
BEGIN
-- SET NOCOUNT ON added to prevent extra result sets from
-- interfering with SELECT statements.
SET NOCOUNT ON;
--Parse values into table which will be an inner join on main data query.
SELECT Item
INTO #YEAR_LIST
FROM
dbo.DelimitedSplit8K(@ReportYear,',')
19. --Main Dataset
SELECT P.FirstName + ' ' + P.LastName AS Employee
,DATEPART(Year, SOH.OrderDate) AS Year
,DATEPART(Month, SOH.OrderDate) AS MonthNumber
,DATENAME(Month, SOH.OrderDate) AS Month
,SUM(DET.LineTotal) AS Sales
FROM Sales.SalesPerson AS SP
INNER JOIN Sales.SalesOrderHeader AS SOH ON SP.BusinessEntityID = SOH.SalesPersonID
INNER JOIN Sales.SalesOrderDetail AS DET ON SOH.SalesOrderID = DET.SalesOrderID
INNER JOIN Sales.SalesTerritory AS ST ON SP.TerritoryID = ST.TerritoryID
INNER JOIN HumanResources.Employee AS E ON SOH.SalesPersonID = E.BusinessEntityID
INNER JOIN Person.Person AS P ON P.BusinessEntityID = SP.BusinessEntityID
INNER JOIN #YEAR_LIST AS YEARLIST ON YEAR(SOH.OrderDate) = YEARLIST.Item --Use join
instead of where clause
--WHERE (YEAR(SOH.OrderDate) IN (@ReportYear))
GROUP BY P.FirstName + ' ' + P.LastName
,SOH.SalesPersonID
,DATEPART(Year, SOH.OrderDate)
,DATEPART(Month, SOH.OrderDate)
,DATENAME(Month, SOH.OrderDate)
END
GO
Certainly other methods exists to handle the parsing and include using the function in the where clause
(I would avoid this method as I would not want to call this function for every row!). Alternatively, you
could use a cross apply to match the years with the dataset. The final report utilizing the stored
procedure methods is displayed subsequently.
Using Filters with Multiple Value Parameters
One last alternative involving the use of parameters pertains to dataset or object filters. Using filters at
the object level, for example on a tablix, actually allows the same "larger" dataset to be used for
multiple purposes while at the same time filtering the individual report parts based on a particular
criteria. This setup can be advantageous in using a single dataset for all the report data; however, you
also need to be careful about retrieving "very large" datasets while only using very small sets of the
data. To setup a filter, first select the object in question, and then right mouse, click and select
properties as illustrated below.
20. On the properties window, select the Filter window, and click add. Select the "field" or expression that
is to be filtered, and then select the "In" Operator. Last, click on the fx expression builder button to the
right of the value field to open the expression builder box.
21. As shown in the below illustration, within the filter expression box, click on Parameters under Category,
and then double click on ReportYear Under years. What appears in the expression value box includes
"(0)" at the end of name. This zero actually means retrieve the parameter in ordinal position 0 (ie the
first parameter of the selected parameters). As you are probably realizing, that is not what we would
like to filter on; we want to filter on all the parameter values selected. The trick to make the filter work,
is as easy as removing the "(0)" from the expression.
Finally, the filter expression value actually should look as displayed below.
22. Now, the resulting report using a multiple value tablix filter is illustrated below.
Conclusion
Multiple value parameters are a wonderful tool within SSRS; their methods in practice, though, varies
depending on their usage within embedded T-SQL, within stored procedures, or as part of an SSRS
object filter. Embedded T-SQL is somewhat easier to use, however, the query can not be easily shared;
to the contrary, using a stored procedure offers the ability to reuse a query (and other set based and
logic structures), but you must parse parameter. Using a multiple value parameter with an object filter
is also easy to implement as long as you know how to implement the parameter values in the filter.
Last, it is often beneficial to display the parameters selected by the report consumer; the join function
in SSRS allows you to display the parameter list easily in the report header or body.
Next Steps
Single-Value and Multi-value Parameters (Report Builder and SSRS)-- http://msdn.microsoft.com/en-
us/library/aa337292.aspx
Creating Dynamic Report Filters in SQL Server Reporting Services SSRS --
http://www.mssqltips.com/sqlservertip/1897/creating-dynamic-report-filters-in-sql-server-reporting-services-ssrs/
Hiding parameters and using default parameter values in SSRS reports --
http://www.mssqltips.com/sqlservertip/2202/hiding-parameters-and-using-default-parameter-values-in-ssrs-reports/
Custom control and setup of SSRS report parameters from a web page --
http://www.mssqltips.com/sqlservertip/1751/custom-control-and-setup-of-ssrs-report-parameters-from-a-web-page/
Check out this additional tip on multi-parameter SSRS reports
23. source: http://www.MSSQLTips.com/tip.asp?id=2879 -- printed: 6/5/2013 11:35:50 PM
Building Key Performance Indicators (KPIs) with
PowerPivot
Written By: Brady Upton -- 3/5/2013
Problem
While PowerPivot isn’t necessarily “new technology” I think businesses are trying to move towards it
because Excel savvy end users can create their own reports without tying up IT resources. KPI’s are
just another addition to PowerPivot that allows users to visually analyze data across millions of rows.
In a previous tip I explained how to use PowerPivot with Excel 2013. This tip will focus on creating
calculated fields and KPI’s in PowerPivot. Check it out.
Solution
A KPI (Key Performance Indicator) is a graphical representation that displays progress against a
predefined measure or business goal. KPIs make it easier for end users to evaluate the amount of
progress without reading a bunch of data.
If you are new to PowerPivot, try looking over some of these tips first to gain a foundation on what
PowerPivot is and some of the basics of creating dashboards.
In this example, I’ll use AdventureWorksDW2012 sample data so you can follow along with me. The
database can be downloaded here.
Let’s get started.
Enabling PowerPivot in Excel 2013
To enable PowerPivot, open Excel, go to File, Options, Add-Ins, select COM Add-ins and click Go. This
will open up the COM Add-Ins dialog box. Click “Microsoft Office PowerPivot for Excel 2013” and hit OK.
After successfully enabling PowerPivot, the tab should appear at the top of the Excel spreadsheet:
Importing Data
Open Excel, click the PowerPivot tab, Manage:
24. Upon clicking Manage, a new window should appear. From this window, you will import data. Click
From Database and select From SQL Server:
Type in the Server Name, Authentication mode, and browse to the AdventureWorksDW2012 database:
25. Click Next, choose “Select from a list of tables and views to choose the data to import” and click Next.
The next screen is where we will select our data to import. For this example, choose FactInternetSales
and click “Select Related Tables”. The Select Related Tables button enables you to automatically select
every table that is related to the source table selected:
After clicking Finish, the import will begin. Once the import finishes successfully you should be able to
view all the tables separated into sheets:
Creating PivotTable
Before creating a KPI we will need to slice and dice our data into a PivotTable. To do this, click
PivotTable on the ribbon bar and choose New Worksheet:
26. Our boss wants a PowerPivot report that displays quarterly profit percentages on AdventureWorks’ total
sales. Before we design the report we need to determine the calculation that we’ll need to get to this
point. If I take the product cost and subtract it from the sales cost I’ll get my total profit in dollars.
Then I’ll take that amount and divide it by the total product cost, which will give me the total
percentage.
OK, easy enough. Let’s design the dashboard.
First, we need to slice the dashboard up into quarters since we only want to report on quarterly
numbers. To do this, drilldown the DimDate header and drag down CalendarYear and CalendarQuarter
into the Rows section: (Make sure CalendarYear is on top of CalendarQuarter)
We now have a PivotTable with something on it. Next we need to add some values. Drilldown the
FactInternetSales header and drag SalesAmount down to the Values section:
27. Our Pivot table is coming along. We now have the total sales amount broken down by each quarter.
Next we’ll need to add the total product cost. Drag TotalProductCost to the Values section below
SalesAmount:
Create Calculated Fields
So far, so good. The next column we need to add will be a calculated column. We will need to
determine the profit from each quarter. To determine the profit we will need to subtract the sales
28. amount from the product cost.
Under the PowerPivot tab, click Calculated Fields and select New Calculated Field:
On the Calculated Field window select the table name, give the field a name, and enter your formula.
For our example, we will use the FactInternetSales table, name it TotalProfit, and enter our formula as
=SUM(FactInternetSales[SalesAmount])-SUM(FactInternetSales[TotalProductCost])
We have now created a calculated field that will subtract the sales amount from the product cost. After
clicking OK, the new column should appear to the right:
29. Now we need to create a calculated field that will give us the percentage of profit. To do this, we will
need the outcome of the above calculated field.
Choose New Calculated Field and enter the following:
Table name: FactInternetSales
Calculated field name: ProfitPercentage
Formula: =[TotalProfit]/SUM(FactInternetSales[TotalProductCost])
In this example we used the outcome of TotalProfit and divided it by the Total Product Cost. After
clicking OK, the new column should appear to the right:
30. To format the calculated columns, highlight the column and right click and choose Format Cells:
Create KPI
The dashboard is almost is complete except for the KPI. To add a KPI click KPI’s, New KPI:
31. On the KPI screen we will need to choose the calculated field that we are basing our KPI values on. We
will also choose absolute value because we didn’t create another calculated value to compare with. We
will change the Absolute Value to 1 and move the thresholds like below. The status thresholds are
reporting on the percentage in decimal form, for example, 70% looks like .70.
After clicking OK, we notice that the KPI’s have been added to the right:
32. Next Steps
To find out more about KPI's in PowerPivot click here to visit Microsoft's Office site.
Creating basic PowerPivot dashboards are fairly easy and usually don't require any IT resources
except to provide a data model and possibly security access to the database for importing data.
You can find other tips regarding Microsoft Excel Integration here.