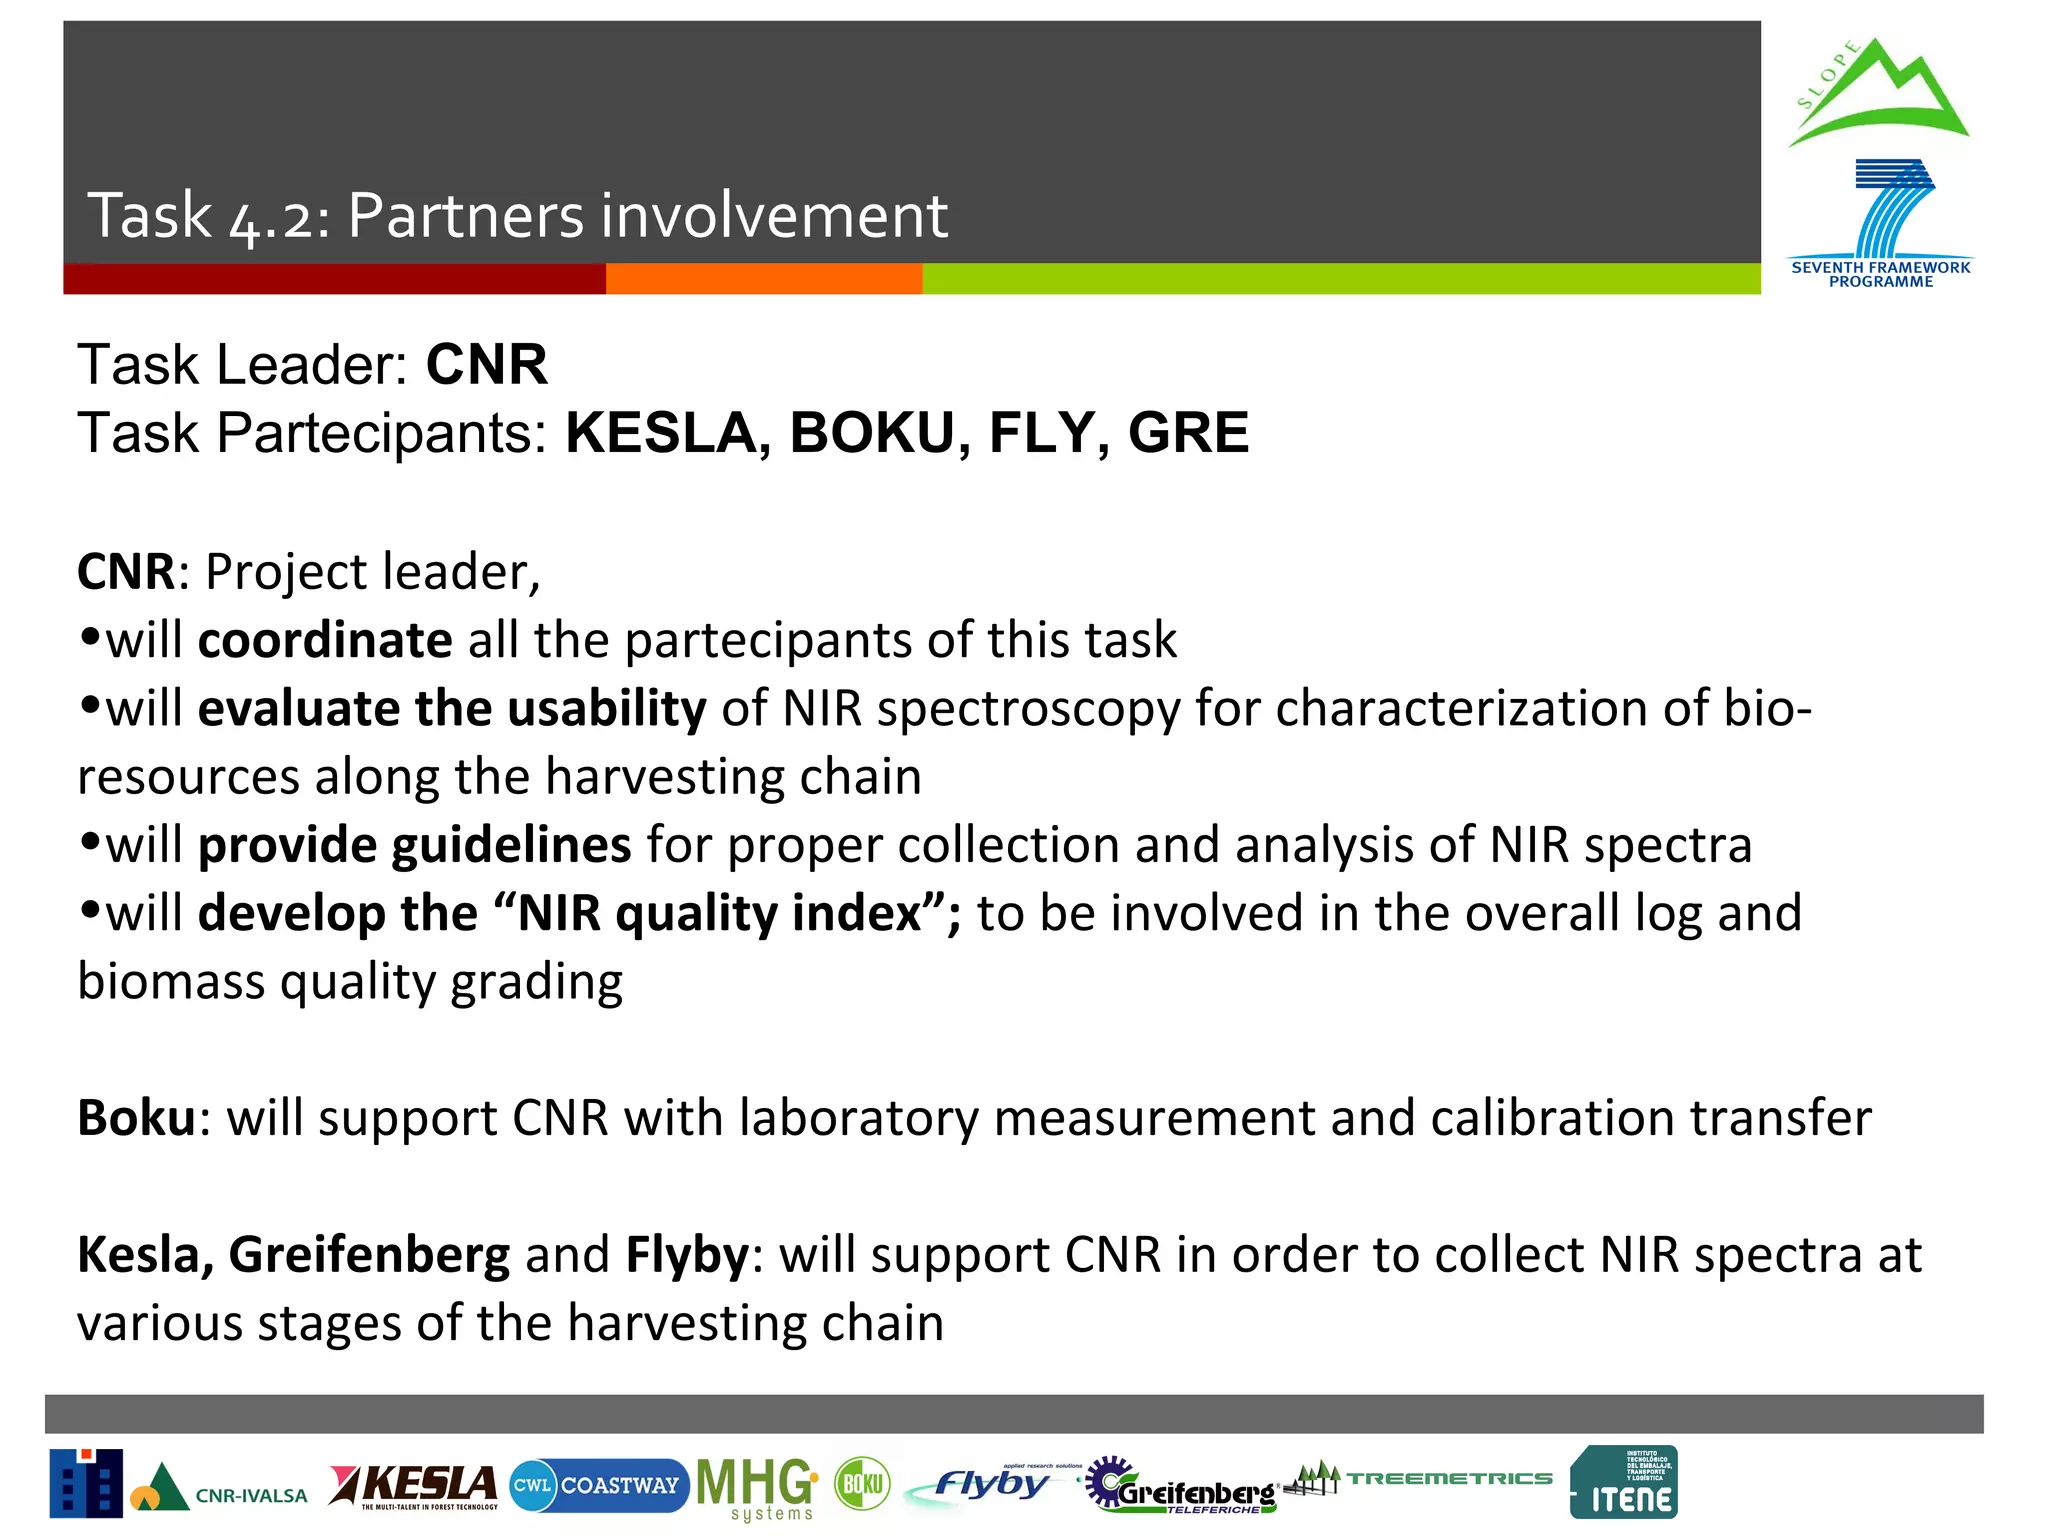
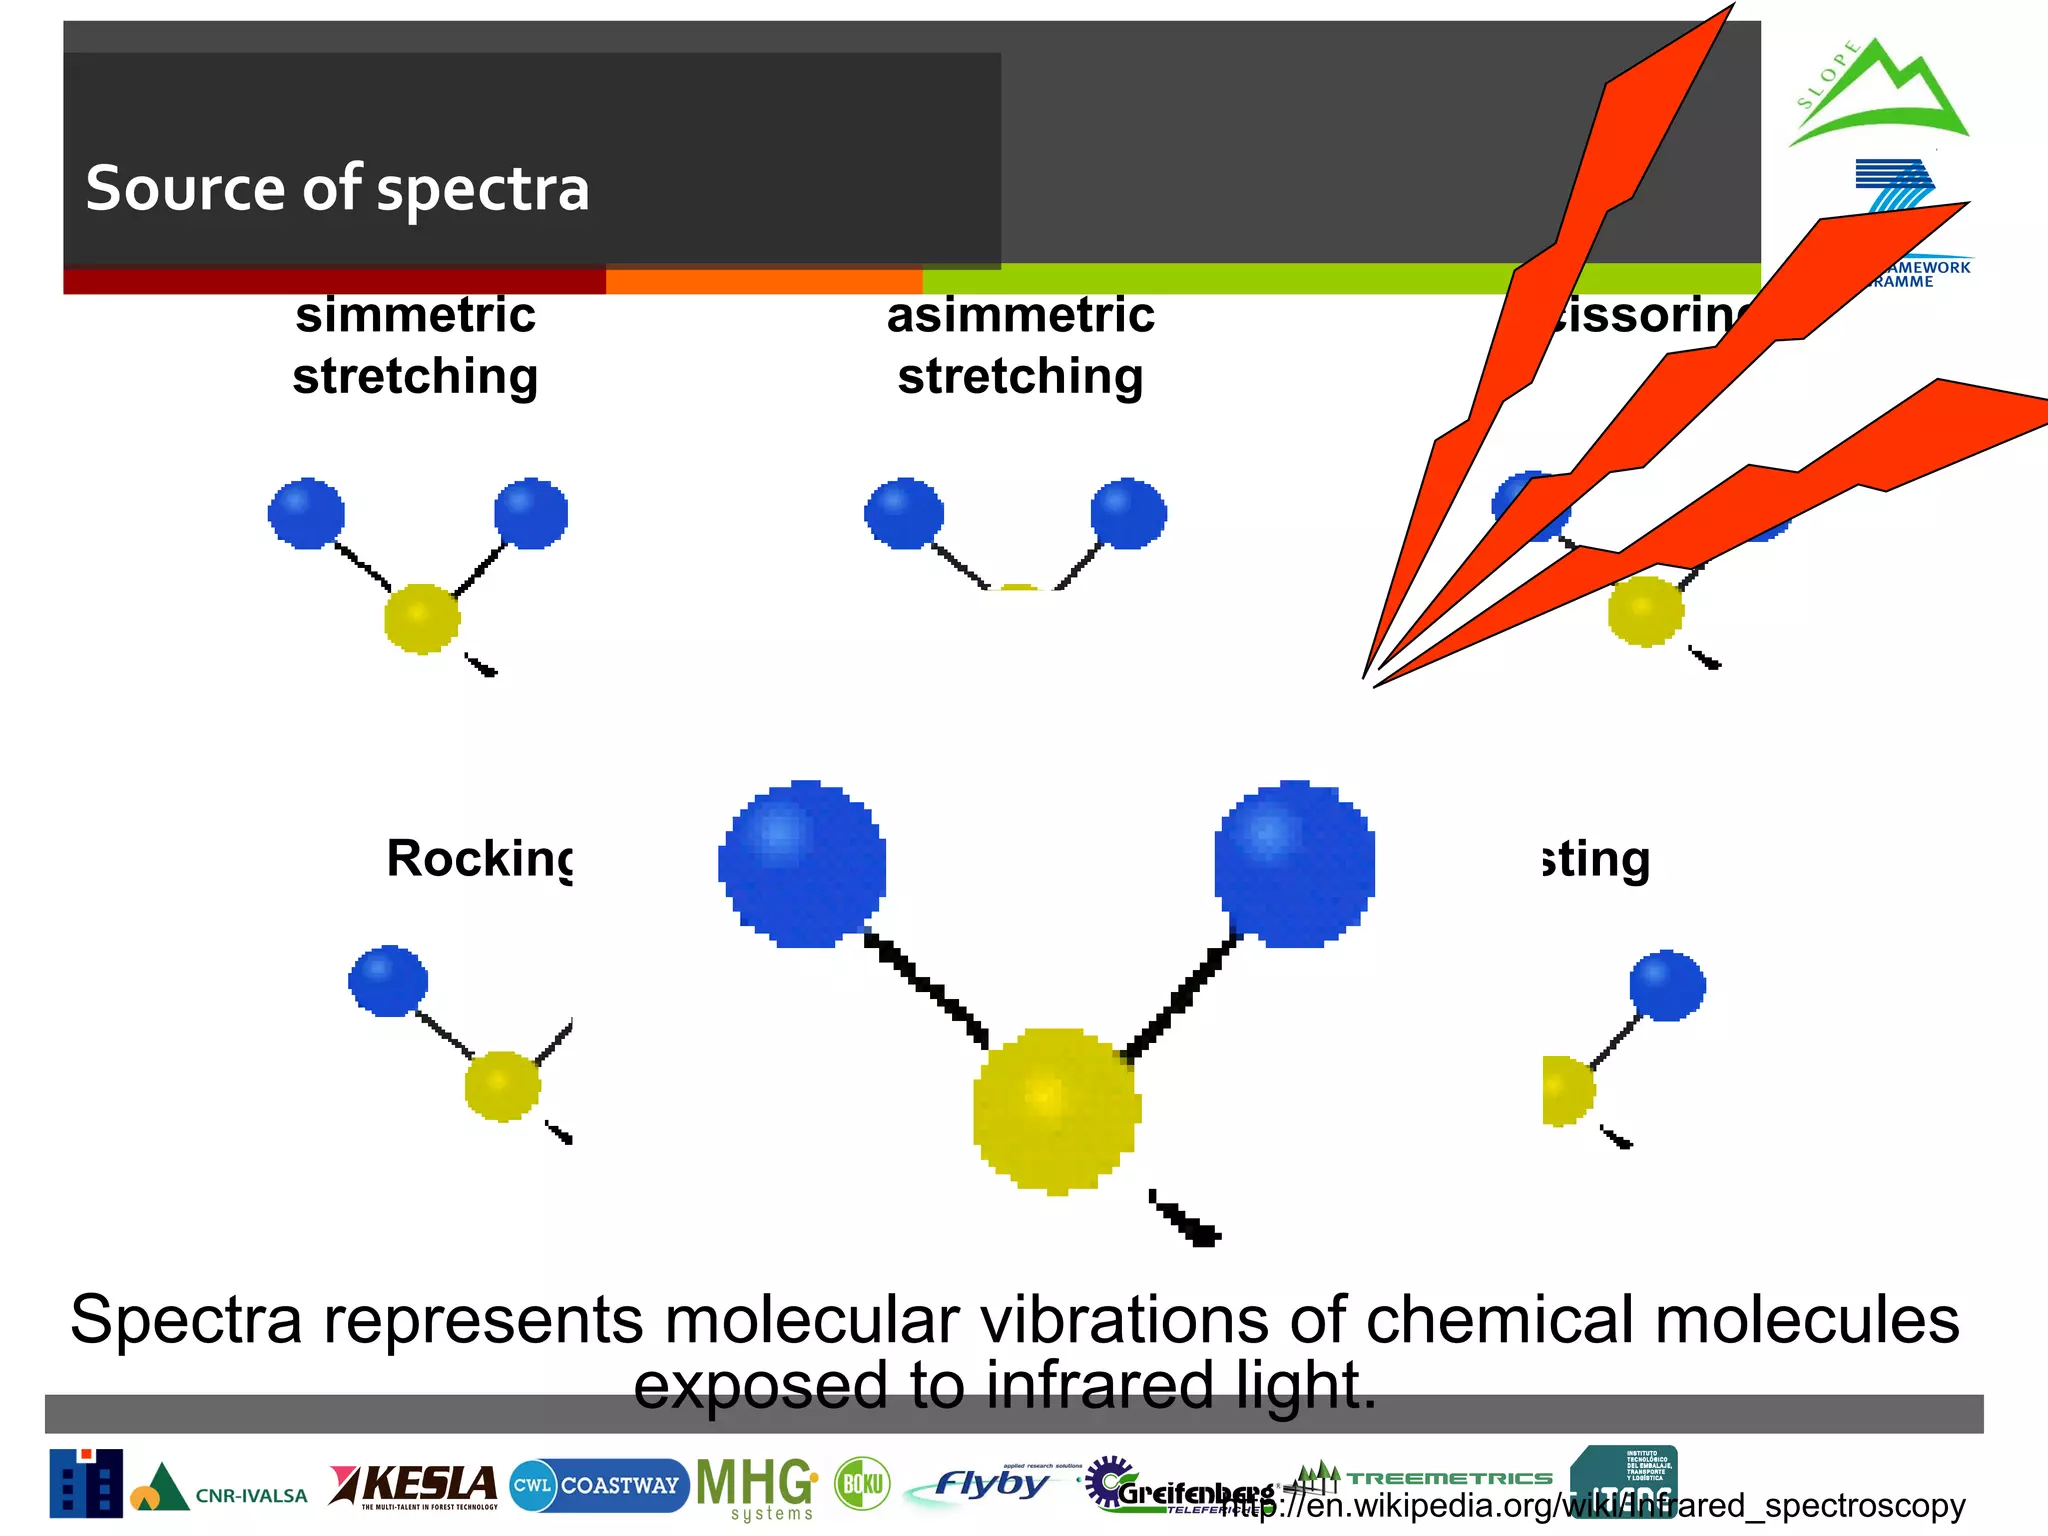
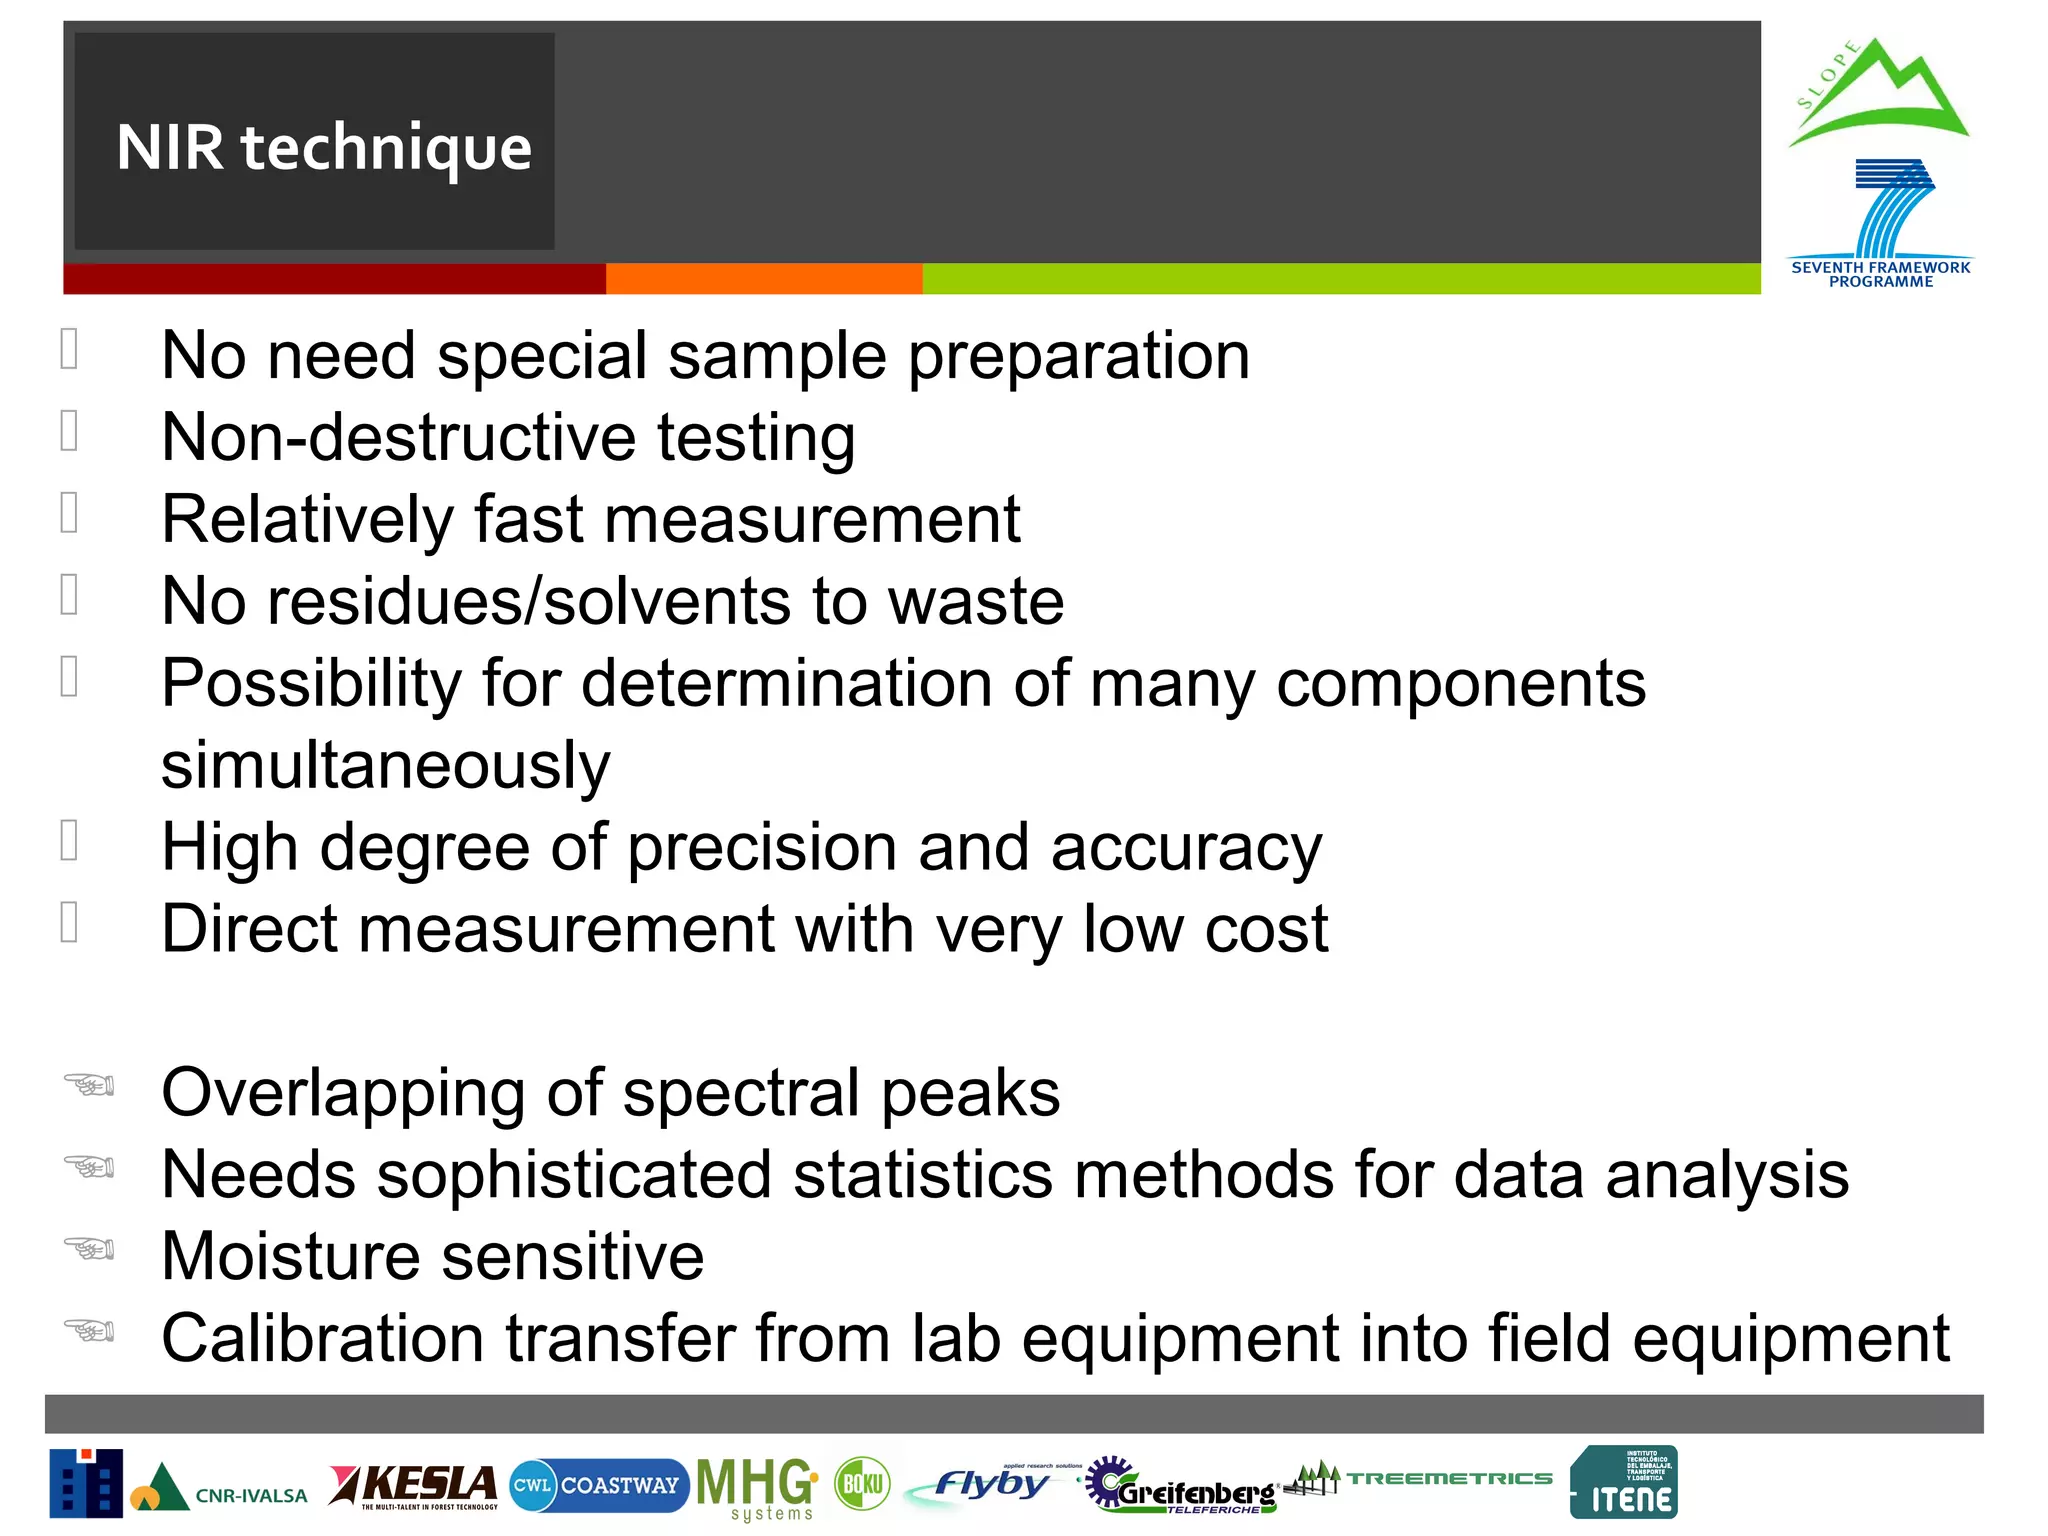
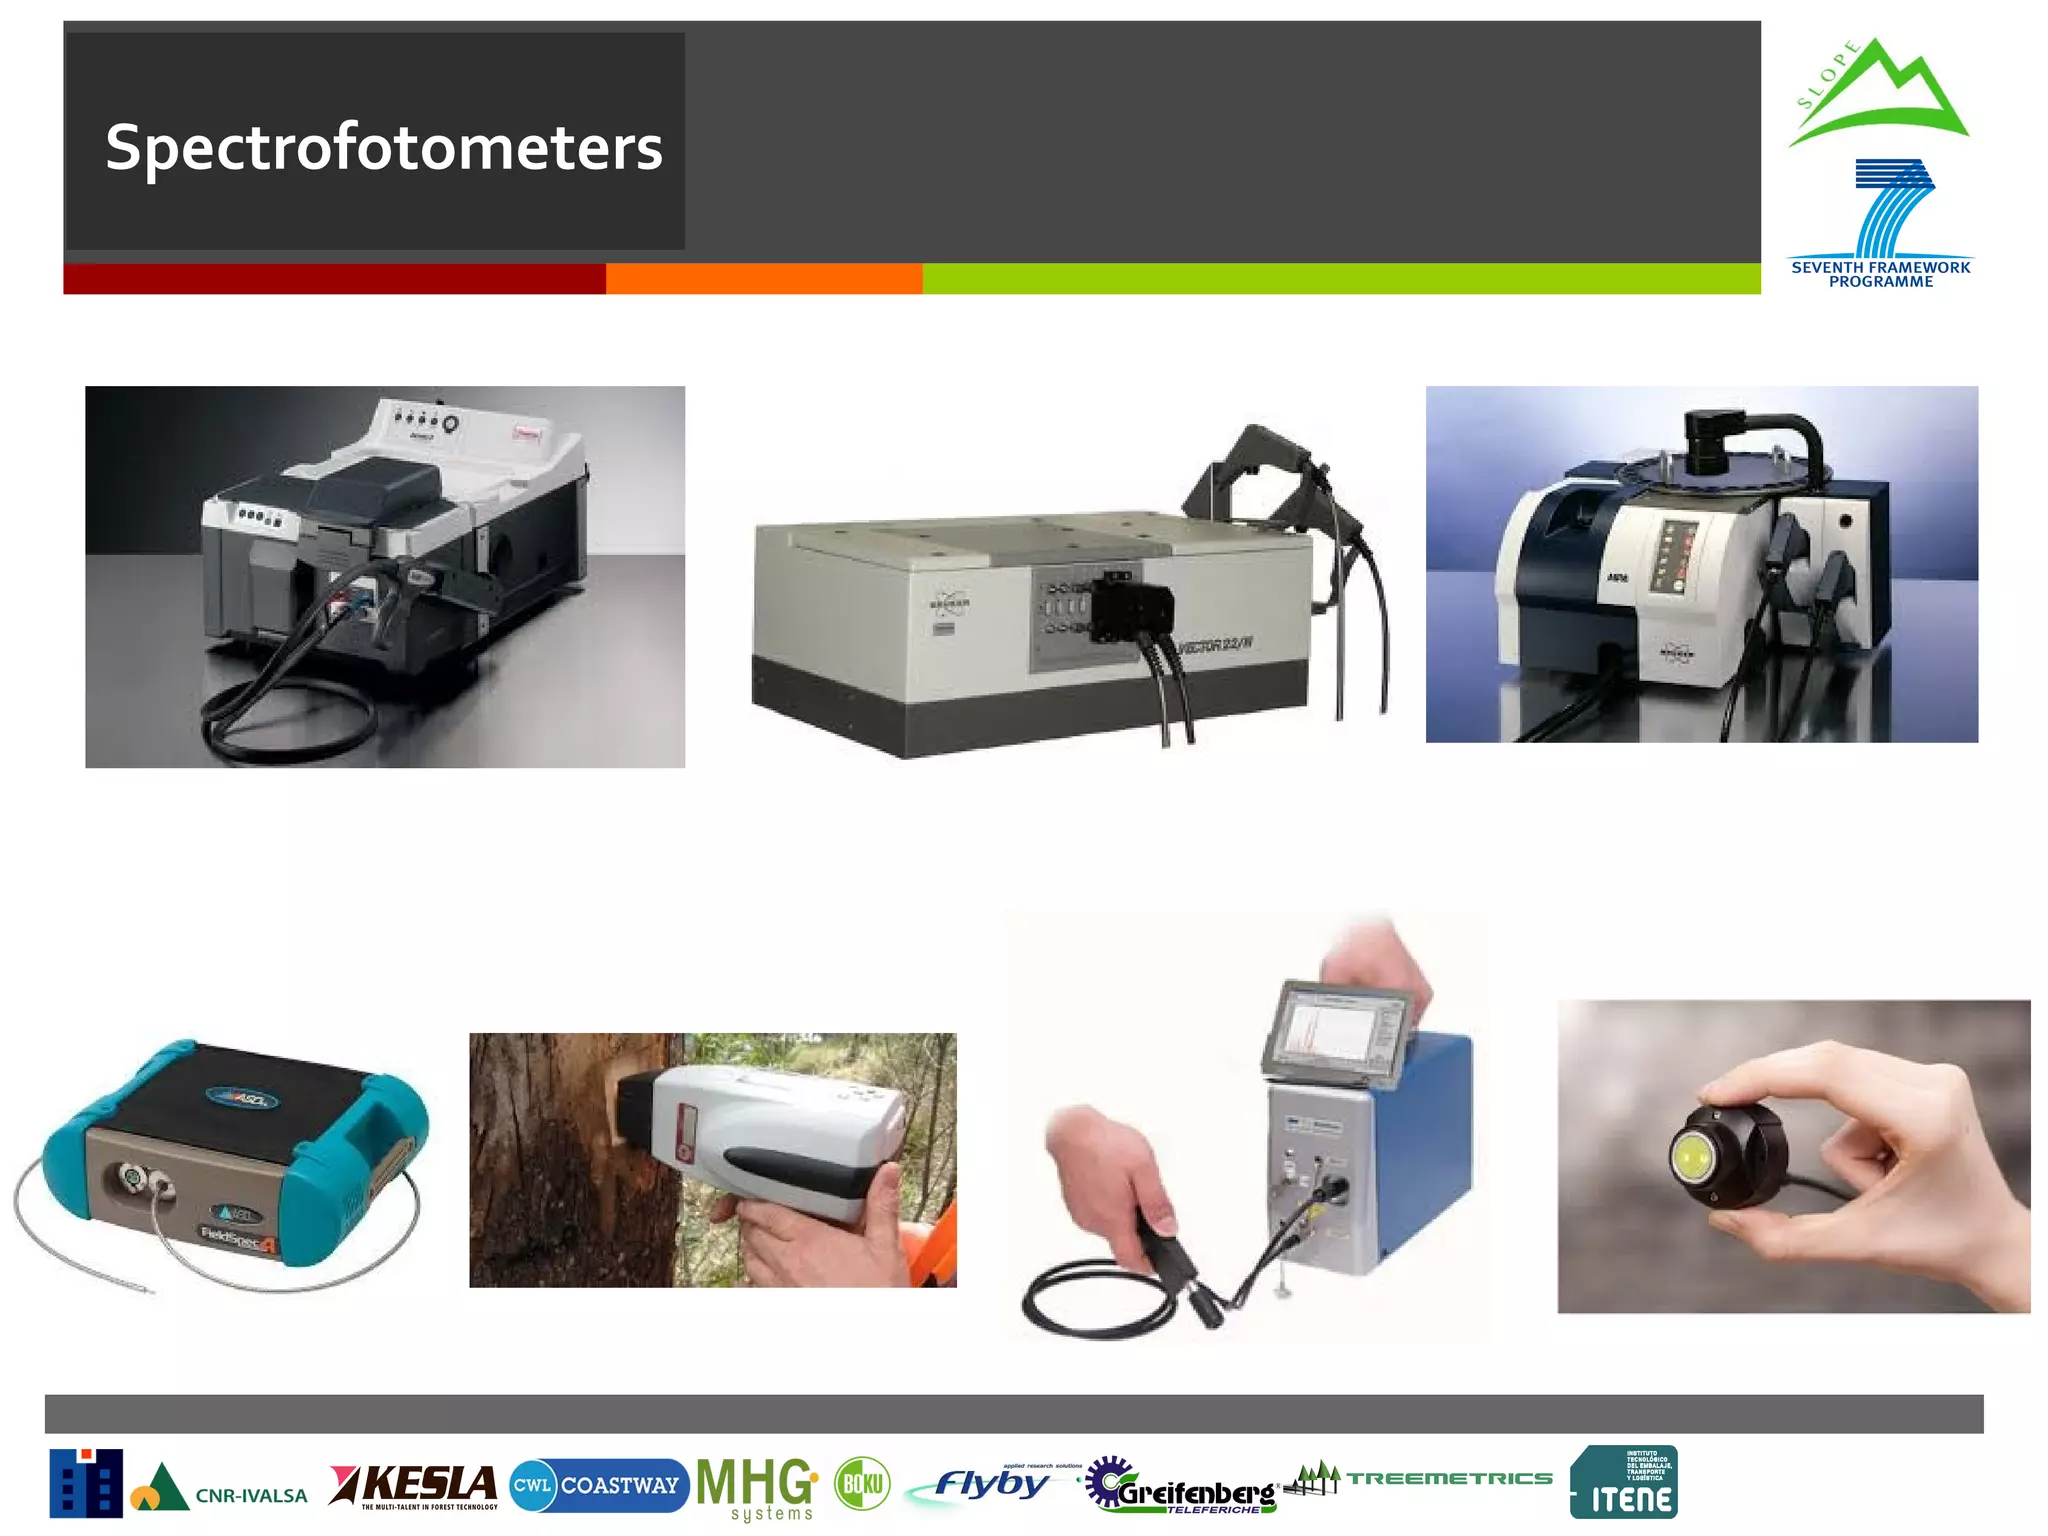
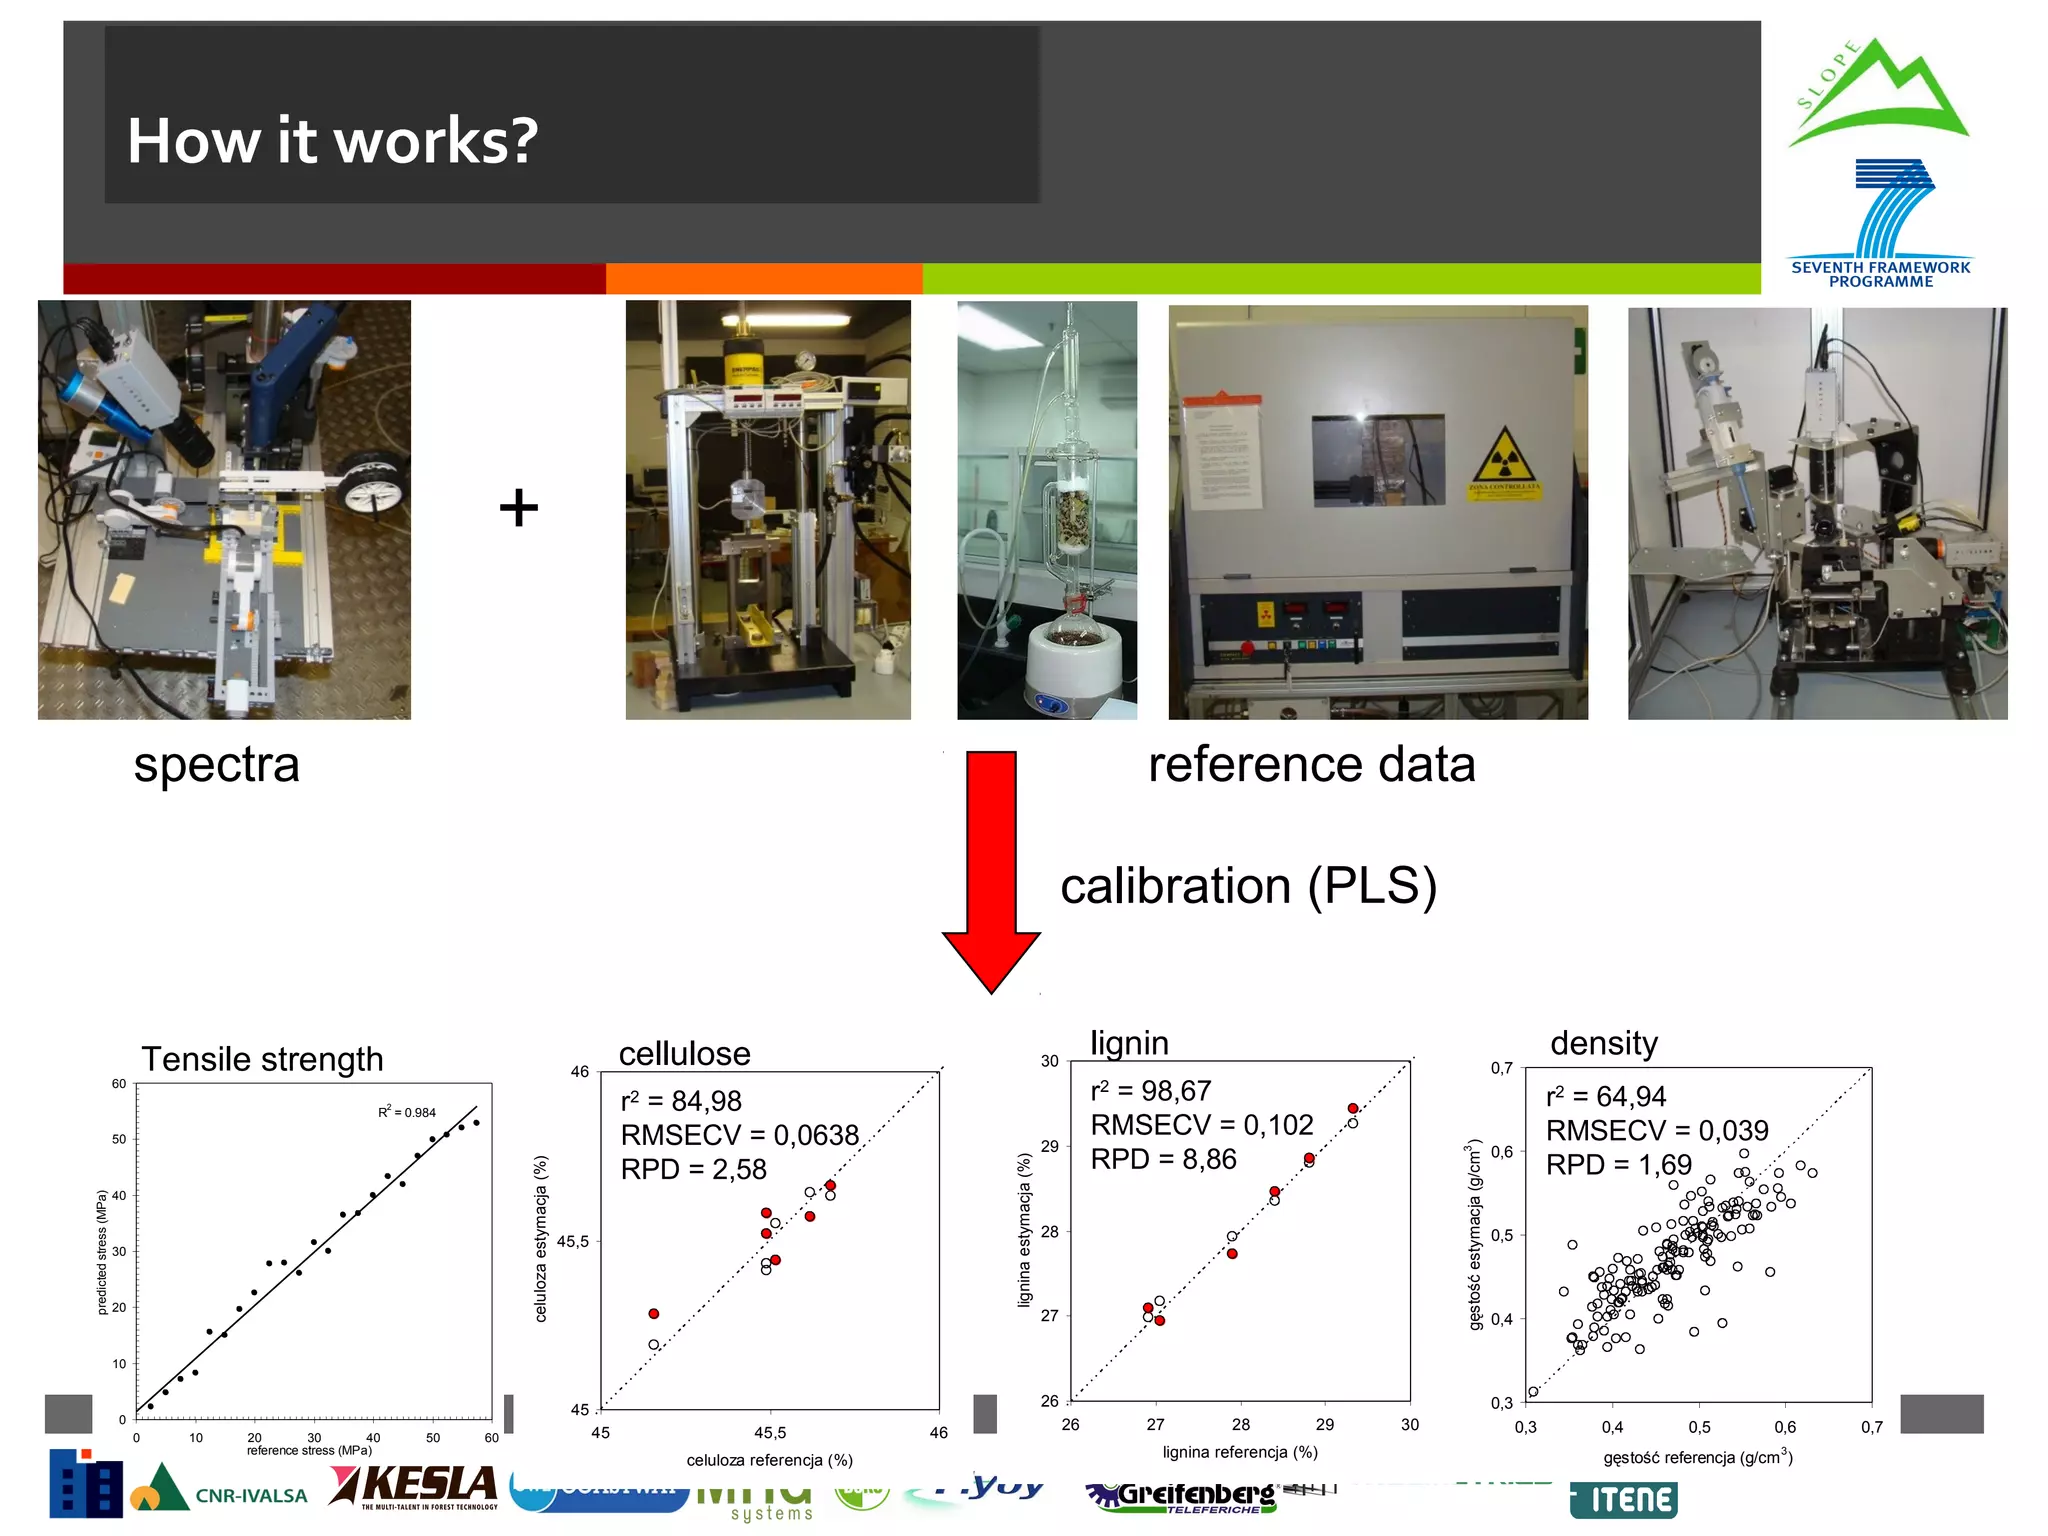
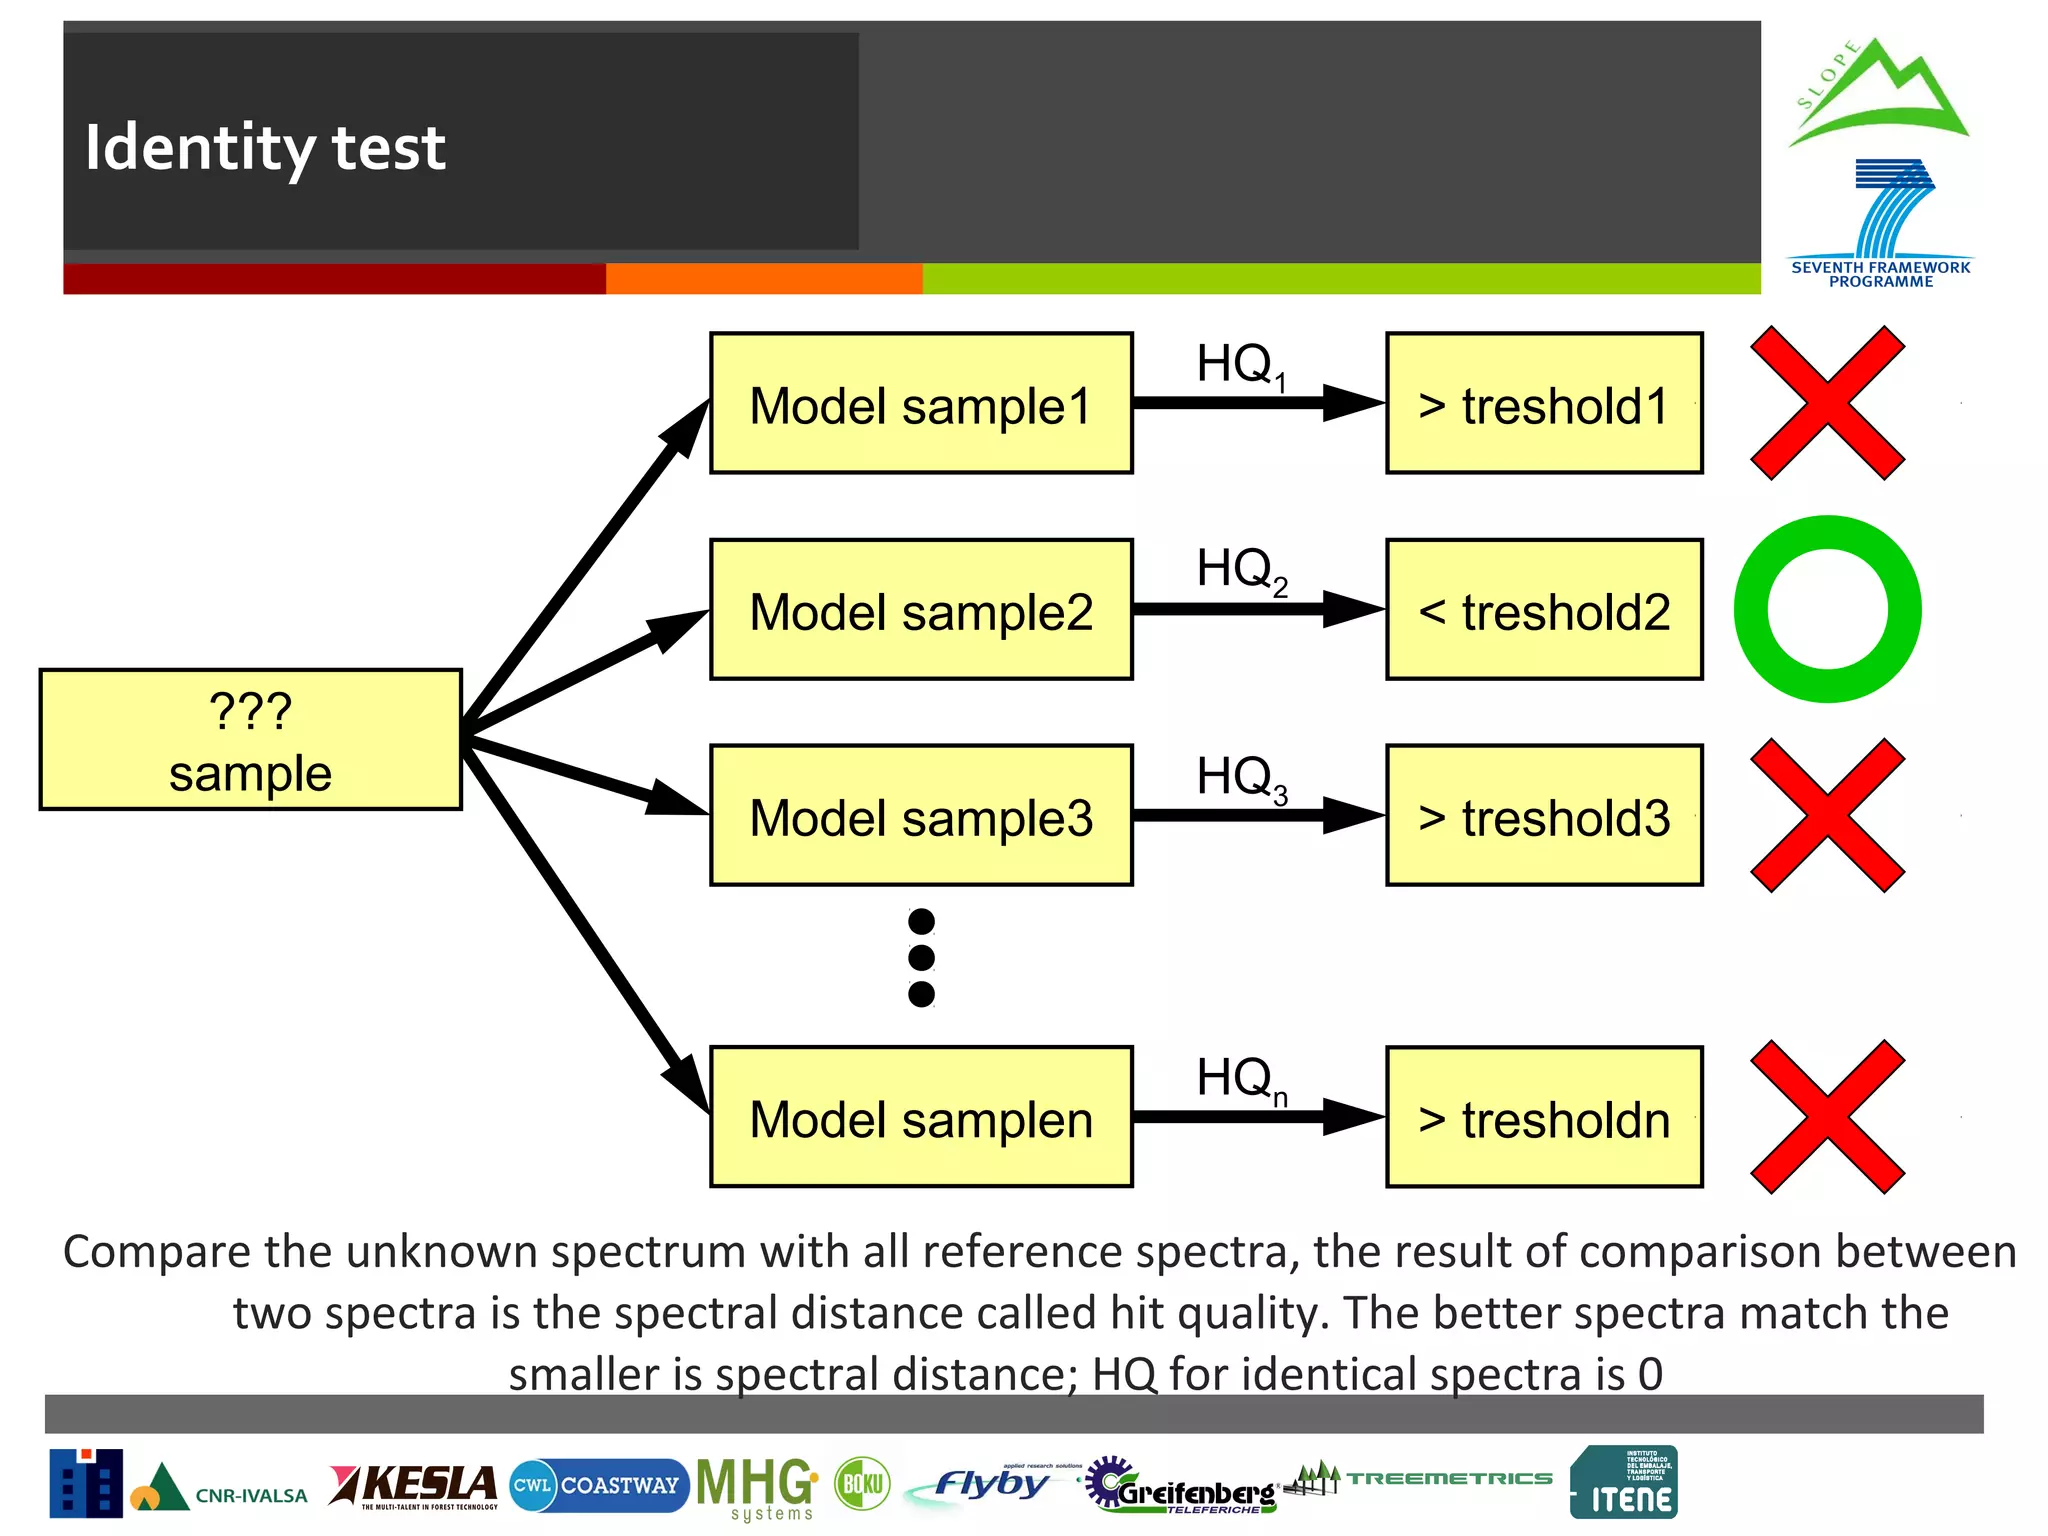
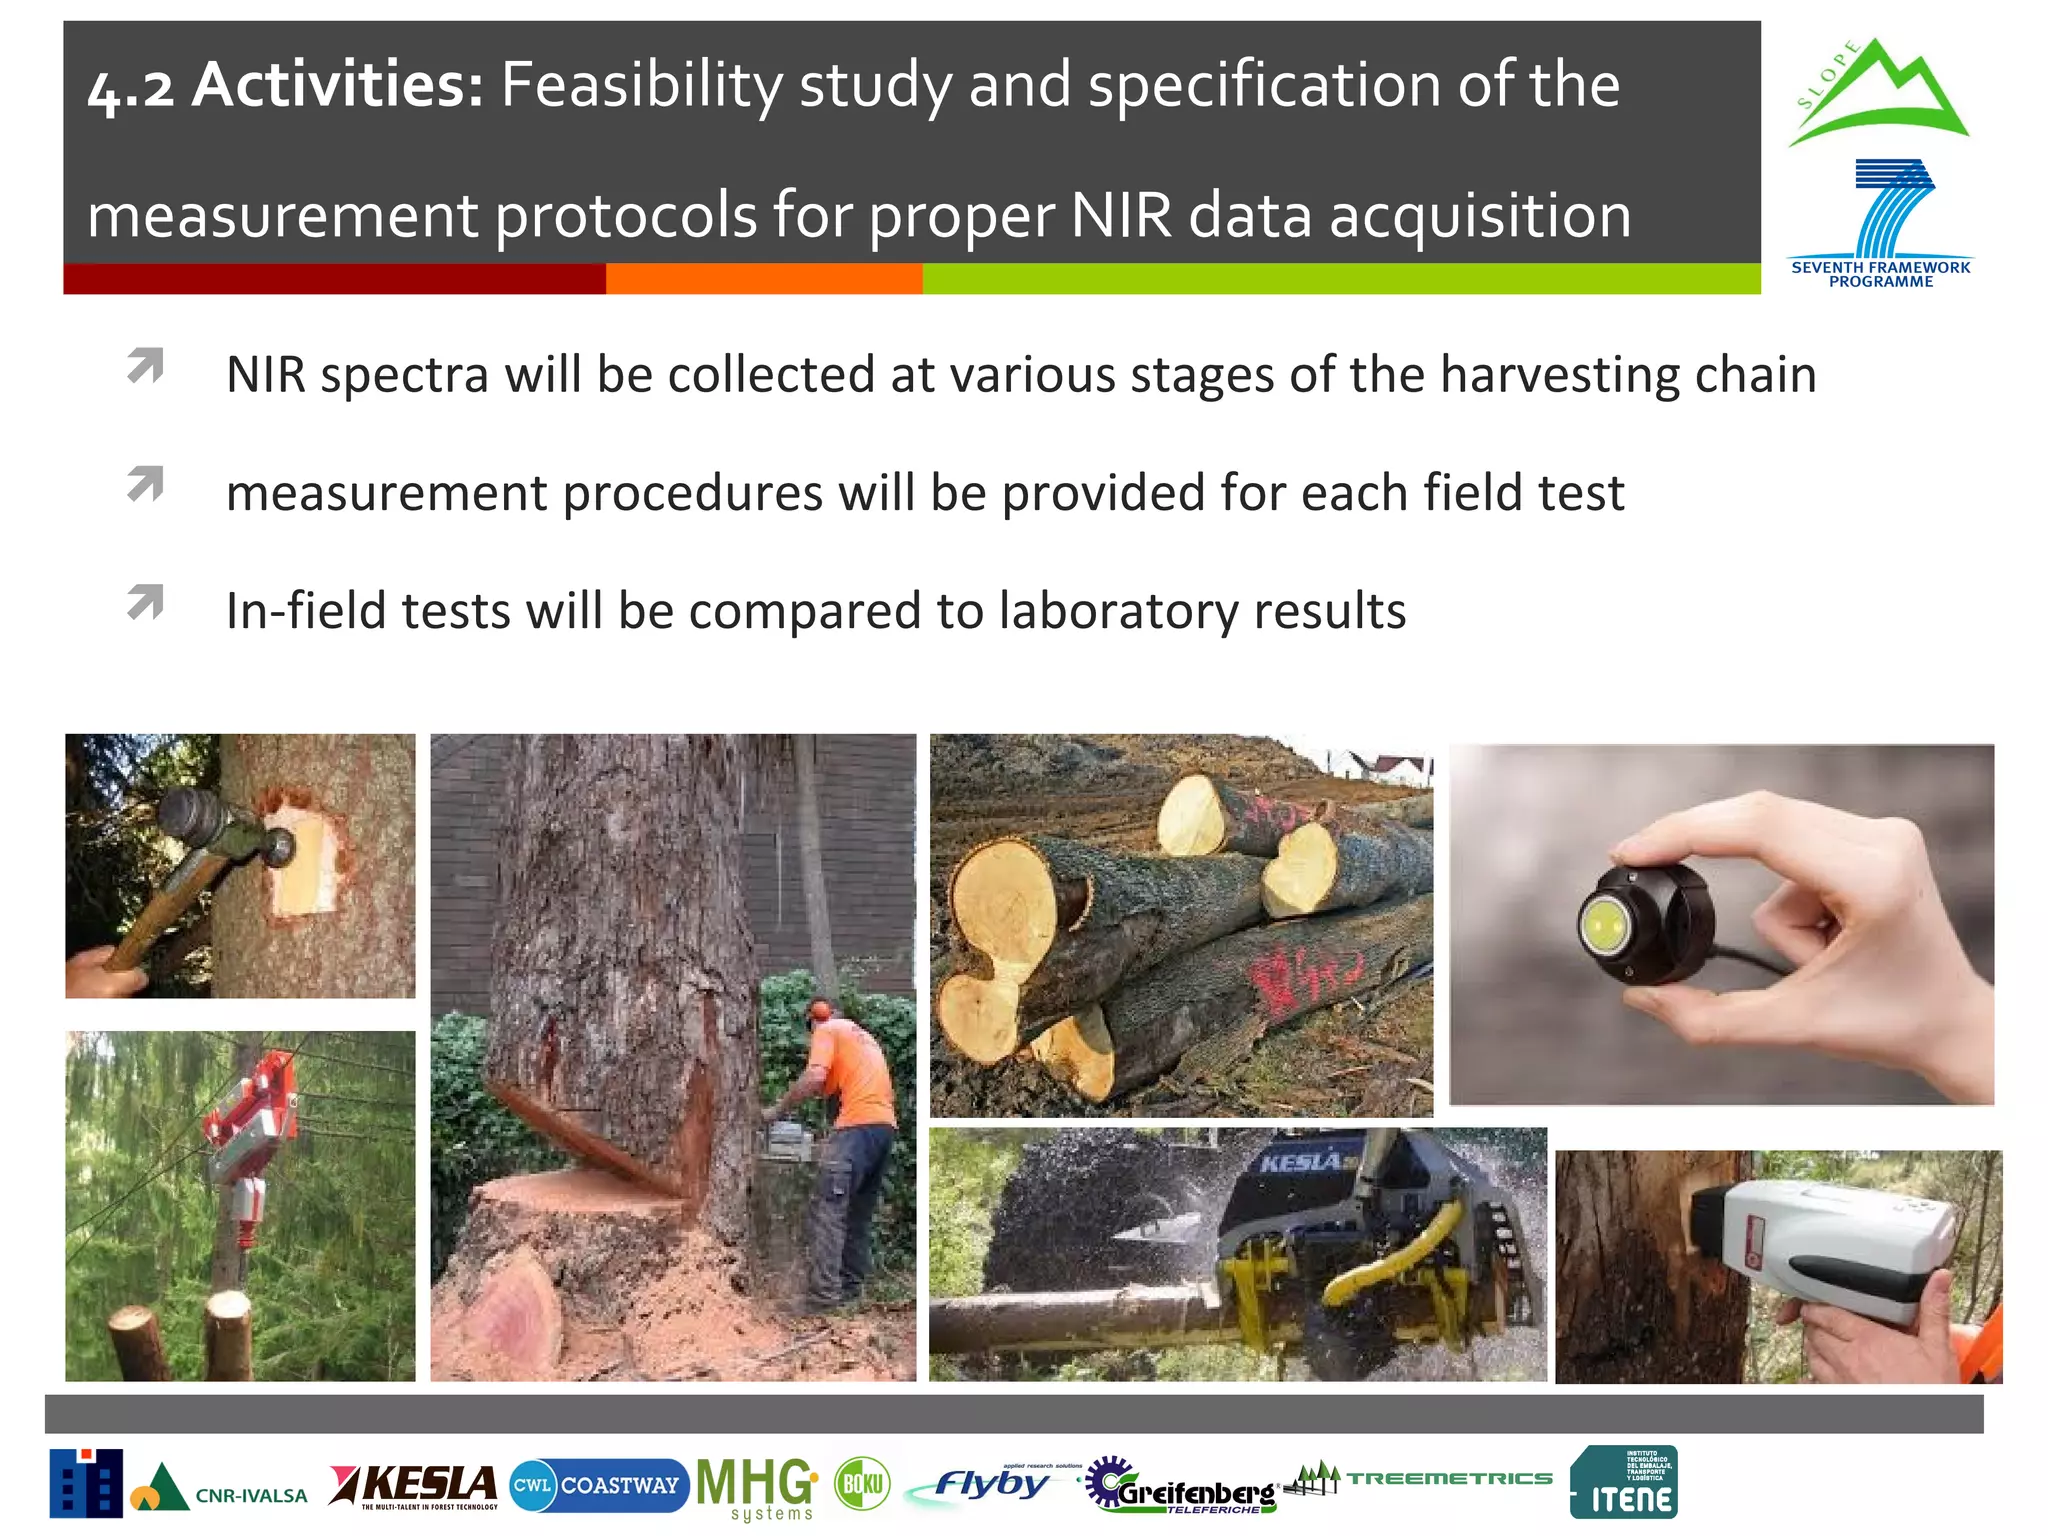
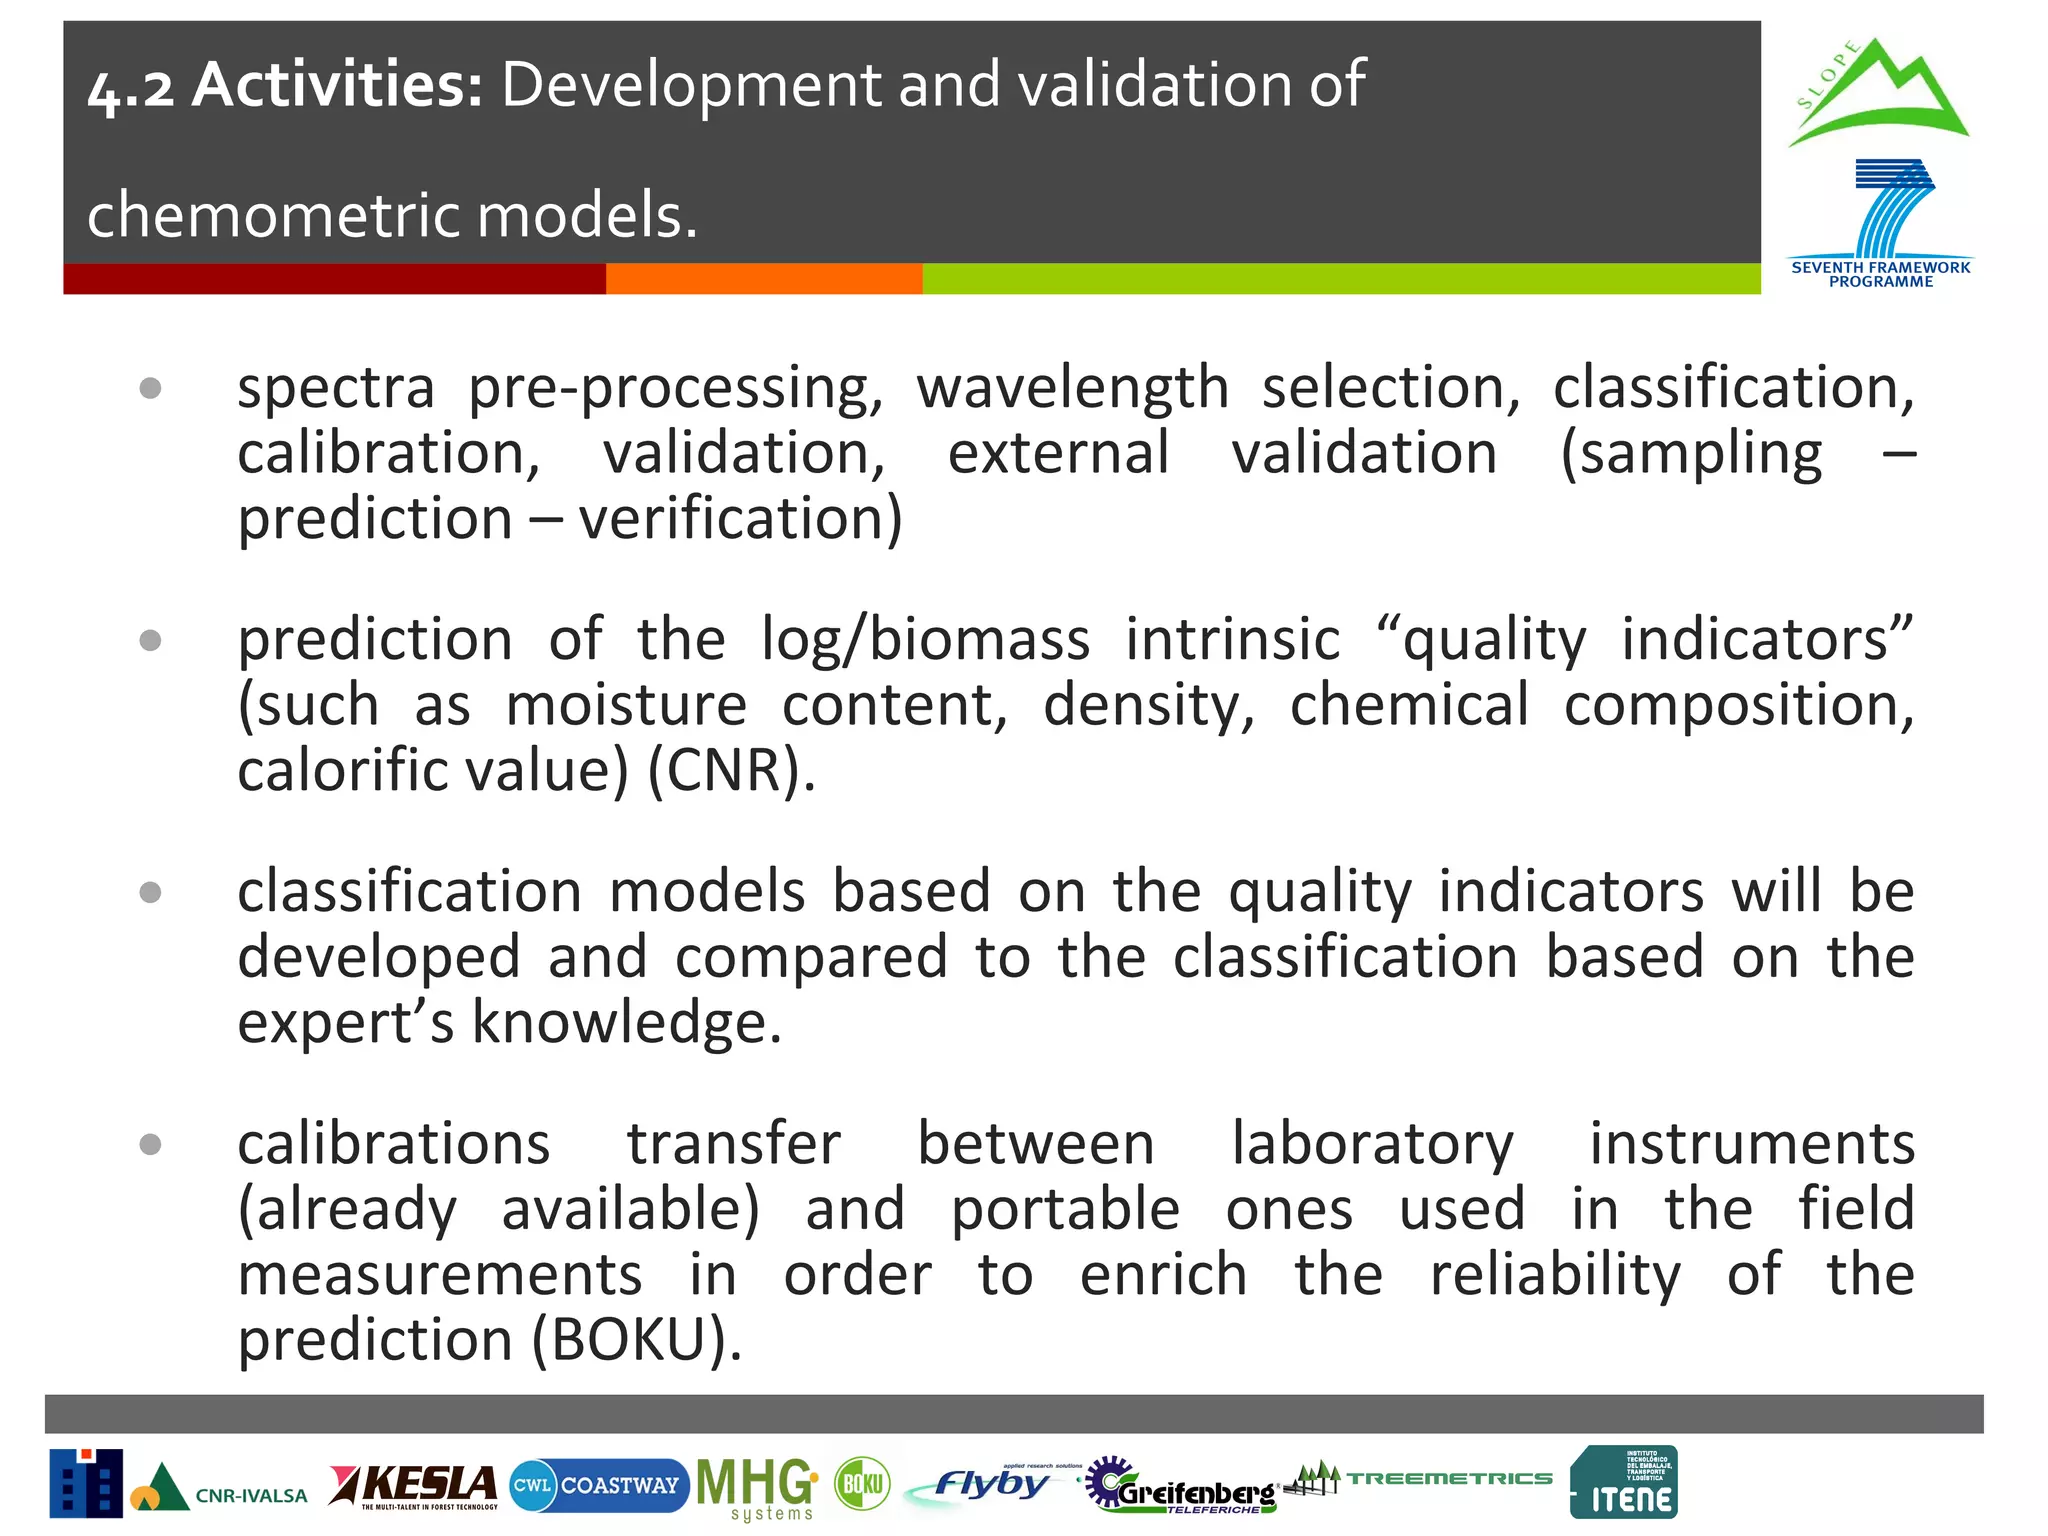
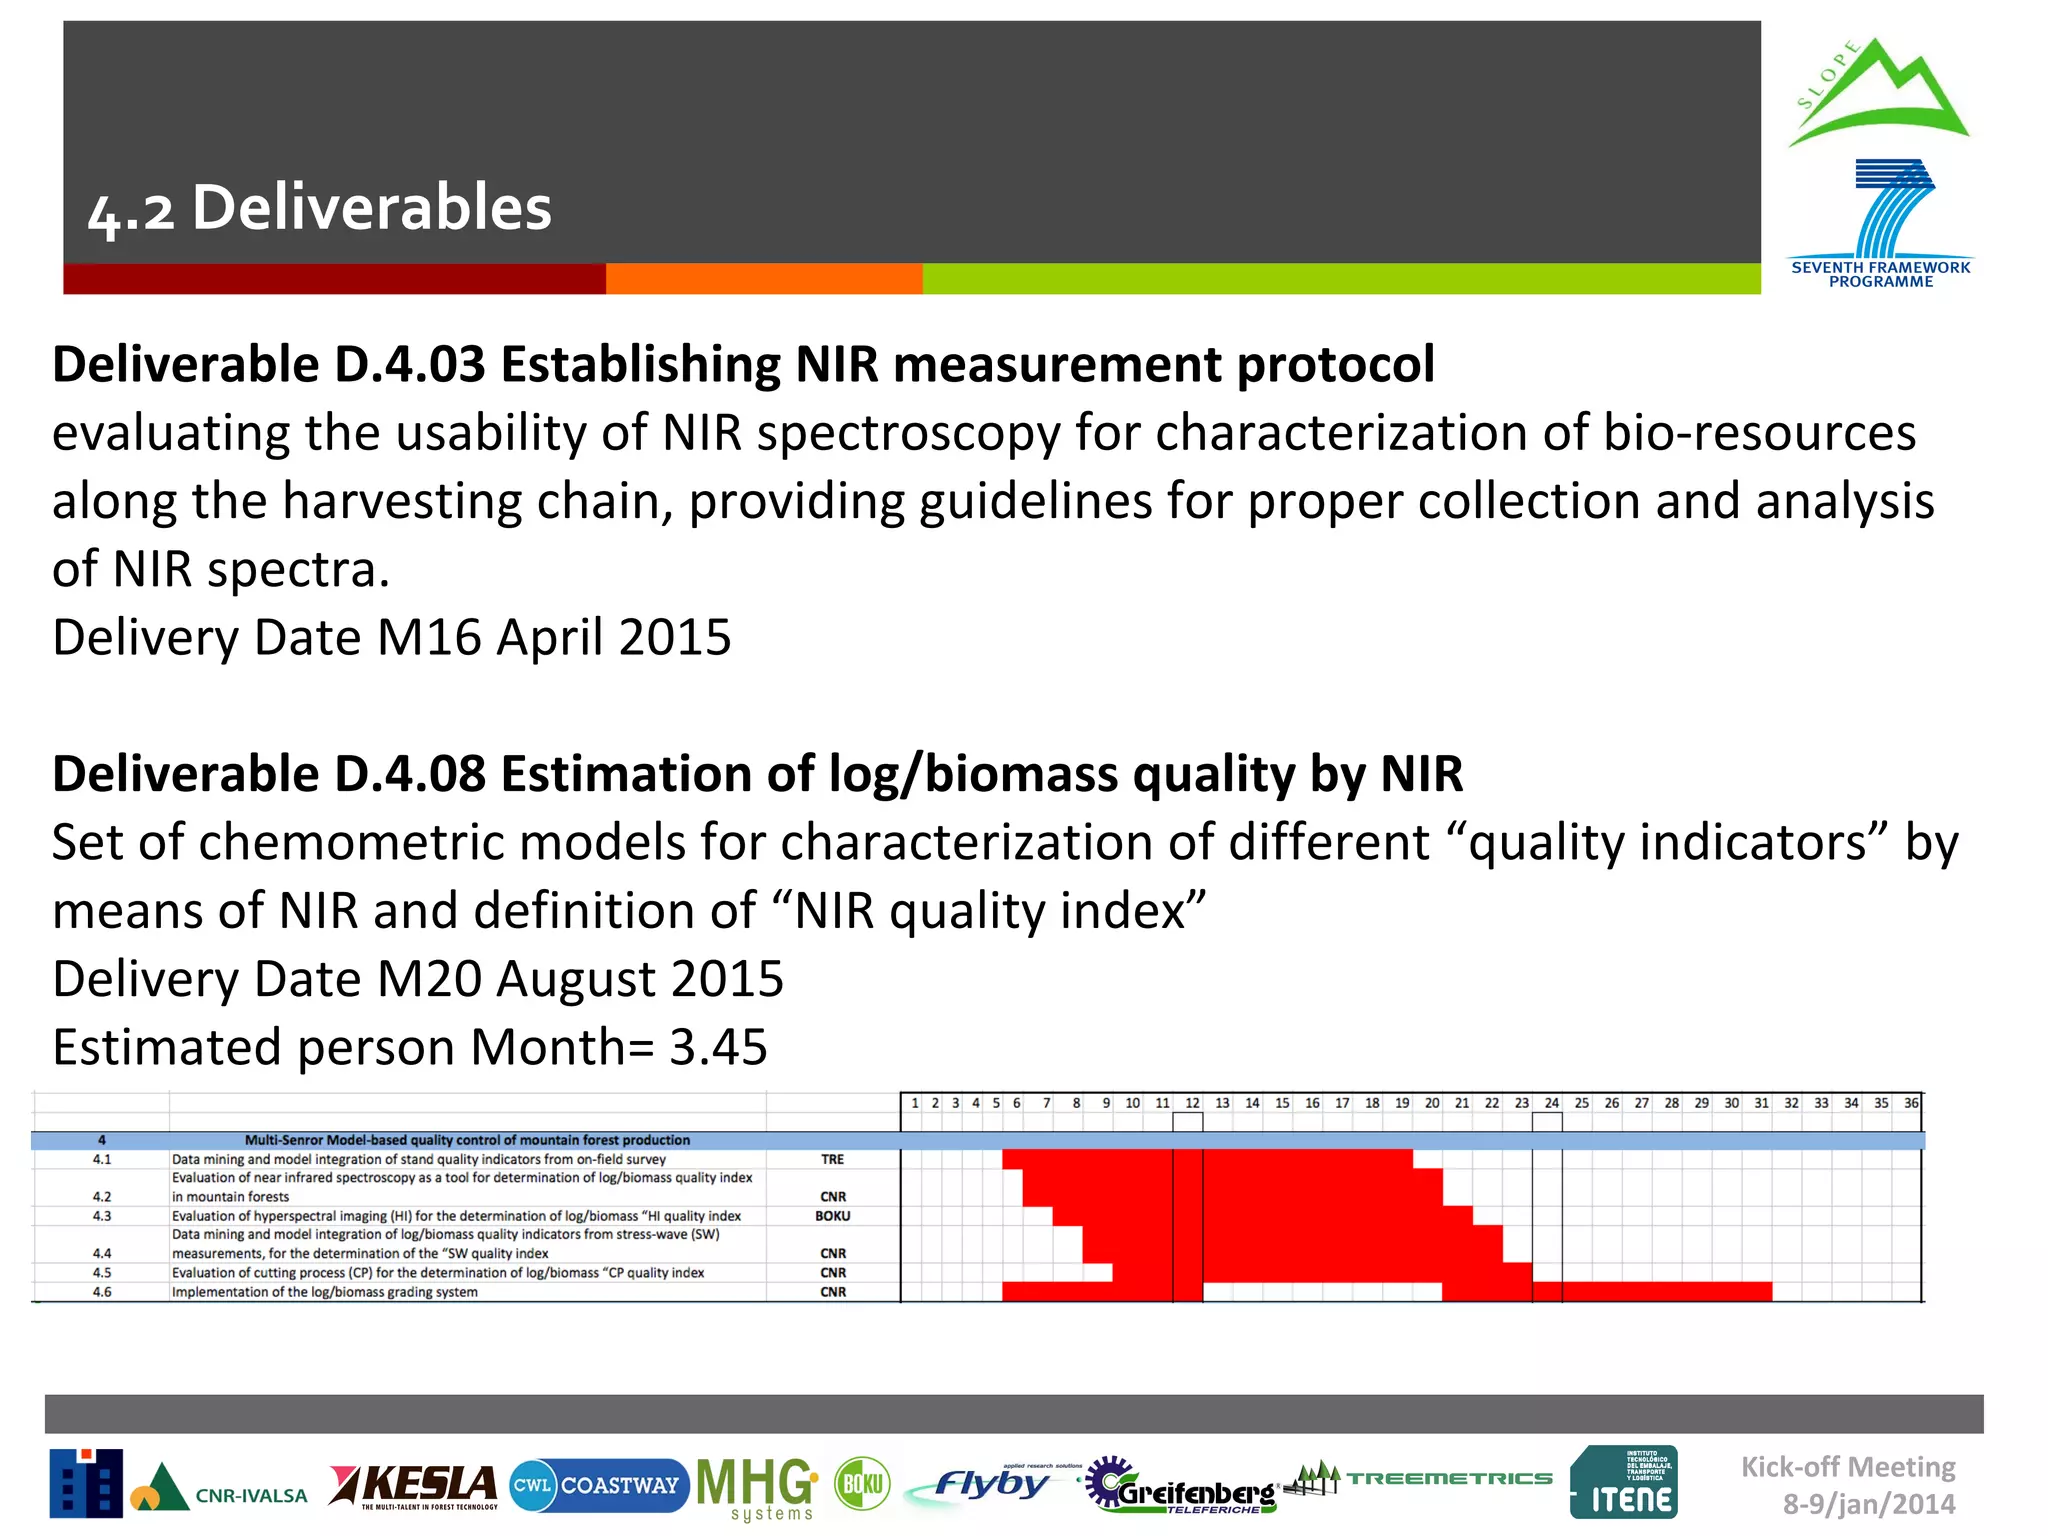
Task 4.2

Evaluation of near infrared (NIR) spectroscopy
as a tool for determination of log/biomass
quality index in mountain forests
Task 4.2: Partners involvement
Task Leader: CNR
Task Partecipants: KESLA, BOKU, FLY, GRE
CNR: Project leader,
•will coordinate all the partecipants of this task
•will evaluate the usability of NIR spectroscopy for characterization of bioresources along the harvesting chain
•will provide guidelines for proper collection and analysis of NIR spectra
•will develop the “NIR quality index”; to be involved in the overall log and
biomass quality grading
Boku: will support CNR with laboratory measurement and calibration transfer
Kesla, Greifenberg and Flyby: will support CNR in order to collect NIR spectra at
various stages of the harvesting chain
4.2 Objectives

 evaluating the usability of NIR spectroscopy for

characterization of bio-resources along the
harvesting chain

 providing guidelines for proper collection and

analysis of NIR spectra

 The raw information provided here are near infrared

spectra, to be later used for the determination of
several properties (quality indicators) of the sample
Electromagnetic spectrum
1μm

10μm
mid
infrared
MIR

near
infrared
NIR

100μm
far
infrared
FIR

frequency, ν (Hz)
10

24

10

22

10

20

10

γ
rays
10-16

10-14

18

10

x
rays
10-12

10-10

16

10

14

10

12

IR

UV

10

10

10

8

10

10-6

10-4

10-2

10

radio
waves

mikrowave

FM
10-8

6

100

4

102

100

long radio waves

AM
102

104

106
108
wavelength, λ (m)

visible light

400nm

500nm

600nm

700nm

The study of the interactions between electromagnetic radiation (energy, light) and matter
Kick-off Meeting
8-9/jan/2014
Source of spectra
simmetric
stretching

Rocking

asimmetric
stretching

Wagging

Scissoring

Twisting

Spectra represents molecular vibrations of chemical molecules
exposed to infrared light.
http://en.wikipedia.org/wiki/Infrared_spectroscopy
NIR technique




No need special sample preparation
Non-destructive testing
Relatively fast measurement
No residues/solvents to waste
Possibility for determination of many components
simultaneously
High degree of precision and accuracy
Direct measurement with very low cost






Overlapping of spectral peaks
Needs sophisticated statistics methods for data analysis
Moisture sensitive
Calibration transfer from lab equipment into field equipment






Spectrofotometers
How it works?

+
spectra

reference data
calibration (PLS)
cellulose

celuloza estymacja (%)

predicted stress (MPa)

40

30

20

r = 98,67
RMSECV = 0,102
RPD = 8,86

45,5

29

3

50

density

0,7

2

r2 = 84,98
RMSECV = 0,0638
RPD = 2,58

2

R = 0.984

lignin

30

gęstość estymacja (g/cm )

46

lignina estymacja (%)

Tensile strength

60

28

27

r2 = 64,94
RMSECV = 0,039
RPD = 1,69

0,6

0,5

0,4

10

26

45

0
0

10

20
30
40
reference stress (MPa)

50

60

45

45,5
celuloza referencja (%)

46

0,3
26

27

28

29

lignina referencja (%)

30

0,3

0,4

0,5

0,6
3

gęstość referencja (g/cm )

0,7
Identity test

Model sample1

Model sample2
???
sample

Model sample3

Model samplen

HQ1

HQ2

HQ3

HQn

> treshold1

< treshold2

> treshold3

> tresholdn

Compare the unknown spectrum with all reference spectra, the result of comparison between
two spectra is the spectral distance called hit quality. The better spectra match the
smaller is spectral distance; HQ for identical spectra is 0
4.2 Activities: Feasibility study and specification of the
measurement protocols for proper NIR data acquisition


NIR spectra will be collected at various stages of the harvesting chain



measurement procedures will be provided for each field test



In-field tests will be compared to laboratory results
4.2 Activities: Development and validation of
chemometric models.
•

spectra pre-processing, wavelength selection, classification,
calibration, validation, external validation (sampling –
prediction – verification)

•

prediction of the log/biomass intrinsic “quality indicators”
(such as moisture content, density, chemical composition,
calorific value) (CNR).

•

classification models based on the quality indicators will be
developed and compared to the classification based on the
expert’s knowledge.

•

calibrations transfer between laboratory instruments
(already available) and portable ones used in the field
measurements in order to enrich the reliability of the
prediction (BOKU).
4.2 Deliverables
Deliverable D.4.03 Establishing NIR measurement protocol
evaluating the usability of NIR spectroscopy for characterization of bio-resources
along the harvesting chain, providing guidelines for proper collection and analysis
of NIR spectra.
Delivery Date M16 April 2015
Deliverable D.4.08 Estimation of log/biomass quality by NIR
Set of chemometric models for characterization of different “quality indicators” by
means of NIR and definition of “NIR quality index”
Delivery Date M20 August 2015
Estimated person Month= 3.45

Kick-off Meeting
8-9/jan/2014
4.2 Additional deliverable

 Development of “provenance models”. The set of

spectra collected from selected samples (of known
provenance and silvicultural characteristics) along the
supply chain will be also processed in order to verify
applicability of NIR spectroscopy to traceability of
wood (CNR).
Wood provenance & NIRS
2163 trees of Norway spruce
from 75 location
in 14 European countries
2163 samples measured
x 5 spectra/sample
= 10815

spectra
Wood provenance & NIRS
NIR workshop

Evaluation of near infrared (NIR) spectroscopy as a tool for determination of log/biomass quality index in mountain forests (by CNR)

  • 1.
    Task 4.2 Evaluation ofnear infrared (NIR) spectroscopy as a tool for determination of log/biomass quality index in mountain forests
  • 2.
    Task 4.2: Partnersinvolvement Task Leader: CNR Task Partecipants: KESLA, BOKU, FLY, GRE CNR: Project leader, •will coordinate all the partecipants of this task •will evaluate the usability of NIR spectroscopy for characterization of bioresources along the harvesting chain •will provide guidelines for proper collection and analysis of NIR spectra •will develop the “NIR quality index”; to be involved in the overall log and biomass quality grading Boku: will support CNR with laboratory measurement and calibration transfer Kesla, Greifenberg and Flyby: will support CNR in order to collect NIR spectra at various stages of the harvesting chain
  • 3.
    4.2 Objectives  evaluatingthe usability of NIR spectroscopy for characterization of bio-resources along the harvesting chain  providing guidelines for proper collection and analysis of NIR spectra  The raw information provided here are near infrared spectra, to be later used for the determination of several properties (quality indicators) of the sample
  • 4.
    Electromagnetic spectrum 1μm 10μm mid infrared MIR near infrared NIR 100μm far infrared FIR frequency, ν(Hz) 10 24 10 22 10 20 10 γ rays 10-16 10-14 18 10 x rays 10-12 10-10 16 10 14 10 12 IR UV 10 10 10 8 10 10-6 10-4 10-2 10 radio waves mikrowave FM 10-8 6 100 4 102 100 long radio waves AM 102 104 106 108 wavelength, λ (m) visible light 400nm 500nm 600nm 700nm The study of the interactions between electromagnetic radiation (energy, light) and matter Kick-off Meeting 8-9/jan/2014
  • 5.
    Source of spectra simmetric stretching Rocking asimmetric stretching Wagging Scissoring Twisting Spectrarepresents molecular vibrations of chemical molecules exposed to infrared light. http://en.wikipedia.org/wiki/Infrared_spectroscopy
  • 6.
    NIR technique   No needspecial sample preparation Non-destructive testing Relatively fast measurement No residues/solvents to waste Possibility for determination of many components simultaneously High degree of precision and accuracy Direct measurement with very low cost     Overlapping of spectral peaks Needs sophisticated statistics methods for data analysis Moisture sensitive Calibration transfer from lab equipment into field equipment     
  • 7.
  • 8.
    How it works? + spectra referencedata calibration (PLS) cellulose celuloza estymacja (%) predicted stress (MPa) 40 30 20 r = 98,67 RMSECV = 0,102 RPD = 8,86 45,5 29 3 50 density 0,7 2 r2 = 84,98 RMSECV = 0,0638 RPD = 2,58 2 R = 0.984 lignin 30 gęstość estymacja (g/cm ) 46 lignina estymacja (%) Tensile strength 60 28 27 r2 = 64,94 RMSECV = 0,039 RPD = 1,69 0,6 0,5 0,4 10 26 45 0 0 10 20 30 40 reference stress (MPa) 50 60 45 45,5 celuloza referencja (%) 46 0,3 26 27 28 29 lignina referencja (%) 30 0,3 0,4 0,5 0,6 3 gęstość referencja (g/cm ) 0,7
  • 9.
    Identity test Model sample1 Modelsample2 ??? sample Model sample3 Model samplen HQ1 HQ2 HQ3 HQn > treshold1 < treshold2 > treshold3 > tresholdn Compare the unknown spectrum with all reference spectra, the result of comparison between two spectra is the spectral distance called hit quality. The better spectra match the smaller is spectral distance; HQ for identical spectra is 0
  • 10.
    4.2 Activities: Feasibilitystudy and specification of the measurement protocols for proper NIR data acquisition  NIR spectra will be collected at various stages of the harvesting chain  measurement procedures will be provided for each field test  In-field tests will be compared to laboratory results
  • 11.
    4.2 Activities: Developmentand validation of chemometric models. • spectra pre-processing, wavelength selection, classification, calibration, validation, external validation (sampling – prediction – verification) • prediction of the log/biomass intrinsic “quality indicators” (such as moisture content, density, chemical composition, calorific value) (CNR). • classification models based on the quality indicators will be developed and compared to the classification based on the expert’s knowledge. • calibrations transfer between laboratory instruments (already available) and portable ones used in the field measurements in order to enrich the reliability of the prediction (BOKU).
  • 12.
    4.2 Deliverables Deliverable D.4.03Establishing NIR measurement protocol evaluating the usability of NIR spectroscopy for characterization of bio-resources along the harvesting chain, providing guidelines for proper collection and analysis of NIR spectra. Delivery Date M16 April 2015 Deliverable D.4.08 Estimation of log/biomass quality by NIR Set of chemometric models for characterization of different “quality indicators” by means of NIR and definition of “NIR quality index” Delivery Date M20 August 2015 Estimated person Month= 3.45 Kick-off Meeting 8-9/jan/2014
  • 13.
    4.2 Additional deliverable Development of “provenance models”. The set of spectra collected from selected samples (of known provenance and silvicultural characteristics) along the supply chain will be also processed in order to verify applicability of NIR spectroscopy to traceability of wood (CNR).
  • 14.
    Wood provenance &NIRS 2163 trees of Norway spruce from 75 location in 14 European countries 2163 samples measured x 5 spectra/sample = 10815 spectra
  • 15.
  • 16.