Download as PDF, PPTX
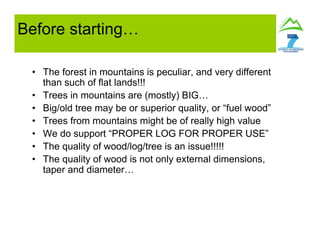
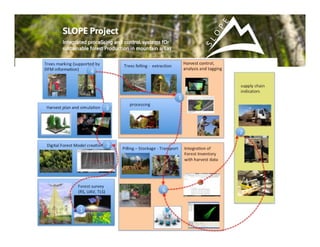
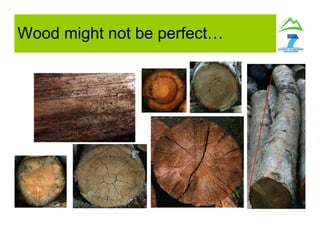
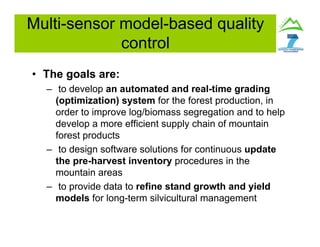


The document outlines a study on using NIR spectroscopy for assessing the quality of logs and biomass in mountainous forests. It emphasizes the need for an automated grading system to improve log segregation and enhance supply chain efficiency for forest products. The research aims to integrate various diagnostic techniques and data analysis for a more reliable evaluation of wood properties throughout the harvesting process.


