Downloaded 37 times


![References
[1] R. A. Viscarra Rossel, D. J. J. Walvoort, A. B. McBratney, L. J. Janik, and J. O. Skjemstad, “Visible,
near infrared, mid infrared or combined diffuse reflectance spectroscopy for simultaneous
assessment of various soil properties”, Geoderma, Vol. 131, No. 1–2, pp. 59–75, 2006.
[2] Y. Qiao and S. Zhang, “Near-infrared spectroscopy technology for soil nutrients detection based
on LS-SVM”, IFIP Advances in Information and Communication Technology, Vol. 368, pp. 325–335,
2012.
[3] D. F. Malley, L. Yesmin, D. Wray, and S. Edwards, “Application of near-infrared spectroscopy in
analysis of soil mineral nutrients”, Communication in Soil Scence and Plant Anaysis, Vol. 30, No.
7–8, pp. 999–1012, 1999.
[4] S. Borchert, J. Henck, and H. Siesler, “Near-Infrared-Spectroscopic Investigations of Solid
Pharmaceutical Formulations”, Camo.Com, pp. 3–7, 2003.
[5] B. Stenberg, R. V Rossel, M. Mouazen, and J. Wetterlind, “Visible and Near Infrared Spectroscopy
in Soil Science”, Advances in Agronomy. Vol 107, No. 10, pp. 163–215, 2010.
[6] X. Shao, M. Zhang, and W. Cai, “Multivariate calibration of near-infrared spectra by using
influential variables”, Analtical Methods, Vol. 4, No. 2, p. 467, Feb. 2012.
[7] D. Bertrand and C. N. G. Scotter, “Application of Multivariate Analyses to NIR Spectra of
Gelatinized Starch”, Applied Spectroscopy, Vol. 46, No. 9, pp. 1420–1425, 1992.
4/24/2017 20](https://image.slidesharecdn.com/opticalsensingofsoilmacronutrient-170424084156/85/Optical-sensing-of-soil-macronutrient-20-320.jpg)
![References
[8] M. Urbano-Cuadrado, M. D. Luque De Castro, P. M. Pérez-Juan, J. García-Olmo, and M. A.
Gómez-Nieto, “Near infrared reflectance spectroscopy and multivariate analysis in enology:
Determination or screening of fifteen parameters in different types of wines”, Analytica
Chimica Acta, Vol. 527, No. 1, pp. 81–88, 2004.
[9] K. Wiesner, K. Fuchs, A. M. Gigler, and R. Pastusiak, “Trends in near infrared spectroscopy and
multivariate data analysis from an industrial perspective”, Procedia Engineering, Vol. 87, pp.
867–870, 2014.
[10]P. R. G. Hein, “Multivariate regression methods for estimating basic density in Eucalyptus
wood from near infrared spectroscopic data”, Cerne, Vol. 16, No. 3, pp. 90–96, 2010.
[11]V. Baeten and P. Dardenne, “Spectroscopy: Developments in instrumentation and analysis”,
Grasas y Aceites, Vol. 53, No. 1, pp. 45–63, 2002.
[12]C. Pasquini, “Near Infrared Spectroscopy: fundamentals, practical aspects and analytical
applications”, Journal of the Brazilian Chemical Society, Vol. 14, No. 2, pp. 198–219, 2003.
[13]N. A. O’Brien, C. A. Hulse, D. M. Friedrich, F. J. Van Milligen, M. K. von Gunten, F. Pfeifer, and
H. W. Siesler, “Miniature near-infrared (NIR) spectrometer engine for handheld applications”,
in SPIE Defense, Security, and Sensing, Vol. 8374 , 2012.
[14]D. M. Friedrich, C. A. Hulse, M. Von Gunten, E. P. Williamson, C. G. Pederson, N. A. O. Brien, J.
Corporation, and S. Rosa, “Miniature near-infrared spectrometer for point-of-use chemical
analysis”, SPIE proceedings Vol. 8992, 2014.
4/24/2017 21](https://image.slidesharecdn.com/opticalsensingofsoilmacronutrient-170424084156/85/Optical-sensing-of-soil-macronutrient-21-320.jpg)


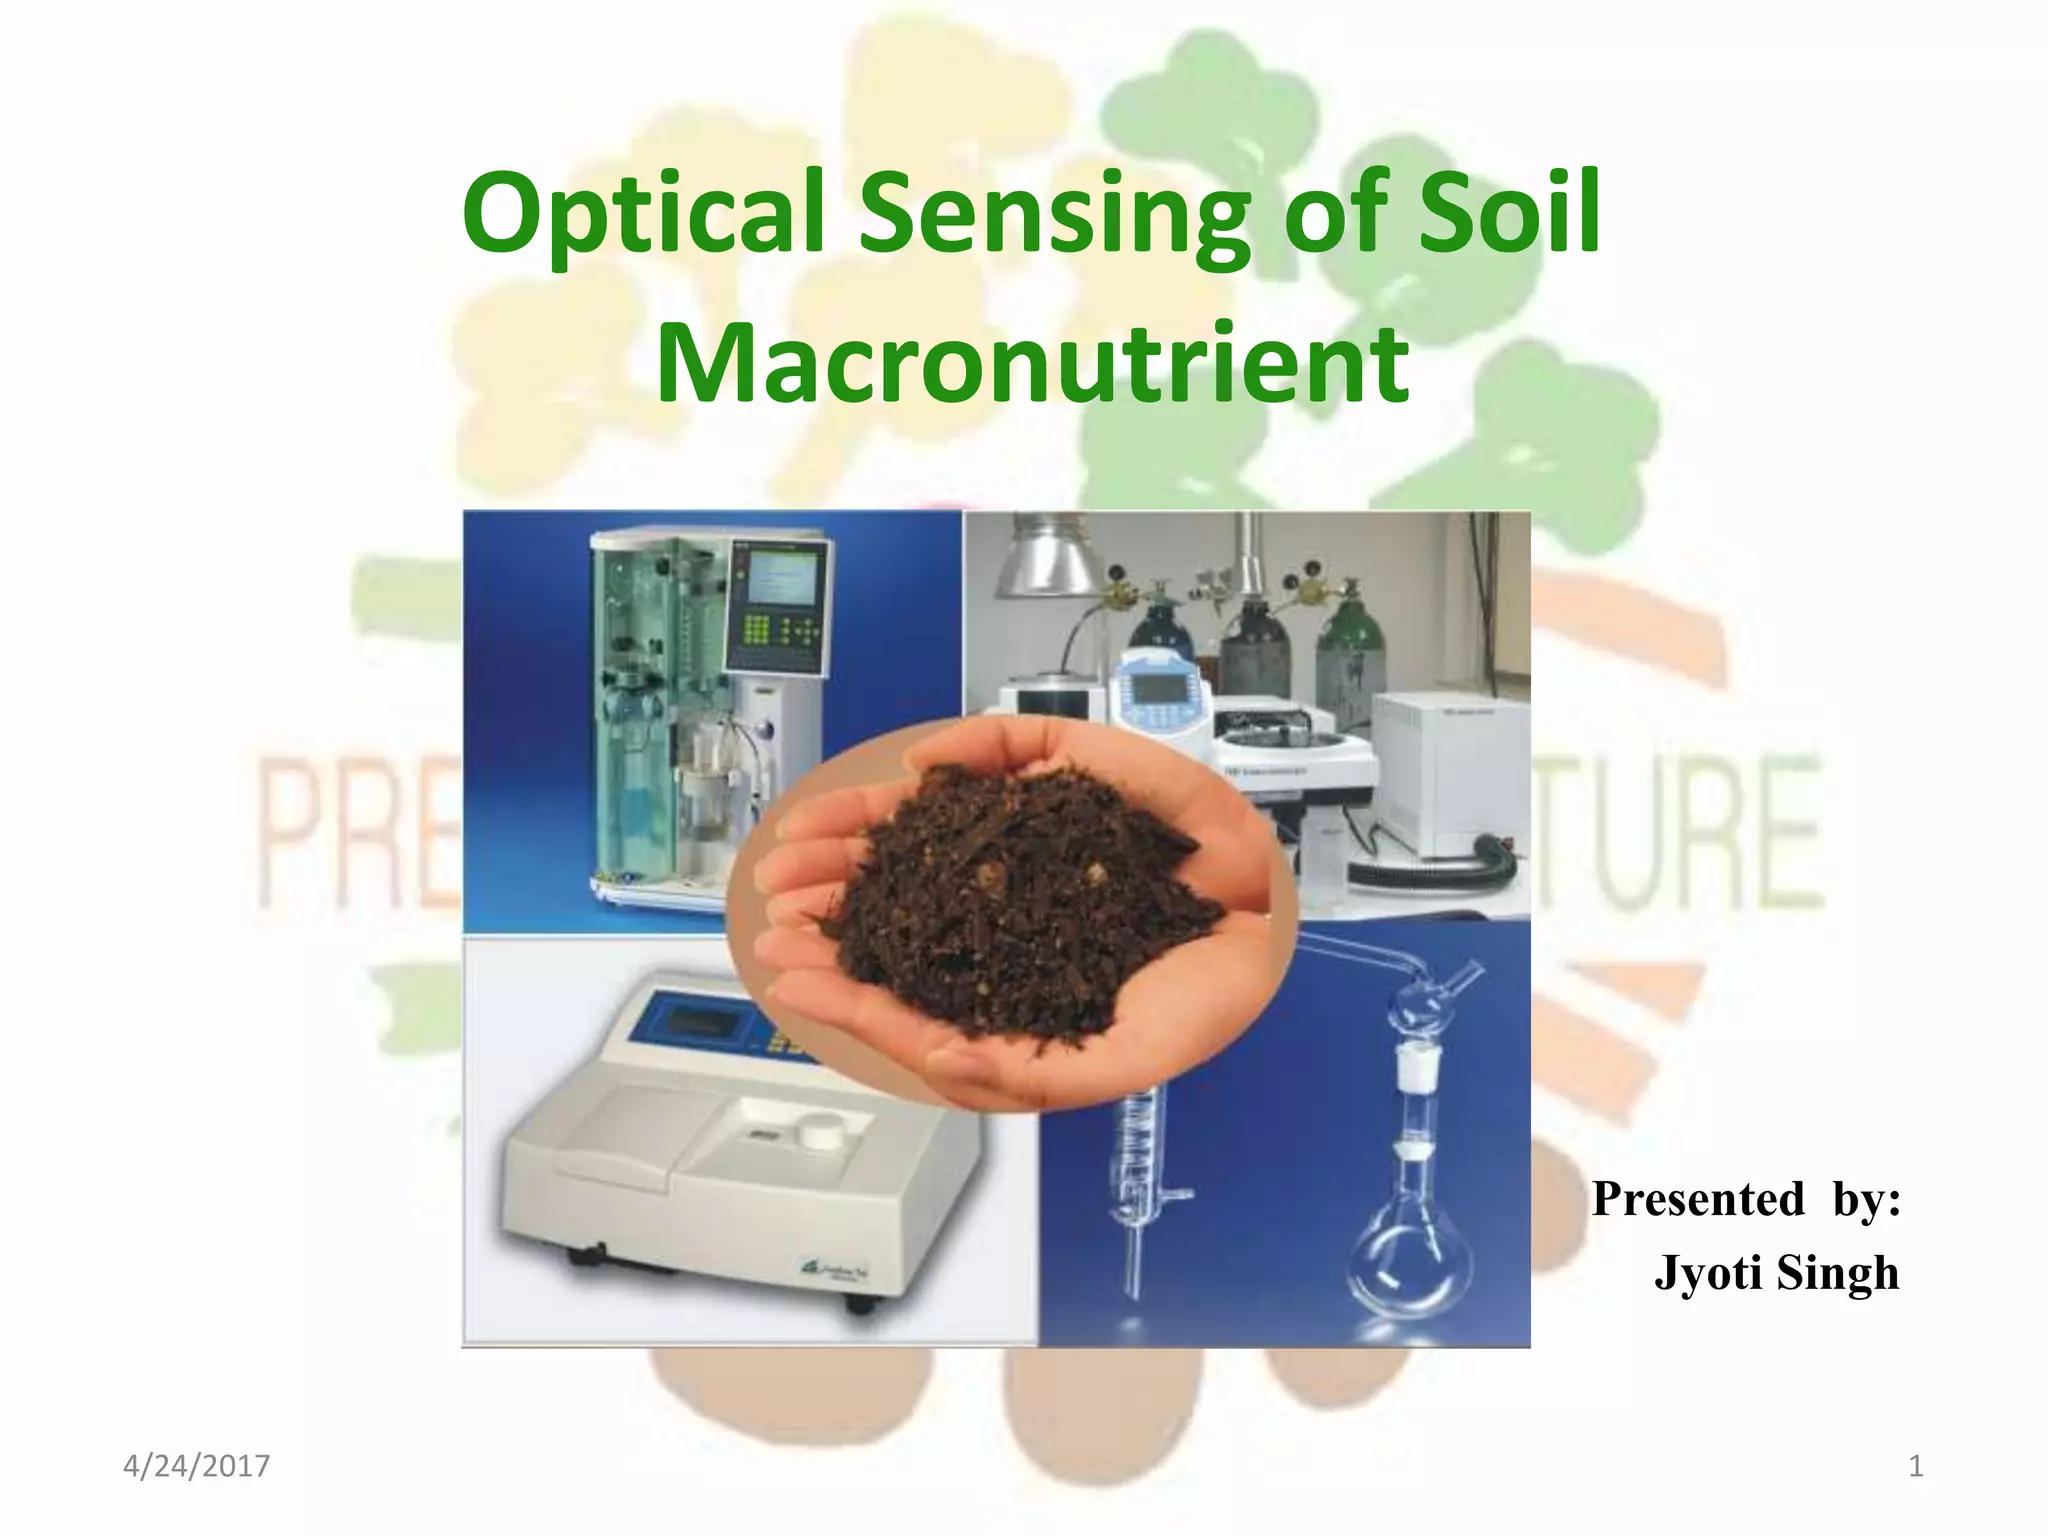
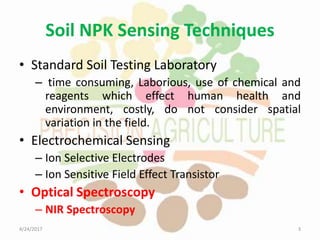
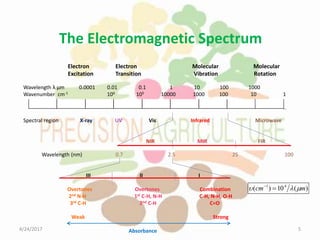
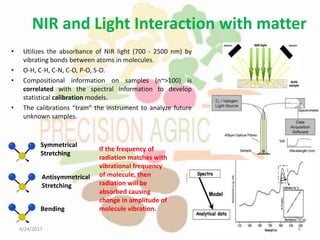
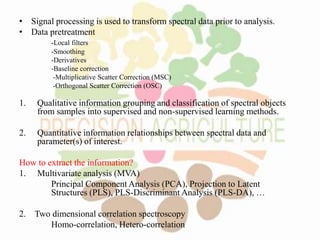
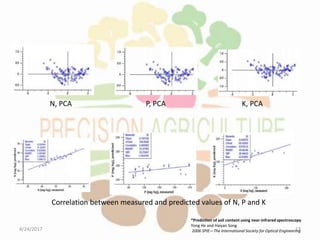
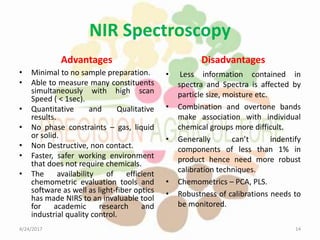
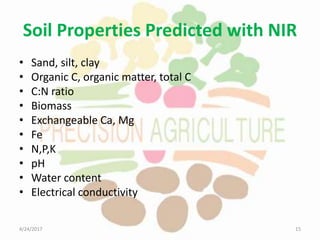
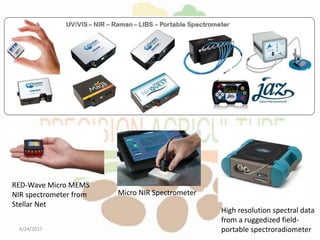
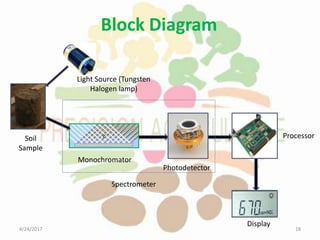
The document discusses optical sensing techniques for soil macronutrients, highlighting the limitations of traditional laboratory methods and field measurements due to soil variability. It emphasizes the advantages of near-infrared (NIR) spectroscopy in assessing soil properties like moisture and nutrient content with minimal preparation and non-destructive analysis. Additionally, the document outlines challenges and chemometric methods used for analyzing spectral data to improve soil nutrient predictions.


