QNBFS Weekly Market Report March 21, 2019
•
1 like•107 views

The Qatar Stock Exchange (QSE) Index decreased by 16.83 points or 0.17% during the trading week to close at 9,953.72

Recommended
Recommended
More Related Content
What's hot
What's hot (20)
Similar to QNBFS Weekly Market Report March 21, 2019
Similar to QNBFS Weekly Market Report March 21, 2019 (20)
More from QNB Group
More from QNB Group (20)
Recently uploaded
Recently uploaded (20)
QNBFS Weekly Market Report March 21, 2019
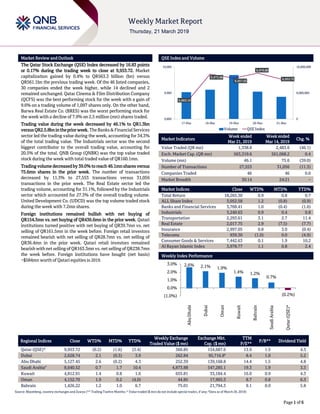
- 1. ` Page 1 of 6 Market Review and Outlook QSE Index and Volume The Qatar Stock Exchange (QSE) Index decreased by 16.83 points or 0.17% during the trading week to close at 9,953.72. Market capitalization gained by 0.4% to QR563.3 billion (bn) versus QR561.1bn the previous trading week. Of the 46 listed companies, 30 companies ended the week higher, while 14 declined and 2 remained unchanged. Qatar Cinema & Film Distribution Company (QCFS) was the best performing stock for the week with a gain of 9.6% on a trading volume of 1,097 shares only. On the other hand, Barwa Real Estate Co. (BRES) was the worst performing stock for the week with a decline of 7.9% on 2.5 million (mn) shares traded. Trading value during the week decreased by 46.1% to QR1.3bn versus QR2.5.8bninthepriorweek. TheBanks&FinancialServices sector led the trading value during the week, accounting for 34.3% of the total trading value. The Industrials sector was the second biggest contributor to the overall trading value, accounting for 20.5% of the total. QNB Group (QNBK) was the top value traded stock during the week with total traded value of QR160.1mn. Trading volume decreased by 39.0% to reach 46.1mnshares versus 75.6mn shares in the prior week. The number of transactions decreased by 11.3% to 27,553 transactions versus 31,056 transactions in the prior week. The Real Estate sector led the trading volume, accounting for 31.1%, followed by the Industrials sector which accounted for 27.3% of the overall trading volume. United Development Co. (UDCD) was the top volume traded stock during the week with 7.2mn shares. Foreign institutions remained bullish with net buying of QR154.3mn vs. net buying of QR436.6mn in the prior week. Qatari institutions turned positive with net buying of QR39.7mn vs. net selling of QR161.5mn in the week before. Foreign retail investors remained bearish with net selling of QR28.7mn vs. net selling of QR36.4mn in the prior week. Qatari retail investors remained bearishwithnetselling of QR163.3mn vs. netselling of QR238.7mn the week before. Foreign institutions have bought (net basis) ~$584mn worth of Qatari equities in 2019. Market Indicators Week ended Mar 21, 2019 Week ended Mar 14, 2019 Chg. % Value Traded (QR mn) 1,338.8 2,483.6 (46.1) Exch. Market Cap. (QR mn) 563,319.6 561,068.2 0.4 Volume (mn) 46.1 75.6 (39.0) Number of Transactions 27,553 31,056 (11.3) Companies Traded 46 46 0.0 Market Breadth 30:14 24:21 – Market Indices Close WTD% MTD% YTD% Total Return 18,265.30 0.9 0.8 0.7 ALL Share Index 3,052.58 1.2 (0.8) (0.9) Banks and Financial Services 3,768.41 1.0 (0.4) (1.6) Industrials 3,240.63 0.9 0.4 0.8 Transportation 2,293.61 3.1 2.7 11.4 Real Estate 2,017.75 2.9 (7.5) (7.7) Insurance 2,997.05 0.8 3.0 (0.4) Telecoms 939.30 (1.0) 0.0 (4.9) Consumer Goods & Services 7,442.63 0.1 1.9 10.2 Al Rayan Islamic Index 3,978.77 1.1 0.8 2.4 Market Indices Weekly Index Performance Regional Indices Close WTD% MTD% YTD% Weekly Exchange Traded Value ($ mn) Exchange Mkt. Cap. ($ mn) TTM P/E** P/B** Dividend Yield Qatar (QSE)* 9,953.72 (0.2) (1.6) (3.4) 366.85 154,687.6 13.9 1.5 4.3 Dubai 2,628.74 2.1 (0.3) 3.9 262.84 95,716.8# 8.4 1.0 5.2 Abu Dhabi 5,127.45 2.6 (0.2) 4.3 252.39 139,168.8 14.4 1.5 4.8 Saudi Arabia# 8,640.52 0.7 1.7 10.4 4,873.88 547,285.1 19.3 1.9 3.3 Kuwait 4,812.91 1.4 0.8 1.6 655.81 33,184.4 16.0 0.9 4.3 Oman 4,152.70 1.9 0.2 (4.0) 44.85 17,965.3 8.7 0.8 6.3 Bahrain 1,426.22 1.2 1.0 6.7 75.01 21,794.3 9.1 0.9 5.8 Source: Bloomberg, country exchanges and Zawya (** Trailing Twelve Months; * Value traded ($ mn) do not include special trades, if any; #Data as of March 20, 2019) 9,863.10 9,972.68 9,957.03 9,976.80 9,953.72 0 8,000,000 16,000,000 9,800 9,900 10,000 17-Mar 18-Mar 19-Mar 20-Mar 21-Mar Volume QSE Index 2.6% 2.1% 1.9% 1.4% 1.2% 0.7% (0.2%)(1.0%) 0.0% 1.0% 2.0% 3.0% AbuDhabi Dubai Oman Kuwait Bahrain SaudiArabia Qatar(QSE)*
- 2. Page 2 of 6 News Economic & Market News QIBK completes successful issuance of $750mn Sukuk – Qatar Islamic Bank (QIBK), rated ‘A1/A-/A’ (all ‘Stable’) by Moody’s/Standard & Poor's/Fitch, successfully priced $750mn five-year Sukuk at par with a profit rate of 3.982% (equivalent to a credit spread of 150bps over USD Mid-Swaps). The Sukuk was met with strong investor demand as evidenced by the large order-book which closed at $3.1bn, representing an oversubscription rate of 4.1 times. In terms of geography, 46% of the Sukuk was allocated to Asian investors, followed by Middle Eastern accounts (23%), Europe (21%) and US/other (10%). In total, non-Middle Eastern investors were allocated 77% of the Sukuk, which is a remarkable outcome and one of the highest international allocations achieved by any bank from the region. Of the total, 60% of the investors were fund managers, 26% were banks & private banks and 14% were insurance companies & agencies. More than 140 investors from 28 countries spanning Europe, Asia, US and the Middle East participated in the Sukuk. Barclays, Barwa Bank, Boubyan Bank, Crédit Agricole CIB, QInvest, QNB Capital and Standard Chartered Bank acted as joint lead managers & book-runners on this transaction, with Deutsche Bank as a co-manager. The $750mn Sukuk was a drawdown under QIBK's existing $4bn program and the Trust Certificates will be listed on the Irish Stock Exchange. (QSE) Fitch affirms QNB Group’s long-term IDR at ‘A+’ with ‘Stable’ outlook – QNB Group’s long-term Issuer Default Rating (IDR) was affirmed by Fitch Ratings (Fitch) at ‘A+’ with ‘Stable’ outlook. (Bloomberg) Fitch affirms Doha Bank’s long-term IDR at ‘A’ with ‘Stable’ outlook – Fitch Ratings (Fitch) affirmed Doha Bank’s Long- Term Issuer Default Rating (IDR) at ‘A’ with ‘Stable’ outlook and Viability Rating (VR) at ‘bb+’, the bank stated. Doha Bank’s IDRs, Support Rating (SR) and Support Rating Floor (SRF) reflect Fitch’s expectation of an extremely high probability of support from the Qatari authorities for domestic banks in case of need. This reflects the strong ability of Qatar to support its banks, as indicated by its rating (AA-/Stable), combined with Fitch’s belief of a strong willingness to support the banking sector and the bank. The latter is based on a strong track record of sovereign support to the banking sector including i) Between 2009 and 1Q2011, when some banks received capital injections to enhance their capital buffers and the government purchased some problem assets from the banks, and ii) During 2H2017, when the Qatari authorities placed significant deposits across the banks to support sector liquidity following the start of the blockade. Fitch stated, “Doha Bank’s SRF is at the Qatari bank’s domestic systemically important bank (D-SIB) SRF of ‘A’, and is not differentiated by franchise or level of government ownership because we see an extremely high probability thatall rated Qatari banks would receive support should they require it. (Qatar Tribune) Fitch affirms QIIK’s ratings at 'A', outlook 'Stable' – Qatar International Islamic Bank (QIIK) announced that Fitch Ratings (Fitch) affirmed the bank’s rating at ‘A’ with ‘Stable’ outlook, which ‘attests the bank's strong financial position and its consistency with the high indicators achieved by various economic sectors in Qatar.’ Fitch pointed out that QIIK’s rating at this high level is certainly due to various factors, the first of which is the high sovereign credit rating of the Qatari economy and the ability of the Qatari government to provide support to banks when needed, as it previously did when the government showed strong commitment towards banks and public sector companies, supported by large sovereign revenues and reserves. (Gulf-Times.com) Fitch affirms KCBK’s IDR at 'A', outlook 'Stable' – Fitch Ratings has affirmed Al Khalij Commercial Bank’s (KCBK) Long-Term Issuer Default Rating (IDR) at 'A' with a ‘Stable’ outlook. (Bloomberg) Fitch affirms ABQK’s IDR ratings at 'A', outlook 'Stable' – Fitch Ratings has affirmed Ahli Bank's (ABQK) Long-Term Issuer Default Rating (IDR) at 'A' with a ‘Stable’ outlook. It has also affirmed the Viability Rating (VR) at 'bbb-'. (Bloomberg) QCB circulates court enforcement order freezing assets of non- QFC company – The Qatar Central Bank (QCB) circulated last Sunday an enforcement order issued by the Enforcement Judge of the Qatar International Court against a non-QFC registered company operating within the State of Qatar. The enforcement order directs all banks and relevant financial institutions within the State of Qatar to comply, freezing the relevant sums and transferring the same to the Qatar International Court’s Enforcement Account for the benefit of the judgment creditor. The enforcement order comes after the First Instance Circuit of the Qatar International Court found the defendant, a local company registered outside the Qatar Financial Centre (QFC), liable to the claimant in relation to unpaid insurance premiums. The case commenced when the claimant, a QFC-registered company, brought a claim before the court in 2017, alleging that the defendant had failed to pay premiums owed to the claimant pursuant to the terms of a health insurance policy, thereby breaching the provisions of the agreement signed by the two parties. (Gulf-Times.com)
- 3. Page 3 of 6 Qatar Stock Exchange Top Gainers Top Decliners Source: Qatar Stock Exchange (QSE) Source: Qatar Stock Exchange (QSE) Most Active Shares by Value (QR Million) Most Active Shares by Volume (Million) Source: Qatar Stock Exchange (QSE) Source: Qatar Stock Exchange (QSE) Investor Trading Percentage to Total Value Traded Net Traded Value by Nationality (QR Million) Source: Qatar Stock Exchange (QSE) Source: Qatar Stock Exchange (QSE) 9.6% 6.9% 5.0% 4.9% 4.8% 0.0% 4.0% 8.0% 12.0% Qatar Cinema & Film Distribution Co. Gulf Warehousing Company Ezdan Holding Group Islamic Holding Group Qatar National Cement Company -7.9% -6.8% -5.4% -5.1% -5.0% -12.0% -8.0% -4.0% 0.0% BarwaReal Estate Company QatariGermanCo. forMedical Dev. MannaiCorporation QatarNavigation Ooredoo 160.1 122.0 121.4 96.9 94.4 0.0 60.0 120.0 180.0 QNB Group The Commercial Bank Qatar Fuel Company United Development Company Barwa Real Estate Company 7.2 3.4 3.2 2.7 2.7 0.0 3.0 6.0 9.0 United Development Company Mesaieed Petrochemical HoldingCo. Qatar Aluminium Manufacturing Company Ezdan Holding Group The Commercial Bank 0% 20% 40% 60% 80% 100% Buy Sell 29.32% 41.67% 30.17% 27.20% 9.63% 11.78% 30.88% 19.36% Qatari Individuals Qatari Institutions Non-Qatari Individuals Non-Qatari Institutions 796 542 922 417 (126) 126 (200) - 200 400 600 800 1,000 Qatari Non-Qatari Net Investment Total Sold Total Bought
- 4. Page 4 of 6 TECHNICAL ANALYSIS OF THE QSE INDEX Source: Bloomberg The QE Index closed slightly down by 0.17% from the week before, and closed at 9,953.72. We remain on the view of the corrective side of the Index as we wait for opportunities of possible reversals. We keep our weekly support level at the 9,250 level and our resistance at the 10,400 level. DEFINITIONS OF KEY TERMS USED IN TECHNICAL ANALYSIS RSI (Relative Strength Index) indicator – RSI is a momentum oscillator that measures the speedand change of price movements. The RSI oscillates between 0 to 100. The index is deemed to be overbought once the RSI approaches the 70 level, indicating that a correction is likely. On the other hand, if the RSI approaches 30, it is an indication that the index may be getting oversold and therefore likely to bounce back. MACD (Moving Average Convergence Divergence) indicator – The indicator consists of the MACD line and a signal line. The divergence or the convergence of the MACD line with the signal line indicates the strength in the momentum during the uptrend or downtrend, as the case may be. When the MACD crosses the signal line from below and trades above it, it gives a positive indication. The reverse is the situation for a bearish trend. Candlestick chart – A candlestick chart is a price chart that displays the high, low, open, and close for a security. The ‘body’ of the chart is portion between the open and close price, while the high and low intraday movements form the ‘shadow’. The candlestick may represent any time frame. We use a one-day candlestick chart (every candlestick represents one trading day) in our analysis. Doji candlestick pattern – A Doji candlestick is formed when a security's open and close are practically equal. The pattern indicates indecisiveness, and based on preceding price actions and future confirmation, may indicate a bullish or bearish trend reversal. ShootingStar/Inverted Hammer candlestick patterns – These candlestick patterns have a small real body (open price and close price are near to each other), and a long upper shadow (large intraday movement on the upside). The Shooting Star is a bearish reversal pattern that forms after a rally. The Inverted Hammer looks exactly like a Shooting Star, but forms after a downtrend. Inverted Hammers represent a potential bullish trend reversal.
- 5. Page 5 of 6 Source: Bloomberg Company Name Price March 21 % Change WTD % Change YTD Market Cap. QR Million TTM P/E P/B Div. Yield Qatar National Bank 180.00 0.56 (7.69) 166,256 12.9 2.5 3.3 Qatar Islamic Bank 150.67 1.12 (0.88) 35,602 14.0 2.3 3.3 Commercial Bank of Qatar 43.88 0.43 11.40 17,759 12.5 1.1 3.4 Doha Bank 19.60 3.70 (11.71) 6,077 10.0 0.7 5.1 Al Ahli Bank 29.50 1.72 15.89 6,826 10.2 1.2 3.1 Qatar International Islamic Bank 66.04 3.35 (0.12) 9,996 12.1 1.7 6.1 Masraf Al Rayan 37.16 (0.38) (10.84) 27,870 13.1 2.1 5.4 Al Khaliji Bank 11.10 2.12 (3.81) 3,996 7.2 0.7 6.8 Qatar First Bank 4.01 0.75 (1.72) 802 N/A 0.8 N/A National Leasing 8.05 1.64 (8.42) 398 53.1 0.6 6.2 Dlala Holding 9.59 (2.84) (4.10) 273 N/A 1.3 N/A Qatar & Oman Investment 5.60 0.00 4.87 176 38.4 0.6 5.3 Islamic Holding Group 22.55 4.88 3.20 128 N/M 0.9 N/A Banking and Financial Services 276,160 Zad Holding 120.55 (1.19) 15.91 1,735 14.7 1.9 4.9 Qatar German Co. for Medical Devices 6.08 (6.75) 7.42 70 N/A 1.5 N/A Salam International Investment 4.12 (2.37) (4.85) 471 N/A 0.4 N/A Medicare Group 65.98 1.48 4.56 1,857 22.0 1.8 2.7 Qatar Cinema & Film Distribution 19.00 9.64 (0.11) 119 14.0 0.8 5.3 Qatar Fuel 195.00 0.67 17.48 19,388 16.7 2.4 4.1 Qatar Meat and Livestock 64.00 3.11 (8.57) 1,152 10.6 3.2 7.0 Mannai Corp. 47.70 (5.41) (13.19) 2,176 5.3 0.8 8.4 Al Meera Consumer Goods 146.00 (4.89) (1.35) 2,920 16.0 2.1 5.8 Consumer Goods and Services 29,888 Qatar Industrial Manufacturing 39.45 3.41 (7.61) 1,875 9.4 1.2 6.3 Qatar National Cement 66.00 4.76 10.92 4,313 12.4 1.3 7.6 Industries Qatar 122.48 0.39 (8.33) 74,100 14.7 2.1 4.9 Qatari Investors Group 25.10 (0.48) (9.74) 3,121 15.1 1.1 3.0 Qatar Electricity and Water 170.40 0.24 (7.89) 18,744 12.2 1.8 4.5 Aamal 9.95 1.64 11.99 6,237 14.1 0.8 6.1 Gulf International Services 13.79 1.40 (18.88) 2,563 N/A 0.7 N/A Mesaieed Petrochemical Holding 19.41 2.21 29.14 24,385 17.6 1.6 4.1 Invesment Holding Group 5.22 3.37 6.75 433 7.5 0.6 4.8 Qatar Aluminum Manufacturing 11.07 (1.60) (17.08) 6,177 N/A N/A N/A Industrials 141,948 Qatar Insurance 34.90 0.87 (2.79) 11,130 19.9 1.4 4.3 Doha Insurance 12.18 0.25 (6.95) 609 10.1 0.6 6.2 Qatar General Insurance & Reinsurance 39.70 0.00 (11.54) 3,474 14.2 0.6 5.5 Al Khaleej Takaful Insurance 9.20 1.66 7.10 235 32.4 0.5 5.4 Qatar Islamic Insurance 58.00 3.76 7.99 870 13.8 2.4 6.0 Insurance 16,318 United Development 13.47 4.34 (8.68) 4,770 9.5 0.4 7.4 Barw a Real Estate 36.50 (7.94) (8.54) 14,203 7.4 0.7 6.8 Ezdan Real Estate 11.55 5.00 (11.02) 30,636 68.4 1.0 N/A Mazaya Qatar Real Estate Development 7.40 4.37 (5.13) 857 26.3 0.6 N/A Real Estate 50,466 Ooredoo 66.00 (5.04) (12.00) 21,141 13.5 1.0 3.8 Vodafone Qatar 7.68 (0.26) (1.66) 6,493 55.4 1.4 3.3 Telecoms 27,634 Qatar Navigation (Milaha) 64.41 (5.14) (2.42) 7,377 14.2 0.5 4.7 Gulf Warehousing 42.74 6.85 11.10 2,505 10.6 1.4 4.4 Qatar Gas Transport (Nakilat) 19.90 (0.50) 10.99 11,025 12.4 1.6 5.0 Transportation 20,906 Qatar Exchange 563,320
- 6. Contacts Saugata Sarkar, CFA, CAIA Shahan Keushgerian Zaid al-Nafoosi , CMT, CFTe Head of Research Senior Research Analyst Senior Research Analyst Tel: (+974) 4476 6534 Tel: (+974) 4476 6509 Tel: (+974) 4476 6535 saugata.sarkar@qnbfs.com.qa shahan.keushgerian@qnbfs.com.qa zaid.alnafoosi@qnbfs.com.qa Mehmet Aksoy, PhD QNB Financial Services Co. W.L.L. Senior Research Analyst Contact Center: (+974) 4476 6666 Tel: (+974) 4476 6589 PO Box 24025 mehmet.aksoy@qnbfs.com.qa Doha, Qatar Disclaimer and Copyright Notice: This publication has been prepared by QNB Financial Services Co. W.L.L. (“QNB FS”) a wholly-owned subsidiary of Qatar National Bank (Q.P.S.C.). QNB FS is regulated by the Qatar Financial Markets Authority and the Qatar Exchange. Qatar National Bank (Q.P.S.C.) is regulated by the Qatar Central Bank. This publication expresses the views and opinions of QNB FS at a given time only. It is not an offer, promotion or recommendation to buy or sell securities or other investments, nor is it intended to constitute legal, tax, accounting, or financial advice. QNB FS accepts no liability whatsoever for any direct or indirect losses arising from use of this report. Any investment decision should depend on the individual circumstances of the investor and be based on specifically engaged investment advice. We therefore strongly advise potential investors to seek independent professional advice before making any investment decision. Although the information in this report has been obtained from sources that QNB FS believes to be reliable, we have not independently verified such information and it may not be accurate or complete. QNB FS does not make any representations or warranties as to the accuracy and completeness of the information it may contain, and declines any liability in that respect. For reports dealing with Technical Analysis, expressed opinions and/or recommendations may be different or contrary to the opinions/recommendations of QNB FS Fundamental Research as a result of depending solely on the historical technical data (price and volume). QNB FS reserves the right to amend the views and opinions expressed in this publication at any time. It may also express viewpoints or make investment decisions that differ significantly from, or even contradict, the views and opinions included in this report. This report may not be reproduced in whole or in part without permission from QNB FS COPYRIGHT: No part of this document may be reproduced without the explicit written permission of QNB FS. Page 6 of 6