QNBFS Weekly Market Report April 01, 2021
•
0 likes•83 views

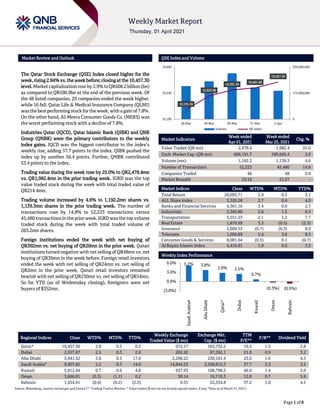
The Qatar Stock Exchange (QSE) Index closed higher for the week, rising 2.84% vs. the week before; closing at the 10,457.30 level.

Recommended
Recommended
More Related Content
What's hot
What's hot (20)
Similar to QNBFS Weekly Market Report April 01, 2021
Similar to QNBFS Weekly Market Report April 01, 2021 (20)
More from QNB Group
More from QNB Group (20)
Recently uploaded
Recently uploaded (20)
QNBFS Weekly Market Report April 01, 2021
- 1. ``````` Page 1 of 8 Market Review and Outlook QSE Index and Volume The Qatar Stock Exchange (QSE) Index closed higher for the week,rising2.84%vs. theweek before;closingatthe 10,457.30 level.Marketcapitalizationroseby2.9%toQR608.2billion(bn) as compared to QR590.9bn at the end of the previous week. Of the 48 listed companies, 29 companies ended the week higher, while 16 fell. Qatar Life & Medical Insurance Company (QLMI) wasthebestperformingstock fortheweek,withagainof7.8%. On the other hand, Al-Meera Consumer Goods Co. (MERS) was the worst performing stock with a decline of 7.8%. Industries Qatar (IQCD), Qatar Islamic Bank (QIBK) and QNB Group (QNBK) were the primary contributors to the weekly index gains. IQCD was the biggest contributor to the index’s weekly rise, adding 57.7 points to the index. QIBK pushed the index up by another 56.4 points. Further, QNBK contributed 53.4 points to the index. Trading value during the week rose by 25.0% to QR2,478.4mn vs. QR1,982.4mn in the prior trading week. IGRD was the top value traded stock during the week with total traded value of QR214.4mn. Trading volume increased by 4.6% to 1,192.2mn shares vs. 1,139.3mn shares in the prior trading week. The number of transactions rose by 14.8% to 52,223 transactions versus 45,480 transactionsinthepriorweek. IGRDwasthetopvolume traded stock during the week with total traded volume of 263.2mn shares. Foreign institutions ended the week with net buying of QR302mn vs. net buying of QR20mn in the prior week. Qatari institutions turned negative with net selling of QR48mn vs. net buying of QR36mn in the week before. Foreign retail investors ended the week with net selling of QR24mn vs. net selling of QR2mn in the prior week. Qatari retail investors remained bearish with net selling of QR230mn vs. net selling of QR54mn. So far YTD (as of Wednesday closing), foreigners were net buyers of $352mn. Market Indicators Week ended Apr 01, 2021 Week ended Mar 25, 2021 Chg. % Value Traded (QR mn) 2,478.4 1,982.4 25.0 Exch. Market Cap. (QR mn) 608,191.7 590,926.4 2.9 Volume (mn) 1,192.2 1,139.3 4.6 Number of Transactions 52,223 45,480 14.8 Companies Traded 48 48 0.0 Market Breadth 29:16 21:27 – Market Indices Close WTD% MTD% YTD% Total Return 20,692.71 2.9 0.5 3.1 ALL Share Index 3,326.28 2.7 0.4 4.0 Banks and Financial Services 4,361.16 3.4 0.0 2.7 Industrials 3,360.80 2.6 1.2 8.5 Transportation 3,551.53 2.1 1.2 7.7 Real Estate 1,879.99 3.3 (0.5) (2.5) Insurance 2,609.53 (0.7) (0.3) 8.9 Telecoms 1,096.89 5.4 3.6 8.5 Consumer Goods & Services 8,081.64 (0.5) 0.1 (0.7) Al Rayan Islamic Index 4,416.81 1.9 0.6 3.5 Weekly Index Performance Regional Indices Close WTD% MTD% YTD% Weekly Exchange Traded Value ($ mn) Exchange Mkt. Cap. ($ mn) TTM P/E** P/B** Dividend Yield Qatar* 10,457.30 2.8 0.5 0.2 672.17 165,732.2 19.5 1.5 2.8 Dubai 2,557.67 2.5 0.3 2.6 202.42 97,282.1 21.0 0.9 3.2 Abu Dhabi 5,941.52 3.8 0.5 17.8 2,298.22 230,101.4 23.0 1.6 4.5 Saudi Arabia# 9,907.82 5.2 8.3 14.0 14,844.23 2,568,815.3 37.7 2.3 2.5 Kuwait 5,812.44 0.7 0.6 4.8 637.93 108,798.5 46.0 1.4 3.0 Oman 3,666.81 (0.3) (1.1) 0.2 30.14 16,710.3 12.0 0.7 5.6 Bahrain 1,454.91 (0.6) (0.2) (2.3) 9.55 22,334.8 37.2 1.0 4.1 Source: Bloomberg, country exchanges and Zawya (** Trailing Twelve Months; * Value traded ($ mn) do not include special trades, if any; #Data as of March 31, 2021) 10,191.56 10,323.98 10,381.30 10,401.50 10,457.30 0 175,000,000 350,000,000 10,100 10,350 10,600 28-Mar 29-Mar 30-Mar 31-Mar 1-Apr Volume QE Index 5.2% 3.8% 2.8% 2.5% 0.7% (0.3%) (0.6%) (3.0%) 0.0% 3.0% 6.0% Saudi Arabia# Abu Dhabi Qatar* Dubai Kuwait Oman Bahrain
- 2. Page 2 of 8 Economic, Market & Corporate News Emergency services only at private health centers from tomorrow – The Cabinet has decided to stop the provision of medical services in private health facilities, except for emergency cases, from tomorrow (Friday). The private health facilities will be allowed to provide some of their medical services, if possible, through modern means of communication, Qatar News Agency (QNA) reported yesterday. The decision came at the Cabinet’s regular meeting yesterday. Following the meeting, HE the Minister of Justice and Acting Minister of State for Cabinet Affairs Dr Issa Saad alJafali al-Nuaimi issued a statement giving the details of the proceedings. At the outset of the meeting, the Cabinet listened to the explanation provided by HE the Minister of Public Health on the latest developments and steps taken to limit the spread of COVID-19. It affirmed the continued implementation of precautionary measures in order to combat the pandemic. The meeting approved the Cabinet’s draft decision to reconstitute the Lawyers Admission Committee, and also gave its nod to the draft decision of HE the Minister of Transport and Communications to establish sections in the administrative units of the general authority for civil aviation and define their functions. (Gulf-Times.com) Islamic banking assets constitute 26% of the total in Qatar – Qatar is one of the first countries to get into Islamic finance since the early 80s and it has continued to grow over the past years to become the fifth largest market for Islamic finance in the world, said Sheikh Mohammed bin Hamad bin Jassim Al Thani, the Chairman and Managing Director of Dukhan Bank. Addressing 7th Doha Islamic Finance Conference on its inaugural day on Tuesday, Sheikh Mohammed said Islamic banking assets constitute 26% of the total banking assets in Qatar. He said, Dukhan Bank, which is the strategic partner and exclusive sponsor of the conference, managed to complete the first merger ever in Qatar’s history in 2019 which led to the bank’s assets exceeding QR86bn. The merger also contributed to strengthening the position of Islamic banking in Qatar, he added. (Qatar Tribune) Al-Kuwari: Robust legal, regulatory framework helps Islamic finance growth in Qatar – H.E. the Minister of Commerce and Industry Ali bin Ahmed Al-Kuwari said the remarkable growth achieved by Islamic finance in Qatar has been due to the pioneering legal and regulatory framework governing the sector in the country. Inaugurating the 7th Doha Islamic Finance Conference virtually on Tuesday he praised the outstanding experience of Islamic finance in Qatar, as Qatari Islamic banks are ranked among the largest in the world. Furthermore, Qatar is one of the largest Islamic finance markets in the world. Local Islamic banks’ assets reached QR415.8bn in 2019, compared to about QR350bn in 2018. Qatari Islamic banks, he said showed strong performance and high growth rates in their profits in 2019. Their revenues reached QR18.6bn, an increase of 15.4% compared to 2018. The revenues of financing and investment activities accounted for 90% of the Islamic banks’ total revenues. Funding from Islamic banks to the real estate sector amounted to 36.4% of the total funding it received from the banking sector, and 35.6% in the industrial division, Al-Kuwari said. In view of the entities financed by Islamic banks, the private sector has greatly benefited from these banks’ credit, especially in real estate, trade, financial activities, and insurance, as well as in the small and medium-sized companies segment. In this regard, Islamic banks today represent one of the pillars of the stability of Qatar’s financial sector. Al-Kuwari noted the Islamic economic system as a safe haven for sustainable development and a bulwark against economic crises, through its pivotal role in building a just and integral economic system. (Gulf-Times.com) QSE will launch QE Venture Market dedicated to SME’s – During the nextfew weeks, theQatarStock Exchange(QSE) will launch the QE Venture Market (QEVM), which will provide a listing and trading venue for SME’s that do not fulfil listing requirement of the main market. The QEVM provides an alternative route to market for the SME’s who need the access to capital that being listed entails. The QEVM would give SME owners an opportunity to be listed in the bourse in accordance with lighter and flexible regulations, while giving further finance sources in order for them to grow and expand their businesses. QSE’s CEO, Rashid bin Ali Al Mansoori said, “The launch of the new market comes within the framework of QSE’s vision and strategy aimed at diversifying investment options and products available to individual and institutional investors.” He stressed QSE’s pioneering role in providing financing and expansion opportunities for growing Qatari SME’s, in line with Qatar National Vision 2030 and the State’s economic diversification policy. Al-Mansoori explained that the QEVM provides SME’s with many advantages as it allows them to diversify sources of funding through access to permanent equity capital whilst offering liquidity to financial, family or minority shareholders as well as visibility. The QEVMis characterized by the flexibility of the listing requirements which suit smaller entrepreneurial companies with a more limited track record and fewer resources to meet the heightened investor relations and corporate governance practices demanded in the Main Market, Al- Mansoori added. Abdulaziz Nasser Al-Emadi, Director of QSE’s Listing Department, highlighted the value of the QEVM and indicated that the launch of the QEVM will coincide with the listing of the first SME on Qatar Stock Exchange. He also stressed his confidence that further companies will join the QEVM in the coming period. He also indicated that the companies eligible to join the QEVM should have an issued capital not below QR2 million, and number of shareholders not less than 20 who own no less than 10% of its capital upon the listing. The launch of the new market is the result of the strategic initiatives and intense efforts made by the QSE over the past years to develop Qatar’s capital market through continuous consultations with private and family-owned companies to identify their needs and offer them suitable solutions and incentives for listing in the market, Al-Emadi added. The stocks listed on the QEVM will be traded in the same manner as those on the main market in terms of order types, corporate actions and Settlement/ Clearing arrangements. Pricing of these securities is exactly the same as pricing mechanism of the stocks listed on the main market. Investors do not need to obtain newinvestor number to trade in theQEVM
- 3. Page 3 of 8 since no new investor numbers (NIN’s) are required to be issued for the investors who have already existing numbers. The orders in the QEVM are executed through the brokers licensed by QFMA. The pricing of the shares of companies listed in the emerging companies' market is exactly the same as the shares of companies listed in the main market. Trading in the emerging market will also be the same as the investor number, and the investor will not need to extract a new investor number for whoever has an existing number, and orders are issued and executed in this market through licensed brokers. The QEVM will follow the same continuous trading pattern as the main market. The tick sizes for the QEVM Equities will be as same as those for the main market. The stock quotes of the QEVM will be broadcasted on a separate market watch at QSE website and independent from the main market screens. Trading volumes and other relevant data for the QEVM will be reported on the QSE website on a daily basis. (QSE) Ooredoo Group announces $750mn deal for sale of more than 4,200 telecoms towers in Indonesia –Ooredoo announced that its Indonesian operating company, PT Indosat Tbk. (Indosat Ooredoo), has signed a sale and leaseback agreement with PT EPID Menara AssetCo (Edge Point Indonesia) for more than 4,200 telecommunications towers. PT EPID Menara AssetCo is an Indonesian subsidiary of Edge Point Singapore, which is wholly owned by Digital Colony, a leading global digital infrastructure investor with extensive experience owning and operating cellular towers. Indosat Ooredoo has agreed to sell this portfolio of towers in a transaction valued at $750mn, including a supplementary offer, making it one of the largest deals of its kind in Asia. The sale will unlock capital to create value for shareholders and continue to build Indosat Ooredoo’s strong growth momentum through improvements to network performance and the launch of innovative new digital solutions to enhance the customer experience. The sale is part of Ooredoo Group’s strategy to move to a more efficient and flexible asset light model and unlock the trapped value of its infrastructure portfolio. Prior to this deal, Ooredoo had a global portfolio of approximately 27,000 owned towers, representing an infrastructure portfolio of significant value for the Group. Monetizing these assets to create more value for both shareholders and customers is a key focus of Ooredoo’s current strategy. Aziz Aluthman Fakhroo, Managing Director of Ooredoo Group, said, “Congratulations to Indosat Ooredoo on this sale and leaseback agreement with Edge Point Indonesia, which aligns perfectly with our new strategy and its focus on creating more value for shareholders and customers. This strategy incorporates a shift towards an asset-light model that will help us unlock significant capital and enable us to focus on our core mission of delivering outstanding digital and enterprise services to our customer base. I extend our gratitude to the Government of Indonesia for its progressive policies that leave a positive impact on the industry, its operators and its people.” Edge Point Indonesia was declared the winning bidder of a competitive tender process conducted by Indosat Ooredoo. The transaction is expected to close in 2Q2021 subject to customary conditions, including shareholder approval by Indosat Ooredoo at an EGM, which is planned to be held on May 6th. Indosat Ooredoo will lease back space on the towers for a period of 10- years to meet its ongoing requirements. President Director and Chief Executive Officer of Indosat Ooredoo, Ahmad Al Neama, added, “I am delighted that Indosat Ooredoo has agreed this deal, which furthers our strategy to create more value from our infrastructure assets. The deal marks the third and final sale of assets from our high-quality tower portfolio and continues our transition into a leading digital telecoms company. We are confident the leaseback agreement, with its attractive terms, will continue to meet our ongoing tower needs, while the capital that we have unlocked will provide further fuel to power our growth momentum. Indosat Ooredoo and Edge Point Indonesia will work closely together going forward and build a strong and long-lasting strategic partnership.” J.P. Morgan acted as financial advisor to Indosat Ooredoo throughout the transaction. (QSE) MRDS' bottom line rises 11.7% YoY and 71.7% QoQ in 4Q2020 – Mazaya Real Estate Development's (MRDS) net profit rose 11.7% YoY (+71.7% QoQ) to QR15.4mn in 4Q2020.The company's finance income came in at QR17.9mn in 4Q2020, which represents a decrease of 2.4% YoY (-0.6% QoQ). In FY2020, MRDS recorded net profit of QR31.0mn as compared to QR32.1mn in FY2019. EPS remained flat YoY at QR0.03 in FY2020. (QSE) Sheikh Faisal: AHCS’ diversified business model demonstrated resilience and value yet again; AGM approves cash dividends distribution – Aamal Company’s (AHCS) diversified business model demonstrated its resilience and value once again this year as the company achieved revenue growth despite the pandemic circumstances, according to AHCS’ Chairman, HE Sheikh Faisal bin Qassim Al-Thani. Addressing company shareholders at AHCS’ AGM held virtually on Tuesday he said, “The results of Aamal Company are evidence of the resilience and strength of the economy of our beloved country Qatar. So I would like to take this opportunity to thank our wise government under the leadership of HH the Amir Sheikh Tamim bin Hamad Al-Thani for its inspiring leadership during this pandemic and its continuous support to help us overcome the negative effects of the pandemic and provide the best care for citizens and residents.” Delivering the Chairman’s report, Sheikh Mohamed bin Faisal Al-Thani, CEO and Managing Director said, “AHCS’ total revenue increased marginally by 1% to QR1,306.8mn (2019: QR1,294.1mn), driven by increased revenue in our industrial manufacturing and trading and distribution segments demonstrating the resilience of AHCS’ business model in an exceptionally challenging environment. The AGM approved distributing cash dividends equaling 4% of the nominal value of each share. The AGM approved AHCS' Corporate Governance Report for 2020 and approved the company’s Internal Controls over Financial Reporting (ICOFR) Report for the year that ended in December last year. (Gulf- Times.com) WDAM opens Al Sheehaniya abattoir – Widam Food Company (WDAM) has opened Al Sheehaniya Slaughterhouse for all types of livestock, as part of its strategic plan to expand the scope of its services and products. Engineer Mohamed Badr al- Sada, Chairman of WDAM, pointed out that WDAM has been a pioneer in operating slaughterhouses in the country. Al Sheehaniya Slaughterhouse, which is located at Rawdat Rashid Road, is the most recent project of the company in this field. It will offer the services of slaughtering and preparing livestock
- 4. Page 4 of 8 including sheep, goats, cattle and camels. The services will be offered to individuals, and meat shops as well as farms and barns in the area. The official explained that the slaughterhouse is equipped according to the highest standards in the field to guarantee smooth and highly efficient services for the customers. He said that Widam has been keen to open this slaughterhouse ahead of the upcoming holy month of Ramadan due to the expected surge of demand. The new slaughterhouse has a space of 5,000sqm, including four halls for slaughtering livestock, in addition to cooling rooms to keep the meat and a waiting hall for the public, besides some barns and fodder storehouses. The production capacity is estimated at 1,000 heads of livestock a day and all the processes are subject to the veterinary control by the Ministry of Municipality and Environment. (Gulf-Times.com)
- 5. Page 5 of 8 Qatar Stock Exchange Top Gainers Top Decliners Source: Qatar Stock Exchange (QSE) Source: Qatar Stock Exchange (QSE) Most Active Shares by Value (QR Million) Most Active Shares by Volume (Million) Source: Qatar Stock Exchange (QSE) Source: Qatar Stock Exchange (QSE) Investor Trading Percentage to Total Value Traded Net Traded Value by Nationality (QR Million) Source: Qatar Stock Exchange (QSE) Source: Qatar Stock Exchange (QSE) 7.8% 7.4% 6.8% 5.6% 5.0% 0.0% 3.0% 6.0% 9.0% QLM Life & Medical Insurance Company Dlala Brokerage & Investment Holding Company Mannai Corporation Ooredoo Vodafone Qatar -7.8% -6.7% -6.3% -2.6% -2.6% -9.0% -6.0% -3.0% 0.0% Al Meera Consumer Goods Company Aamal Company Qatari German Company for Medical Devices Qatar Cinema & Film Distribution Company Qatar National Cement Company 214.4 209.4 180.9 120.1 93.1 0.0 80.0 160.0 240.0 Investment Holding Group QNB Group Masraf Al Rayan Ezdan Holding Group Qatar Aluminium Manufacturing Company 263.2 107.5 77.9 74.3 64.6 0.0 100.0 200.0 300.0 Investment Holding Group Salam International Investment Limited Qatar Aluminium Manufacturing Company Ezdan Holding Group Mazaya Qatar Real Estate Development 0% 20% 40% 60% 80% 100% Buy Sell 42.72% 52.01% 15.83% 17.77% 15.49% 16.45% 25.96% 13.76% Qatari Individuals Qatari Institutions Non-Qatari Individuals Non-Qatari Institutions 1,451 1,027 1,730 749 -278 278 -500 0 500 1,000 1,500 2,000 Qatari Non-Qatari Net Investment Total Sold Total Bought
- 6. Page 6 of 8 TECHNICAL ANALYSIS OF THE QSE INDEX Source: Bloomberg The QE Index gained 2.84% from last week and closed at 10,457.30 in the last session this week. The QE Index managed to continue with its bounce as we expected in the past reports. We remain positive in the short term on the general direction of the Index. Our projected resistance level is around 10,600 points and the support level remains at the 10,000 points. DEFINITIONS OF KEY TERMS USED IN TECHNICAL ANALYSIS RSI (Relative Strength Index) indicator – RSI is a momentum oscillator that measures the speedand change of price movements. The RSI oscillates between 0 to 100. The index is deemed to be overbought once the RSI approaches the 70 level, indicating that a correction is likely. On the other hand, if the RSI approaches 30, it is an indication that the index may be getting oversold and therefore likely to bounce back. MACD (Moving Average Convergence Divergence) indicator – The indicator consists of the MACD line and a signal line. The divergence or the convergence of the MACD line with the signal line indicates the strength in the momentum during the uptrend or downtrend, as the case may be. When the MACD crosses the signal line from below and trades above it, it gives a positive indication. The reverse is the situation for a bearish trend. Candlestick chart – A candlestick chart is a price chart that displays the high, low, open, and close for a security. The ‘body’ of the chart is portion between the open and close price, while the high and low intraday movements form the ‘shadow’. The candlestick may represent any time frame. We use a one-day candlestick chart (every candlestick represents one trading day) in our analysis. Doji candlestick pattern – A Doji candlestick is formed when a security's open and close are practically equal. The pattern indicates indecisiveness, and based on preceding price actions and future confirmation, may indicate a bullish or bearish trend reversal. ShootingStar/Inverted Hammer candlestick patterns – These candlestick patterns have a small real body (open price and close price are near to each other), and a long upper shadow (large intraday movement on the upside). The Shooting Star is a bearish reversal pattern that forms after a rally. The Inverted Hammer looks exactly like a Shooting Star, but forms after a downtrend. Inverted Hammers represent a potential bullish trend reversal.
- 7. Page 7 of 8 Source: Bloomberg Company Name Price April 01 % Change WTD % Change YTD Market Cap. QR Million TTM P/E P/B Div. Yield Qatar National Bank 17.95 3.70 0.67 165,794 15.0 2.2 2.5 Qatar Islamic Bank 16.70 4.31 (2.40) 39,461 13.9 2.2 2.4 Commercial Bank of Qatar 4.80 4.35 9.09 19,427 17.7 1.1 2.1 Doha Bank 2.28 0.31 (3.80) 7,060 14.0 0.7 3.3 Al Ahli Bank 3.61 0.00 4.76 8,774 12.9 1.4 4.2 Qatar International Islamic Bank 8.72 1.34 (3.72) 13,192 15.9 2.1 3.7 Masraf Al Rayan 4.27 2.64 (5.74) 32,025 14.7 2.2 4.0 Al Khaliji Bank 2.13 2.16 15.89 7,668 12.3 1.2 2.6 Qatar First Bank 1.88 1.02 9.24 1,316 N/A 2.8 N/A National Leasing 1.24 (1.90) (0.24) 614 13.4 0.9 2.0 Dlala Holding 1.81 7.41 0.89 515 77.2 2.5 N/A Qatar & Oman Investment 0.86 0.70 (3.04) 271 40.0 0.9 2.3 Islamic Holding Group 5.26 2.89 2.89 298 49.2 2.1 0.9 Banking and Financial Services 296,413 Zad Holding 18.16 0.94 21.80 4,304 21.4 2.8 4.7 Qatar German Co. for Medical Devices 2.90 (6.32) 29.77 335 399.4 10.6 N/A Salam International Investment 0.67 (0.60) 2.30 761 N/A 0.5 N/A Baladna 1.62 (0.80) (9.61) 3,076 N/A 1.4 1.3 Medicare Group 9.49 (0.56) 7.32 2,670 31.9 2.6 19.0 Qatar Cinema & Film Distribution 3.70 (2.63) (7.34) 232 49.0 1.7 2.7 Qatar Fuel 17.29 (0.06) (7.44) 17,191 22.6 2.0 2.7 Qatar Meat and Livestock 5.73 (0.68) (9.43) 1,031 20.4 2.8 5.2 Mannai Corp. 4.09 6.82 36.33 1,866 148.2 0.8 4.9 Al Meera Consumer Goods 19.49 (7.85) (5.89) 3,898 20.3 2.5 4.6 Consumer Goods and Services 35,364 Qatar Industrial Manufacturing 2.87 (0.38) (10.56) 1,364 15.3 0.9 3.5 Qatar National Cement 5.05 (2.57) 21.69 3,300 22.6 1.1 4.0 Industries Qatar 12.20 4.10 12.24 73,810 37.8 2.2 2.7 Qatari Investors Group 1.91 (2.00) 5.47 2,375 28.7 0.8 3.1 Qatar Electricity and Water 16.95 1.62 (5.04) 18,645 16.1 1.9 3.7 Aamal 0.96 (6.74) 11.70 6,017 49.0 0.8 4.2 Gulf International Services 1.50 2.39 (12.54) 2,788 N/A 0.9 N/A Mesaieed Petrochemical Holding 1.86 2.20 (9.38) 23,305 43.3 1.5 2.2 Invesment Holding Group 0.81 1.77 34.39 668 28.3 0.8 N/A Qatar Aluminum Manufacturing 1.20 1.52 23.99 6,691 N/A 1.2 2.9 Industrials 138,961 Qatar Insurance 2.48 (1.47) 5.17 8,113 N/A 1.0 N/A QLM Life & Medical Insurance 5.12 7.77 N/A 1,792 N/A N/A N/A Doha Insurance 1.90 (1.04) 36.49 950 15.8 0.9 5.3 Qatar General Insurance & Reinsurance 2.40 0.00 (9.77) 2,100 15.6 0.4 N/A Al Khaleej Takaful Insurance 3.44 3.18 81.30 878 25.8 1.6 1.5 Qatar Islamic Insurance 8.20 0.00 18.84 1,230 16.1 3.1 4.6 Insurance 15,064 United Development 1.59 4.25 (3.69) 5,644 24.9 0.5 3.1 Barw a Real Estate 3.23 2.77 (5.17) 12,549 10.4 0.6 3.9 Ezdan Real Estate 1.60 4.50 (9.74) 42,520 126.5 1.3 N/A Mazaya Qatar Real Estate Development 1.24 (1.43) (1.82) 1,435 46.1 1.2 N/A Real Estate 62,148 Ooredoo 7.25 5.61 (3.66) 23,207 21.1 1.0 3.5 Vodafone Qatar 1.75 4.98 30.55 7,389 40.2 1.6 2.9 Telecoms 30,596 Qatar Navigation (Milaha) 7.78 1.30 9.69 8,910 147.4 0.6 3.9 Gulf Warehousing 5.14 1.94 0.82 301 12.8 1.6 1.9 Qatar Gas Transport (Nakilat) 3.20 2.80 0.60 17,723 15.3 2.5 3.4 Transportation 26,935 Qatar Exchange 608,192
- 8. Contacts QNB Financial Services Co. W.L.L. Contact Center: (+974) 4476 6666 info@qnbfs.com.qa Doha, Qatar Saugata Sarkar, CFA, CAIA Shahan Keushgerian Mehmet Aksoy, PhD Head of Research Senior Research Analyst Senior Research Analyst saugata.sarkar@qnbfs.com.qa shahan.keushgerian@qnbfs.com.qa mehmet.aksoy@qnbfs.com.qa Disclaimer and Copyright Notice: This publication has been prepared by QNB Financial Services Co. W.L.L. (“QNBFS”) a wholly-owned subsidiary of Qatar National Bank (Q.P.S.C.). QNB FS is regulated by the Qatar Financial Markets Authority and the Qatar Exchange. Qatar National Bank (Q.P.S.C.) is regulated by the Qatar Central Bank. This publication expresses the views and opinions of QNBFS at a given time only. It is not an offer, promotion or recommendation to buy or sell securities or other investments, nor is it intended to constitute legal, tax, accounting, or financial advice. QNBFS accepts no liability whatsoever for any direct or indirect losses arising from use of this report. Any investment decision should depend on the individual circumstances of the investor and be based on specifically engaged investment advice. We therefore strongly advise potential investors to seek independent professional advice before making any investment decision. Although the information in this report has been obtained from sources that QNBFS believes to be reliable, we have not independently verified such information and it may not be accurate or complete. QNBFS does not make any representations or warranties as to the accuracy and completeness of the information it may contain, and declines any liability in that respect. For reports dealing with Technical Analysis, expressed opinions and/or recommendations may be different or contrary to the opinions/recommendations of QNBFS Fundamental Research as a result of depending solely on the historical technical data (price and volume). QNBFS reserves the right to amend the views and opinions expressed in this publication at any time. It may also express viewpoints or make investment decisions that differ significantly from, or even contradict, the views and opinions included in this report. This report may not be reproduced in whole or in part without permission from QNBFS. COPYRIGHT: No part of this document may be reproduced without the explicit written permission of QNBFS. Page 8 of 8