QNBFS Weekly Market Report December 23, 2021
•
0 likes•104 views

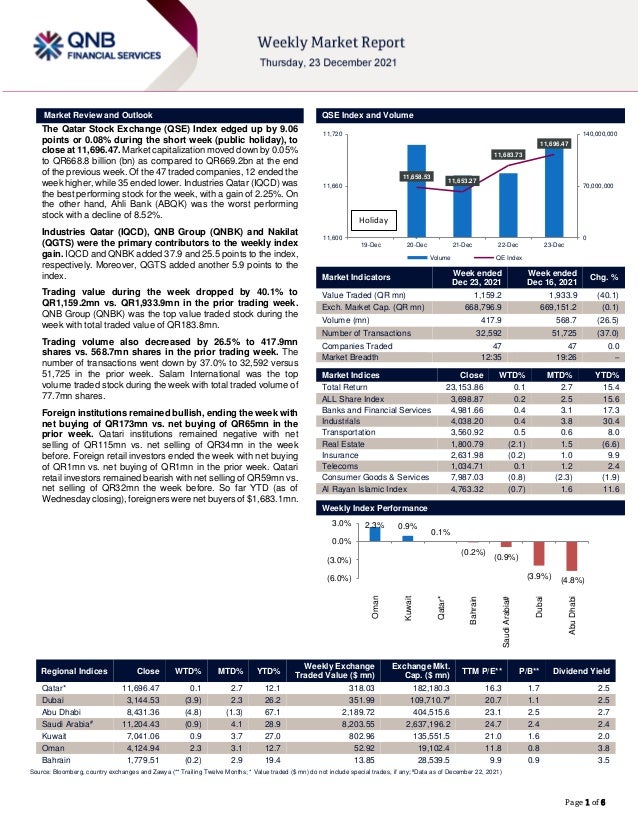
The Qatar Stock Exchange (QSE) Index edged up by 9.06 points or 0.08% during the short week (public holiday), to close at 11,696.47

Recommended
Recommended
More Related Content
Similar to QNBFS Weekly Market Report December 23, 2021
Similar to QNBFS Weekly Market Report December 23, 2021 (20)
More from QNB Group
More from QNB Group (20)
Recently uploaded
Recently uploaded (20)
QNBFS Weekly Market Report December 23, 2021
- 1. ``````` Page 1 of 6 Market Review and Outlook QSE Index and Volume The Qatar Stock Exchange (QSE) Index edged up by 9.06 points or 0.08% during the short week (public holiday), to close at 11,696.47. Market capitalization moved down by 0.05% to QR668.8 billion (bn) as compared to QR669.2bn at the end of the previous week. Of the 47 traded companies, 12 ended the week higher, while 35 ended lower. Industries Qatar (IQCD) was the best performing stock for the week, with a gain of 2.25%. On the other hand, Ahli Bank (ABQK) was the worst performing stock with a decline of 8.52%. Industries Qatar (IQCD), QNB Group (QNBK) and Nakilat (QGTS) were the primary contributors to the weekly index gain. IQCD and QNBK added 37.9 and 25.5 points to the index, respectively. Moreover, QGTS added another 5.9 points to the index. Trading value during the week dropped by 40.1% to QR1,159.2mn vs. QR1,933.9mn in the prior trading week. QNB Group (QNBK) was the top value traded stock during the week with total traded value of QR183.8mn. Trading volume also decreased by 26.5% to 417.9mn shares vs. 568.7mn shares in the prior trading week. The number of transactions went down by 37.0% to 32,592 versus 51,725 in the prior week. Salam International was the top volume traded stock during the week with total traded volume of 77.7mn shares. Foreign institutions remained bullish, ending the week with net buying of QR173mn vs. net buying of QR65mn in the prior week. Qatari institutions remained negative with net selling of QR115mn vs. net selling of QR34mn in the week before. Foreign retail investors ended the week with net buying of QR1mn vs. net buying of QR1mn in the prior week. Qatari retail investors remained bearish with net selling of QR59mn vs. net selling of QR32mn the week before. So far YTD (as of Wednesday closing), foreigners were net buyers of $1,683.1mn. Market Indicators Week ended Dec 23, 2021 Week ended Dec 16, 2021 Chg. % Value Traded (QR mn) 1,159.2 1,933.9 (40.1) Exch. Market Cap. (QR mn) 668,796.9 669,151.2 (0.1) Volume (mn) 417.9 568.7 (26.5) Number of Transactions 32,592 51,725 (37.0) Companies Traded 47 47 0.0 Market Breadth 12:35 19:26 – Market Indices Close WTD% MTD% YTD% Total Return 23,153.86 0.1 2.7 15.4 ALL Share Index 3,698.87 0.2 2.5 15.6 Banks and Financial Services 4,981.66 0.4 3.1 17.3 Industrials 4,038.20 0.4 3.8 30.4 Transportation 3,560.92 0.5 0.6 8.0 Real Estate 1,800.79 (2.1) 1.5 (6.6) Insurance 2,631.98 (0.2) 1.0 9.9 Telecoms 1,034.71 0.1 1.2 2.4 Consumer Goods & Services 7,987.03 (0.8) (2.3) (1.9) Al Rayan Islamic Index 4,763.32 (0.7) 1.6 11.6 Weekly Index Performance Regional Indices Close WTD% MTD% YTD% Weekly Exchange Traded Value ($ mn) Exchange Mkt. Cap. ($ mn) TTM P/E** P/B** Dividend Yield Qatar* 11,696.47 0.1 2.7 12.1 318.03 182,180.3 16.3 1.7 2.5 Dubai 3,144.53 (3.9) 2.3 26.2 351.99 109,710.7# 20.7 1.1 2.5 Abu Dhabi 8,431.36 (4.8) (1.3) 67.1 2,189.72 404,515.6 23.1 2.5 2.7 Saudi Arabia# 11,204.43 (0.9) 4.1 28.9 8,203.55 2,637,196.2 24.7 2.4 2.4 Kuwait 7,041.06 0.9 3.7 27.0 802.96 135,551.5 21.0 1.6 2.0 Oman 4,124.94 2.3 3.1 12.7 52.92 19,102.4 11.8 0.8 3.8 Bahrain 1,779.51 (0.2) 2.9 19.4 13.85 28,539.5 9.9 0.9 3.5 Source: Bloomberg, country exchanges and Zawya (** Trailing Twelve Months; * Value traded ($ mn) do not include special trades, if any; #Data as of December 22, 2021) 11,658.53 11,653.27 11,683.73 11,696.47 0 70,000,000 140,000,000 11,600 11,660 11,720 19-Dec 20-Dec 21-Dec 22-Dec 23-Dec Volume QE Index Holiday 2.3% 0.9% 0.1% (0.2%) (0.9%) (3.9%) (4.8%) (6.0%) (3.0%) 0.0% 3.0% Oman Kuwait Qatar* Bahrain Saudi Arabia# Dubai Abu Dhabi
- 2. Page 2 of 6 Economic, Market & Company News QNBFS: Assets of Qatari banks rise 6.7% to QR1.795tn in November 2021 – Qatari banks’ total assets have increased 0.2% month-on-month (MoM), up 6.7% year to date (YTD) in November to reach QR1.795tn, according to QNB Financial Services (QNBFS). The loan book went up by 0.5% MoM last month to reach QR1,213.8bn, while deposits fell 0.2% in November to QR963.8bn, QNBFS said. Loans grew by 7.5% YTD for 2021, compared to a growth of 8.6% in 2020. Loans grew by an average 8.5% over the past five years (2016-2020), QNBFS said. Private sector pushed the credit upwards (up 1.1% MoM in November). Loans to deposits ratio (LDR) went up to 125.9% in November compared to 125.1% in October. Non- resident deposits declined by 3% MoM (+13.2% YTD 2021) in November resulting in the overall deposits drop. Public sector deposits went up by 1.5% MoM (+7.6% YTD). Looking at segment details, the government institutions’ segment (represents 57% of public sector deposits) moved up by 2.1% MoM (+3.0% YTD 2021). The semi-government institutions’ segment increased by 3.2% MoM (+20.7% YTD 2021). The government segment declined by 0.4% MoM (+11.4% YTD). Private sector deposits went up by 0.7% MoM (+1.5% YTD 2021). On the private sector front, the consumer segment moved down by 0.2% MoM (+1.5% YTD) while the companies and institutions’ segment went up by 1.8% MoM (+1.5% YTD 2021). The overall loan book increased by 0.5% in November, QNBFS noted. (Gulf-Times.com, Qatar Tribune) Oxford Economics: Qatar real GDP to grow 2.5% this year, 3.7% in 2022 – Qatar’s real GDP has been projected to grow 2.5% this year and 3.7% in 2022, according to Oxford Economics. In a report on Thursday, Oxford Economics said: “Our projections vary across economies given divergent growth strategies and different policy space. We are upbeat on the UAE and Qatar as they benefit from hosting international events (Expo and World Cup) and open the doors to global investment and workforce, while the Saudi National Investment Strategy supports its growth prospects despite scaling back of spending. Kuwait and Oman will find it harder to boost recovery against the backdrop of workforce nationalization policies and limited budget headroom.” Oxford Economics anticipate a “strong recovery in economic output” across the GCC in 2022, with GDP growing at 5.2%, almost twice the pace this year. “It is challenging to forecast the impact of Omicron, given limited knowledge about the variant, but it is clear that downside risks stemming from the pandemic will linger for the foreseeable future.” Oil sector performance, it said will lead the rebound next year, rising by almost 8%, following a modest 0.6% expansion in the last 12 months. The OPEC+ group has stuck to its plan to steadily increase production quotas and, despite adopting a flexible approach to policy, it is unlikely to adjust this unless the Omicron variant dents demand to the extent that leads to a marked decline in oil prices. (Gulf-Times.com) Sources: Qatar targets $10bn of investments in US ports – Qatar plans to invest at least $10bn in US ports and has approached international banks for financing help, three finance sources say, in an infrastructure spree that reflects the Gulf country's deepening ties with Washington. The Middle East and Western sources familiar with the matter said Doha was targeting investments in ports around the US East Coast which were expected to be developed in phases, adding that the plan was at a preliminary stage. The country's sovereign wealth fund Qatar Investment Authority and the Qatar Government Communication Office both declined to comment. "The Qataris have been preparing for almost a year to test the waters with U.S. port investments," said Michael Frodl, a US-based adviser on projects including maritime security, commerce and infrastructure, who is familiar with Qatar's strategy. "We think that a shrewd investor with the $10 billion the Qataris desire to put into American port infrastructure would likely look at the underserved East Coast first and foremost. The West Coast is getting all the US government and private investment attention, while the East Coast is long overdue for improvements." Frodl said ports with easy access to highways and rail lines would be a priority. "We'd be looking at aging medium-sized ports south of Boston and north of Jacksonville," he added. A Middle East- based source said the investments would be backed by debt, which would be linked to the port assets, adding that Qatar was in early discussions with banks to look for a structuring adviser. The banks being approached included Morgan Stanley, HSBC and Credit Suisse, two of the sources said. (Reuters) QSE appoints Tamim Hamad Al Kuwari as new Chief Executive – The Board of Directors of the Qatar Stock Exchange (QSE) has issued a decision appointing Tamim Hamad Al Kuwari, as CEO of the Qatar Stock Exchange, to succeed Rashid bin Ali Al Mansoori. Pursuant to the decision, Kuwari will assume the position of QSE’s CEO as of Monday, December 20, 2021, while the services of Mansoori will end as will be referred to retirement due to reaching the legally defined standard retirement age, QSE said in a statement on Sunday. Kuwari and Mansoori will retain their positions as members of the Board of QSE. It should be noted that Mr. Tamim Hamad Al-Kuwari previously was the CEO of QINVEST from 2012-2021. In addition to his role as CEO, Tamim serves as an independent board member in “Msheireb Properties” and “Qatar Stock Exchange”. Prior to joining Qinvest, Tamim was an MD in Goldman Sachs and CEO of the Qatar Office, from 2007 to 2012. Prior to joining Goldman Sachs, Tamim was the Chief Financial Officer for Qatargas Transport Company, Nakilat, where he successfully implemented an US$ 8 billion program to finance 27 liquefied natural gas (LNG) vessels that ship LNG from Ras Laffan to customers worldwide. Prior joining Nakilat, Tamim served as the treasurer for the Qatargas Company. Earlier in his career he also worked as a trader at QNB Group, where he traded a range of financial products. Tamim has over 20 years of experience in investment banking and executing transactions, having worked at a number of leading Qatari and international institutions. (QSE) Qatar Airways issues legal proceedings against Airbus – Qatar Airways said it has issued legal proceedings against Airbus at the High Court in London regarding alleged issues with Airbus A350 aircraft. “We have sadly failed in all our attempts to reach a constructive solution with Airbus in relation to the accelerated surface degradation condition adversely impacting the Airbus A350 aircraft, Qatar Airways said in an emailed statement. “Qatar Airways currently have 21 A350 aircraft grounded by the condition and the legal proceedings have been commenced to ensure that Airbus will now address our legitimate concerns without further delay”. (Bloomberg)
- 3. Page 3 of 6 Qatar Stock Exchange Top Gainers Top Decliners Source: Qatar Stock Exchange (QSE) Source: Qatar Stock Exchange (QSE) Most Active Shares by Value (QR Million) Most Active Shares by Volume (Million) Source: Qatar Stock Exchange (QSE) Source: Qatar Stock Exchange (QSE) Investor Trading Percentage to Total Value Traded Net Traded Value by Nationality (QR Million) Source: Qatar Stock Exchange (QSE) Source: Qatar Stock Exchange (QSE) 2.2% 1.5% 1.2% 1.2% 1.1% 0.0% 0.8% 1.6% 2.4% Industries Qatar QNB Group Qatar Islamic Insurance Company Qatar Gas Transport Company Limited Qatar Cinema & Film Distribution Company -8.5% -7.1% -7.0% -6.3% -6.1% -12.0% -8.0% -4.0% 0.0% Ahli Bank Islamic Holding Group Alijarah Holding Qatar Oman Investment Company Dlala Brokerage & Investment Holding Company 183.8 87.6 69.3 69.1 65.1 0.0 70.0 140.0 210.0 QNB Group Masraf Al Rayan The Commercial Bank Gulf International Services Salam International Investment Limited 77.7 42.2 41.1 39.8 23.3 0.0 30.0 60.0 90.0 Salam International Investment Limited Mazaya Qatar Real Estate Development Gulf International Services Investment Holding Group Qatar Aluminium Manufacturing Company 0% 20% 40% 60% 80% 100% Buy Sell 28.32% 33.44% 20.30% 30.19% 14.57% 14.50% 36.81% 21.88% Qatari Individuals Qatari Institutions Non-Qatari Individuals Non-Qatari Institutions 564 596 738 422 -174 174 -400 -200 0 200 400 600 800 Qatari Non-Qatari Net Investment Total Sold Total Bought
- 4. Page 4 of 6 TECHNICAL ANALYSIS OF THE QSE INDEX Source: Bloomberg The QE Index closed marginally higher at 11,696.47 (+0.1% from the week before). The past couple of weeks showed positive moves on higher volumes, and the uptrend remains intact. The current trend remains up and healthy. Our expected support level remains at 11,400 points, and the resistance at 12,000 points. DEFINITIONS OF KEY TERMS USED IN TECHNICAL ANALYSIS RSI (Relative Strength Index) indicator – RSI is a momentum oscillator that measures the speed and change of price movements. The RSI oscillates between 0 to 100. The index is deemed to be overbought once the RSI approaches the 70 level, indicating that a correction is likely. On the other hand, if the RSI approaches 30, it is an indication that the index may be getting oversold and therefore likely to bounce back. MACD (Moving Average Convergence Divergence) indicator – The indicator consists of the MACD line and a signal line. The divergence or the convergence of the MACD line with the signal line indicates the strength in the momentum during the uptrend or downtrend, as the case may be. When the MACD crosses the signal line from below and trades above it, it gives a positive indication. The reverse is the situation for a bearish trend. Candlestick chart – A candlestick chart is a price chart that displays the high, low, open, and close for a security. The ‘body’ of the chart is portion between the open and close price, while the high and low intraday movements form the ‘shadow’. The candlestick may represent any time frame. We use a one-day candlestick chart (every candlestick represents one trading day) in our analysis. Doji candlestick pattern – A Doji candlestick is formed when a security's open and close are practically equal. The pattern indicates indecisiveness, and based on preceding price actions and future confirmation, may indicate a bullish or bearish trend reversal. Shooting Star/Inverted Hammer candlestick patterns – These candlestick patterns have a small real body (open price and close price are near to each other), and a long upper shadow (large intraday movement on the upside). The Shooting Star is a bearish reversal pattern that forms after a rally. The Inverted Hammer looks exactly like a Shooting Star, but forms after a downtrend. Inverted Hammers represent a potential bullish trend reversal.
- 5. Page 5 of 6 Source: Bloomberg Company Name Price December 23 % Change WTD % Change YTD Market Cap. QR Million TTM P/E P/B Div. Yield Qatar National Bank 20.19 1.46 13.24 186,483 15.8 2.3 2.2 Qatar Islamic Bank 18.23 0.16 6.55 43,076 13.6 2.2 2.2 Commercial Bank of Qatar 6.70 0.07 52.23 27,109 13.1 1.4 1.5 Doha Bank 2.95 (0.91) 24.63 9,146 14.6 0.9 2.5 Al Ahli Bank 3.65 (8.52) 5.89 8,868 12.6 1.4 4.0 Qatar International Islamic Bank 9.38 (0.28) 3.57 14,191 15.9 2.2 3.5 Masraf Al Rayan 4.87 (1.42) 7.51 45,291 16.4 2.5 3.5 Qatar First Bank 1.78 (1.28) 3.25 1,244 10.5 2.3 N/A National Leasing 0.92 (7.01) (26.31) 453 18.2 0.7 2.7 Dlala Holding 1.30 (6.14) (27.58) 369 23.9 1.6 N/A Qatar & Oman Investment 0.81 (6.26) (8.91) 255 45.1 0.9 N/A Islamic Holding Group 3.98 (7.14) (22.17) 226 39.9 1.6 1.3 Banking and Financial Services 336,711 Zad Holding 15.97 0.44 17.82 4,163 21.5 2.8 4.0 Qatar German Co. for Medical Devices 3.25 (5.63) 45.28 375 123.1 11.3 N/A Salam International Investment 0.81 (6.00) 25.04 931 N/A 0.6 N/A Baladna 1.45 (2.09) (18.99) 2,756 N/A 1.2 3.7 Medicare Group 8.23 (1.19) (6.91) 2,316 25.7 2.3 21.9 Qatar Cinema & Film Distribution 3.52 1.15 (11.85) 221 72.0 1.6 2.8 Qatar Fuel 17.65 (0.68) (5.51) 17,549 17.3 2.0 2.6 Qatar Meat and Livestock 3.62 (0.88) (42.77) 651 N/A 2.0 2.8 Mannai Corp. 4.79 0.93 59.80 2,187 5.4 1.0 0.2 Al Meera Consumer Goods 19.23 (0.36) (7.15) 3,846 21.3 2.6 4.7 Consumer Goods and Services 34,996 Qatar Industrial Manufacturing 3.05 (1.61) (4.95) 1,449 11.8 0.9 3.3 Qatar National Cement 5.15 (0.02) 24.07 3,365 14.2 1.1 3.9 Industries Qatar 15.47 2.25 42.32 93,594 14.1 2.5 2.1 Qatari Investors Group 2.22 (3.85) 22.81 2,765 20.1 1.0 2.7 Qatar Electricity and Water 16.49 (1.67) (7.62) 18,139 13.8 1.6 3.8 Aamal 1.03 (3.67) 19.88 6,458 26.9 0.8 3.9 Gulf International Services 1.69 (2.71) (1.57) 3,137 N/A 1.0 N/A Mesaieed Petrochemical Holding 2.19 (1.79) 6.99 27,513 16.8 1.6 1.8 Invesment Holding Group 1.25 (4.29) 108.68 1,038 52.2 1.2 N/A Qatar Aluminum Manufacturing 1.84 (0.05) 90.07 10,256 17.0 1.7 1.9 Industrials 167,714 Qatar Insurance 2.60 0.78 10.08 8,492 16.0 1.0 N/A QLM Life & Medical Insurance 4.97 0.40 N/A 1,740 N/A 2.9 N/A Doha Insurance 1.91 (1.80) 36.85 953 13.6 0.8 5.2 Qatar General Insurance & Reinsurance 2.00 (1.91) (24.81) 1,750 13.6 0.3 N/A Al Khaleej Takaful Insurance 3.62 (5.70) 90.78 924 19.0 1.8 1.4 Qatar Islamic Insurance 7.99 1.22 15.72 1,198 15.5 2.9 4.1 Insurance 15,056 United Development 1.59 (2.70) (4.17) 5,616 18.2 0.5 3.2 Barw a Real Estate 3.19 (0.31) (6.20) 12,413 10.1 0.6 3.9 Ezdan Real Estate 1.38 (4.56) (22.30) 36,604 95.2 1.1 N/A Mazaya Qatar Real Estate Development 0.94 (5.91) (25.57) 1,088 35.4 0.9 3.2 Real Estate 55,722 Ooredoo 6.84 (0.07) (9.11) 21,894 N/A 1.1 3.7 Vodafone Qatar 1.65 0.55 23.08 6,966 26.8 1.6 3.0 Telecoms 28,860 Qatar Navigation (Milaha) 7.60 (0.01) 7.13 8,703 26.3 0.6 3.9 Gulf Warehousing 4.53 (2.62) (11.18) 265 11.6 1.3 2.2 Qatar Gas Transport (Nakilat) 3.32 1.16 4.34 18,383 14.4 2.2 3.3 Transportation 27,351 Qatar Exchange 668,797
- 6. Contacts QNB Financial Services Co. W.L.L. Contact Center: (+974) 4476 6666 info@qnbfs.com.qa Doha, Qatar Saugata Sarkar, CFA, CAIA Shahan Keushgerian Head of Research Senior Research Analyst saugata.sarkar@qnbfs.com.qa shahan.keushgerian@qnbfs.com.qa Disclaimer and Copyright Notice: This publication has been prepared by QNB Financial Services Co. W.L.L. (“QNBFS”) a wholly-owned subsidiary of Qatar National Bank (Q.P.S.C.). QNB FS is regulated by the Qatar Financial Markets Authority and the Qatar Exchange. Qatar National Bank (Q.P.S.C.) is regulated by the Qatar Central Bank. This publication expresses the views and opinions of QNBFS at a given time only. It is not an offer, promotion or recommendation to buy or sell securities or other investments, nor is it intended to constitute legal, tax, accounting, or financial advice. QNBFS accepts no liability whatsoever for any direct or indirect losses arising from use of this report. Any investment decision should depend on the individual circumstances of the investor and be based on specifically engaged investment advice. We therefore strongly advise potential investors to seek independent professional advice before making any investment decision. Although the information in this report has been obtained from sources that QNBFS believes to be reliable, we have not independently verified such information and it may not be accurate or complete. QNBFS does not make any representations or warranties as to the accuracy and completeness of the information it may contain, and declines any liability in that respect. For reports dealing with Technical Analysis, expressed opinions and/or recommendations may be different or contrary to the opinions/recommendations of QNBFS Fundamental Research as a result of depending solely on the historical technical data (price and volume). QNBFS reserves the right to amend the views and opinions expressed in this publication at any time. It may also express viewpoints or make investment decisions that differ significantly from, or even contradict, the views and opinions included in this report. This report may not be reproduced in whole or in part without permission from QNBFS. COPYRIGHT: No part of this document may be reproduced without the explicit written permission of QNBFS. Page 6 of 6