1. Page 1 of 5
Market Review and Outlook QE Index and Volume
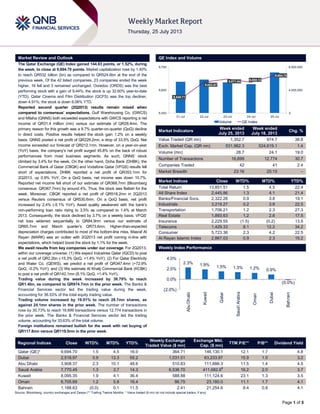
The Qatar Exchange (QE) Index gained 144.83 points, or 1.52%, during
the week, to close at 9,694.70 points. Market capitalization rose by 1.40%
to reach QR532 billion (bn) as compared to QR524.6bn at the end of the
previous week. Of the 42 listed companies, 23 companies ended the week
higher, 16 fell and 3 remained unchanged. Ooredoo (ORDS) was the best
performing stock with a gain of 9.44%; the stock is up 32.60% year-to-date
(YTD). Qatar Cinema and Film Distribution (QCFS) was the top decliner,
down 4.91%; the stock is down 8.08% YTD.
Reported second quarter (2Q2013) results remain mixed when
compared to consensus’ expectations. Gulf Warehousing Co. (GWCS)
and Milaha (QNNS) both exceeded expectations with GWCS reporting a net
income of QR31.4 million (mn) versus our estimate of QR28.4mn. The
primary reason for this growth was a 9.7% quarter-on-quarter (QoQ) decline
in direct costs. Positive results helped the stock gain 1.2% on a weekly
basis. QNNS posted a net profit of QR229.2mn, a drop of 33.5% QoQ. Net
income exceeded our forecast of QR212.1mn. However, on a year-on-year
(YoY) basis, the company‟s net profit surged 45.8% on the back of robust
performances from most business segments. As such, QNNS‟ stock
climbed by 3.4% for the week. On the other hand, Doha Bank (DHBK), the
Commercial Bank of Qatar (CBQK) and Vodafone Qatar (VFQS) results fell
short of expectations. DHBK reported a net profit of QR353.1mn for
2Q2013, up 0.9% YoY. On a QoQ basis, net income was down 10.7%.
Reported net income fell short of our estimate of QR368.7mn (Bloomberg
consensus: QR367.7mn) by around 4%. Thus, the stock was flattish for the
week. Moreover, CBQK reported a net profit of QR518.2mn in 2Q2013
versus Reuters consensus of QR530.6mn. On a QoQ basis, net profit
increased by 2.4% (-5.1% YoY). Asset quality weakened with the bank‟s
non-performing loan ratio rising to 3.5% as compared to 1.4% at March
2013. Consequently, the stock declined by 3.7% on a weekly basis. VFQS‟
net loss widened sequentially to QR84.9mn versus our estimate of
QR65.7mn and March quarter‟s QR73.6mn. Higher-than-expected
depreciation charges contributed to most of the bottom-line miss. Masraf Al
Rayan (MARK) was an outlier with 2Q2013 net profit coming in-line with
expectations, which helped boost the stock by 1.1% for the week.
We await results from key companies under our coverage. For 2Q2013,
within our coverage universe: (1) We expect Industries Qatar (IQCD) to post
a net profit of QR2.2bn (-15.3% QoQ, +1.4% YoY); (2) For Qatar Electricity
and Water Co. (QEWS), we predict a net profit of QR347.4mn (+72.9%
QoQ, -0.2% YoY); and (3) We estimate Al Khalij Commercial Bank (KCBK)
to post a net profit of QR142.1mn (8.1% QoQ, +1.4% YoY).
Trading value during the week increased by 38.79% to reach
QR1.4bn, as compared to QR974.7mn in the prior week. The Banks &
Financial Services sector led the trading value during the week,
accounting for 36.53% of the total equity trading value.
Trading volume increased by 19.01% to reach 28.7mn shares, as
against 24.1mn shares in the prior week. The number of transactions
rose by 30.73% to reach 16,699 transactions versus 12,774 transactions in
the prior week. The Banks & Financial Services sector led the trading
volume, accounting for 33.63% of the total volume.
Foreign institutions remained bullish for the week with net buying of
QR117.8mn versus QR119.5mn in the prior week.
Market Indicators
Week ended
July 25, 2013
Week ended
July 18, 2013
Chg. %
Value Traded (QR mn) 1,352.7 974.7 38.8
Exch. Market Cap. (QR mn) 531,962.3 524,619.1 1.4
Volume (mn) 28.7 24.1 19.0
Number of Transactions 16,699 12,774 30.7
Companies Traded 42 41 2.4
Market Breadth 23:16 25:15 –
Market Indices Close WTD% MTD% YTD%
Total Return 13,851.51 1.5 4.5 22.4
All Share Index 2,445.86 1.3 4.1 21.4
Banks/Financial Svcs. 2,322.26 0.9 3.8 19.1
Industrials 3,219.27 0.2 3.8 22.5
Transportation 1,706.21 1.2 2.3 27.3
Real Estate 1,893.63 1.2 2.6 17.5
Insurance 2,229.55 (1.5) (0.2) 13.5
Telecoms 1,429.33 8.1 12.2 34.2
Consumer 5,723.36 2.3 4.2 22.5
Al Rayan Islamic Index 2,867.03 0.9 2.3 15.2
Market Indices
Weekly Index Performance
Regional Indices Close WTD% MTD% YTD%
Weekly Exchange
Traded Value ($ mn)
Exchange Mkt.
Cap. ($ mn)
TTM P/E** P/B** Dividend Yield
Qatar (QE)* 9,694.70 1.5 4.5 16.0 364.71 146,130.1 12.1 1.7 4.8
Dubai 2,518.97 0.9 13.3 55.2 1,031.01 63,233.97 15.9 1.0 3.2
Abu Dhabi 3,908.37 2.3 10.1 48.6 510.83 111,886.3 11.5 1.4 4.5
Saudi Arabia 7,770.45 1.3 3.7 14.3 6,536.70 411,682.6#
16.2 2.0 3.7
Kuwait 8,095.35 1.9 4.1 36.4 588.88 111,124.6 23.1 1.3 3.5
Oman 6,705.69 1.2 5.8 16.4 86.75 23,180.0 11.1 1.7 4.1
Bahrain 1,188.63 (0.0) 0.1 11.5 2.41 21,254.6 8.4 0.8 4.1
Source: Bloomberg, country exchanges and Zawya (** Trailing Twelve Months; * Value traded ($ mn) do not include special trades, if any)
9,540.71
9,652.67
9,671.84
9,650.12
9,694.70
0
4,000,000
8,000,000
9,450
9,600
9,750
21-Jul 22-Jul 23-Jul 24-Jul 25-Jul
Volume QE Index
2.3% 1.9% 1.5% 1.3% 1.2% 0.9%
(0.0%)
(2.0%)
0.0%
2.0%
4.0%
AbuDhabi
Kuwait
Qatar
SaudiArabia
Oman
Dubai
Bahrain
2. Page 2 of 5
News
Economic News
Qatar monthly banking update – Deposits increased by 4.8%
MoM (+16.8% YTD), while loans increased by 1.0% MoM
(+6.6% YTD) in June 2013. However, the banking sector‟s
loan-to-deposit ratio (LDR) fell to 102% in June 2013 versus
105% at the end of May 2013. (QCB)
Market & Corporate News
DHBK’s 2Q2013 net income falls somewhat shy of our
estimate but operating income broadly in line with our
model. Doha Bank (DHBK) reported a net profit of QR353.1mn
for 2Q2013, up 0.9% YoY. On a QoQ basis, net income was
down 10.7%. Reported net income fell short of our estimate of
QR368.7mn (Bloomberg Consensus; QR367.7mn) by around
4% with the delta being other charges below the operating
income line; operating income came in at QR630.1mn vs. our
estimate of QR635.8mn, a difference of just 1%. The QoQ drop
in net income was mainly due to a 71.6% contraction in
investment income. Nevertheless, Doha Bank‟s 2Q2013 net
interest income expanded by 9.0% QoQ (+13.2% YoY) while
net fees and commissions gained by 9.5% QoQ (+25.1% YoY).
On the other hand. Provisions for loan losses was flattish QoQ
but surged by 46.1% YoY. The loan book grew by 5.1% QoQ
(+7.1 YTD) while deposits gained by 2.6% QoQ (-1% YTD).
This led to a LTD of 106.2% vs. 103.7% in 1Q2012. (DHBK,
QE, QNBFS Research)
MARK’s 2Q2013 net profit up 5.1% QoQ. MARK reported a
net income to shareholders of QR420.6mn vs. our estimate of
QR417.3mn and Bloomberg consensus of QR418.8mn. The
growth came on the back of lower provisions of QR0.031mn in
2Q2013 vs. QR26.2mn in 1Q2013. Income from financing
activities increased by 0.7% QoQ, while profit to investment
account holders declined by 7.1%. Hence, net financing income
improved by 3.7% QoQ. The decline in financing cost could be
an initial sign of net interest margins improving in 2H2013.
However, income from investing activities declined by 3.7%
QoQ to offset some of this benefit of improvement in net
financing income. Growth in loans has kept pace with growth in
deposits thus far this year. The loan book grew by 2.0% QoQ
(+3.3 YTD) while deposits gained by 2.0% QoQ (3.2% YTD).
Thus, the LDR has remained flattish at 95% since December
2012. Regarding the loan book, we believe the recent news of
Barwa Real Estate Co. (BRES) selling ~QR26bn worth of real
estate assets to Qatari Diar will not result in any unexpected
loan repayments to MARK. We maintain our estimates & our
price target of QR26.77. We have a Market Perform rating on
MARK. We expect the bank to post EPS of QR2.14 and
QR2.37 for 2013 and 2014, respectively. On the DPS front, we
expect cash DPS of QR1.10 and 1.20 for 2013 and 2014,
respectively. (MARK, QE, QNBFS Research)
CBQK’s net profit rises 2.4% QoQ in 2Q2013 – Commercial
Bank of Qatar (CBQK) has reported a net profit of QR518mn in
2Q2013, indicating a QoQ increase of 2.4% (-5.1% YoY). The
bank‟s net profit was up 0.7% YoY to QR1.024bn in 1H2013.
EPS stood at QR4.14 in 1H2013 as compared to QR4.11 in
1H2012. According to a Reuters‟ poll, analysts had projected an
average net profit of QR530.6mn in 2Q2013. Net interest
income declined by 3% YoY in 1H2013 to QR914mn. Total
assets at the end of June 30, 2013 stood at QR85.4bn,
indicating a YTD increase of 7%. Customer loans & advances
rose by 7% YTD to QR52bn, while customer deposits increased
by 13% YTD (+1.1% QoQ) to QR46.9bn. The bank‟s non-
performing loan ratio has risen to 3.49% as at June 30, 2013 as
compared to 1.39% at the end of March 2013. Non-performing
loans rested at QR1.8bn in 1H2013 vs. QR725mn in 1Q2013
(Reuters, AME Info)
VFQS’ net loss widens QoQ – Vodafone Qatar (VFQS)
reported revenue of QR459.3mn for 1QFY2014, only 1% shy of
our estimate of QR466.1mn (+6% QoQ, +31% YoY). Quarterly
ARPU of QR123 was slightly lower than our estimate, while
reported mobile subscribers of 1,149,000 were pretty much in
line with our model. Growth in overall subscribers, data,
postpaid and to an extent, handset sales, helped drive revenue
growth for the quarter. Net loss however widened sequentially
to QR84.9mn vs. our estimate of QR65.7mn and 4QFY2013‟s
QR73.6mn (QR118.3mn loss in June 2012). Higher-than-
expected depreciation charges (QR76.1mn vs. our estimate of
QR68.7mn) contributed to most of the bottom-line miss.
According to management, growth in depreciation reflects
continued network and IT investment. We maintain our
estimates for now but will likely revise our net income
expectations downward due to higher depreciation expenses.
We do not envision any other major model changes and
continue to expect the company to post a full year of net profit
only by FY2016. For revenue, we project QR1.9bn and
QR2.2bn in FY2014 and FY2015 revenue, respectively. Our
EBITDA estimates are unchanged at QR446mn and QR589mn
for FY2014 and FY2015, respectively. Finally, we continue to
expect VFQS to pay QR0.10 in dividends per share in FY2014.
Our estimates factor in VFQS‟ strong subscriber traction but we
remain conservative on our blended ARPU assumptions given
our concerns regarding potential medium-term ARPU pressures
(due to competition and encroachment by unlicensed VoIP
providers). We maintain our Accumulate rating with a price
target of QR10.08. (Vodafone Qatar, QE, QNBFS Research)
GWCS’ 2Q2013 earnings exceed expectations. GWCS
reported net income to shareholders of QR31.43mn vs. our
estimate of QR28.36mn. The primary reason for the growth was
a 9.7% QoQ decline in direct costs, with gross margins
expanding to 40.2% vs. 32.7% in 1Q2013. The increase in
margins is attributable to higher LVQ revenue (Phase 3 came
on-line in 2Q2013), impact of some higher margin contracts
along with some cost reallocations. We maintain our estimates
for now with a price target of QR40.53. We maintain our net
profit estimate of QR105mn for 2013. We expect GWCS to
have a payout ratio in the range of 45% to 55% for the next
three years complemented by some stock dividends (10% to
20%) to preserve capital for expansions.
QNNS’ robust 2Q2013 net profit driven by improved
profitability. Milaha posted net profit of QR229mn for 2Q2013,
a drop of 33.5% QoQ. Net income exceeded our forecast of
QR212mn. As is generally the case, 2nd quarter numbers are
sequentially weaker as the company usually realizes hefty
investment income during the 1st quarter. However, on a YoY
basis, the company‟s net profit surged 45.8% on the back of
robust performance from 1) Offshore (+56.2% YoY; higher
utilization at Halul & two new vessels), 2) Maritime & Logistics
(+45.5% YoY; import/export volume growth) and 3) Capital
(QR62mn vs. QR13mn in 2Q2012; driven by significant
unrealized capital gains). It is worth noting that QNNS reduced
its costs by 11.7% and 16.4% QoQ and YoY, respectively,
which helped it achieve robust growth.
3. Page 3 of 5
Qatar Exchange
Top 5 Gainers Top 5 Decliners
Source: Qatar Exchange (QE) Source: Qatar Exchange (QE)
Most Active Shares by Value (QR Million) Most Active Shares by Volume (Million)
Source: Qatar Exchange (QE) Source: Qatar Exchange (QE)
Investor Trading Percentage to Total Value Traded Net Traded Value by Nationality (QR Million)
Source: Qatar Exchange (QE) Source: Qatar Exchange (QE)
9.4%
4.8%
4.4%
4.0%
3.4%
0.0%
2.5%
5.0%
7.5%
10.0%
Ooredoo Medicare
Group
United
Development
Qatar
Electricity and
Water
Milaha -4.9%
-3.9%
-3.7%
-1.5%
-1.3%
-5.0%
-3.5%
-2.0%
-0.5%
Qatar Cinema
& Film
Distribution
Qatar General
Insurance &
Reinsurance
Commercial
Bank of Qatar
Qatar & Oman
Investment
Qatar
Insurance
128.3
122.8
117.6
111.4
103.0
0.0
60.0
120.0
180.0
United
Development
Industries
Qatar
QNB Group Medicare
Group
Commercial
Bank of Qatar
5.5
3.1
2.3
1.6 1.6
0.0
2.0
4.0
6.0
United
Development
Masraf Al
Rayan
Medicare
Group
Doha Bank Qatar Gas
Transport
(Nakilat)
0%
20%
40%
60%
80%
100%
Buy Sell
39.83%
48.26%
21.76%
21.95%
13.65%
13.74%
24.76%
16.05%
Qatari Individuals Qatari Institutions
Non-Qatari Individuals Non-Qatari Institutions
833
520
950
403
(117)
117
(200) - 200 400 600 800 1,000 1,200
Qatari
Non-Qatari
Net Investment Total Sold Total Bought
4. Page 4 of 5
TECHNICAL ANALYSIS OF THE QE INDEX
Source: Bloomberg
The QE Index continued its upmove last week and tagged another new 52-week high of 9,694.70 to close the week on a strong note, thus indicating
strength. The index respected its ascending trendline support and rebounded on Thursday, thus confirming its bullish move. Moreover, the index breached
two important levels of 9,600.0 and 9,650.0 on the back of large volumes indicating rising buying interest. We believe the current momentum may push the
index higher to test and surpass the 9,700.0 level and start a new wave toward the 9,800.0-9,850.0 level. On the flip side, the ascending trendline support
may be a key area to watch out for any decline next week. If the index penetrates below the trendline support, it may retreat and test the 9,600.0
psychological level. However, any sustained weakness below the 9,600.0 level may lead to selling pressure toward the 9,550.0 level. Meanwhile, the RSI is
moving strongly in the overbought territory, while the MACD is widening away from the signal line in a bullish manner with no immediate trend reversal
signs, suggesting a higher move. Thus, traders may adopt a bullish approach, but keep a close watch near the ascending trendline support for any reversal.
DEFINITIONS OF KEY TERMS USED IN TECHNICAL ANALYSIS
RSI (Relative Strength Index) indicator – RSI is a momentum oscillator that measures the speed and change of price movements. The RSI oscillates
between 0 to 100. The index is deemed to be overbought once the RSI approaches the 70 level, indicating that a correction is likely. On the other hand, if
the RSI approaches 30, it is an indication that the index may be getting oversold and therefore likely to bounce back.
MACD (Moving Average Convergence Divergence) indicator – The indicator consists of the MACD line and a signal line. The divergence or the
convergence of the MACD line with the signal line indicates the strength in the momentum during the uptrend or downtrend, as the case may be. When the
MACD crosses the signal line from below and trades above it, it gives a positive indication. The reverse is the situation for a bearish trend.
Candlestick chart – A candlestick chart is a price chart that displays the high, low, open, and close for a security. The „body‟ of the chart is portion between
the open and close price, while the high and low intraday movements form the „shadow‟. The candlestick may represent any time frame. We use a one-day
candlestick chart (every candlestick represents one trading day) in our analysis.
Doji candlestick pattern – A Doji candlestick is formed when a security's open and close are practically equal. The pattern indicates indecisiveness, and
based on preceding price actions and future confirmation, may indicate a bullish or bearish trend reversal.
Shooting Star/Inverted Hammer candlestick patterns – These candlestick patterns have a small real body (open price and close price are near to each
other), and a long upper shadow (large intraday movement on the upside). The Shooting Star is a bearish reversal pattern that forms after a rally. The
Inverted Hammer looks exactly like a Shooting Star, but forms after a downtrend. Inverted Hammers represent a potential bullish trend reversal.
5. Contacts
Ahmed M. Shehada Keith Whitney Saugata Sarkar Sahbi Kasraoui
Head of Trading Head of Sales Head of Research Manager - HNWI
Tel: (+974) 4476 6535 Tel: (+974) 4476 6533 Tel: (+974) 4476 6534 Tel: (+974) 4476 6544
ahmed.shehada@qnbfs.com.qa keith.whitney@qnbfs.com.qa saugata.sarkar@qnbfs.com.qa sahbi.alkasraoui@qnbfs.com.qa
QNB Financial Services SPC
Contact Center: (+974) 4476 6666
PO Box 24025, Doha, Qatar
DISCLAIMER: This publication has been prepared by QNB Financial Services SPC (“QNBFS”) a wholly-owned subsidiary of Qatar National Bank (“QNB”). QNBFS is regulated by the Qatar
Financial Markets Authority and the Qatar Exchange; QNB is regulated by the Qatar Central Bank. This publication expresses the views and opinions of QNBFS at a given time only. It is not an
offer, promotion or recommendation to buy or sell securities or other investments, nor is it intended to constitute legal, tax, accounting, or financial advice. We therefore strongly advise potential
investors to seek independent professional advice before making any investment decision. Although the information in this report has been obtained from sources that QNBFS believes to be
reliable, we have not independently verified such information and it may not be accurate or complete. While this publication has been prepared with the utmost degree of care by our analysts,
QNBFS does not make any representations warranties as to the accuracy and completeness of the information it may contain, and declines any liability in that respect. QNBFS reserves the right
to amend the views and opinions expressed in this publication at any time. It may also express viewpoints or make investment decisions that differ significantly from, or even contradict, the views
and opinions included in this report.
COPYRIGHT: No part of this document may be reproduced without the explicit written permission of QNBFS.
Page 5 of 5
Source: Bloomberg
Company Name
Price
(July 25)
% Change 5-
Day
% Change
Monthly
Market Cap.
QR Million TTM P/E P/B Div. Yield
Qatar National Bank 170.00 2.41 8.01 118,954 13.3 2.5 3.5
Qatar Islamic Bank 68.10 0.15 0.00 16,092 14.3 1.4 5.5
Commercial Bank of Qatar 69.40 (3.74) (0.43) 17,173 8.4 1.2 8.6
Doha Bank 47.95 0.74 2.24 12,389 8.2 1.2 8.6
Al Ahli Bank 56.00 0.90 (1.75) 7,116 13.7 2.2 5.4
Qatar International Islamic Bank 54.10 0.19 0.37 8,189 11.6 1.7 6.5
Masraf Al Rayan 28.10 1.08 1.81 21,075 13.2 2.2 3.6
Al Khaliji Bank 16.85 0.30 (0.30) 6,066 11.6 1.1 5.9
National Leasing 36.20 1.54 (2.43) 1,791 8.7 1.4 5.5
Dlala Holding 26.90 (1.10) 0.56 597 23.3 2.5 N/A
Qatar & Oman Investment 13.30 (1.48) (2.85) 419 21.3 1.4 3.8
Islamic Holding Group 42.30 0.00 (1.86) 169 27.0 4.1 2.7
Banking and Financial Services 210,030
Zad Holding 61.30 0.49 2.85 802 7.6 0.6 6.5
Qatar German Co. for Medical Devices 16.00 (0.68) (0.44) 185 N/M 1.0 N/A
Salam International Investment 12.84 (0.08) (1.23) 1,468 21.6 0.9 5.5
Medicare Group 48.55 4.75 14.78 1,366 29.6 1.7 3.7
Qatar Cinema & Film Distribution 52.30 (4.91) (4.91) 299 26.2 2.3 3.8
Qatar Fuel 265.50 2.59 4.94 17,249 15.0 3.3 3.8
Qatar Meat and Livestock 63.70 1.11 0.47 1,147 15.2 4.0 6.3
Al Meera Consumer Goods 138.80 3.27 1.61 2,776 18.0 2.3 5.8
Consumer Goods and Services 25,291
Qatar Industrial Manufacturing 51.50 0.39 (4.63) 2,039 10.4 1.7 5.8
Qatar National Cement 100.00 0.00 (3.85) 4,910 11.5 2.2 6.0
Industries Qatar 164.00 (0.49) 4.06 99,220 10.9 3.5 4.7
Qatari Investors Group 28.65 0.53 6.70 3,562 20.8 1.8 2.6
Qatar Electricity and Water 170.50 4.03 7.30 17,050 12.7 3.5 4.3
Mannai Corp. 86.90 0.12 (1.25) 3,964 8.4 1.9 5.5
Aamal 14.28 (0.70) (0.90) 8,568 14.0 1.3 N/A
Gulf International Services 46.00 0.00 11.92 6,839 13.5 2.7 3.3
Industrials 146,153
Qatar Insurance 60.90 (1.30) (0.16) 7,822 6.9 1.4 3.3
Doha Insurance 26.50 (0.19) 3.72 682 12.4 1.4 3.4
Qatar General Insurance & Reinsurance 46.50 (3.93) (0.21) 2,681 14.7 1.0 1.9
Al Khaleej Takaful Insurance 44.50 3.25 0.00 760 10.2 1.4 1.9
Qatar Islamic Insurance 60.30 (0.17) (3.05) 905 15.3 3.8 5.8
Insurance 12,849
United Development 23.90 4.37 3.91 8,060 10.1 0.8 4.2
Barwa Real Estate 27.00 (1.10) 1.69 10,506 12.8 0.8 5.6
Ezdan Real Estate 16.99 (0.18) (2.86) 45,066 N/M 1.6 0.8
Mazaya Qatar Real Estate Development 11.55 1.14 2.03 1,155 21.1 1.1 5.2
Real Estate 64,787
Qatar Telecom 137.90 9.44 14.16 44,172 14.0 1.8 3.6
Vodafone Qatar 9.15 (0.11) 0.55 7,735 N/M 1.3 N/A
Telecoms 51,908
Qatar Navigation (Milaha) 76.00 3.40 5.56 8,704 9.0 0.7 4.9
Gulf Warehousing 42.50 1.19 3.28 2,021 20.9 2.7 N/A
Qatar Gas Transport (Nakilat) 18.25 (0.44) (0.27) 10,220 13.6 3.2 5.5
Transportation 20,945
Qatar Exchange 531,962