QNBFS Weekly Market Report October 29, 2020
•
0 likes•73 views

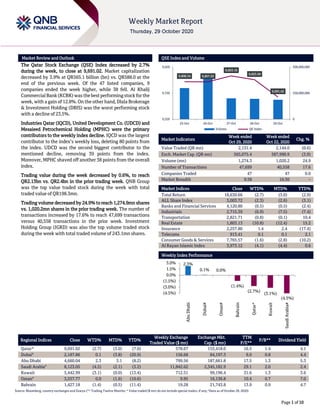
The Qatar Stock Exchange (QSE) Index decreased by 2.7% during the week, to close at 9,691.02

Recommended
More Related Content
What's hot
What's hot (20)
Similar to QNBFS Weekly Market Report October 29, 2020
Similar to QNBFS Weekly Market Report October 29, 2020 (20)
More from QNB Group
More from QNB Group (20)
Recently uploaded
Recently uploaded (20)
QNBFS Weekly Market Report October 29, 2020
- 1. `````` Page 1 of 10 Market Review and Outlook QSE Index and Volume The Qatar Stock Exchange (QSE) Index decreased by 2.7% during the week, to close at 9,691.02. Market capitalization decreased by 3.9% at QR565.1 billion (bn) vs. QR588.0 at the end of the previous week. Of the 47 listed companies, 9 companies ended the week higher, while 38 fell. Al Khalij Commercial Bank (KCBK)was thebest performingstock for the week, with a gain of 12.8%. On the other hand, Dlala Brokerage & Investment Holding (DBIS) was the worst performing stock with a decline of 23.5%. Industries Qatar (IQCD), United Development Co. (UDCD) and Mesaieed Petrochemical Holding (MPHC) were the primary contributors to the weekly index decline. IQCD was the largest contributor to the index’s weekly loss, deleting 80 points from the index. UDCD was the second biggest contributor to the mentioned decline, removing 39 points from the index. Moreover, MPHC shaved off another 38 points from the overall index. Trading value during the week decreased by 0.6%, to reach QR2.13bn vs. QR2.4bn in the prior trading week. QNB Group was the top value traded stock during the week with total traded value of QR198.3mn. Trading volume decreased by 24.9% to reach 1,274.9mn shares vs. 1,020.2mn shares in the prior trading week. The number of transactions increased by 17.6% to reach 47,699 transactions versus 40,558 transactions in the prior week. Investment Holding Group (IGRD) was also the top volume traded stock during the week with total traded volume of 243.1mn shares. Market Indicators Week ended Oct 29, 2020 Week ended Oct 22, 2020 Chg. % Value Traded (QR mn) 2,131.4 2,144.0 (0.6) Exch. Market Cap. (QR mn) 565,075.4 587,990.9 (3.9) Volume (mn) 1,274.3 1,020.2 24.9 Number of Transactions 47,699 40,558 17.6 Companies Traded 47 47 0.0 Market Breadth 9:38 16:30 – Market Indices Close WTD% MTD% YTD% Total Return 18,630.66 (2.7) (3.0) (2.9) ALL Share Index 3,003.72 (2.3) (2.6) (3.1) Banks and Financial Services 4,120.80 (0.5) (0.5) (2.4) Industrials 2,715.39 (6.9) (7.5) (7.4) Transportation 2,821.71 (0.8) (0.1) 10.4 Real Estate 1,803.13 (10.8) (12.4) 15.2 Insurance 2,257.80 1.4 2.4 (17.4) Telecoms 913.41 0.1 0.1 2.1 Consumer Goods & Services 7,765.57 (1.6) (2.8) (10.2) Al Rayan Islamic Index 3,973.12 (4.1) (4.4) 0.6 Weekly Index Performance Regional Indices Close WTD% MTD% YTD% Weekly Exchange Traded Value ($ mn) Exchange Mkt. Cap. ($ mn) TTM P/E** P/B** Dividend Yield Qatar* 9,691.02 (2.7) (3.0) (7.0) 578.67 153,418.0 16.5 1.4 4.1 Dubai# 2,187.86 0.1 (3.8) (20.9) 156.68 84,197.3 9.0 0.8 4.4 Abu Dhabi 4,660.04 2.3 3.1 (8.2) 799.56 187,661.8 17.5 1.3 5.3 Saudi Arabia# 8,123.05 (4.5) (2.1) (3.2) 11,842.62 2,345,182.9 29.1 2.0 2.4 Kuwait 5,442.99 (3.1) (0.0) (13.4) 712.51 99,196.4 31.6 1.3 3.6 Oman# 3,557.77 0.0 (1.6) (10.6) 9.95 16,136.8 10.4 0.7 7.0 Bahrain 1,427.18 (1.4) (0.5) (11.4) 19.28 21,743.8 13.9 0.9 4.7 Source: Bloomberg, country exchanges and Zawya (** Trailing Twelve Months; * Value traded ($ mn) do not include special trades, if any; #Data as of October 28, 2020) 9,808.34 9,807.53 9,853.16 9,823.58 9,691.02 0 250,000,000 500,000,000 9,520 9,720 9,920 25-Oct 26-Oct 27-Oct 28-Oct 29-Oct Volume QE Index 2.3% 0.1% 0.0% (1.4%) (2.7%) (3.1%) (4.5%) (4.5%) (3.0%) (1.5%) 0.0% 1.5% 3.0% AbuDhabi Dubai# Oman# Bahrain Qatar* Kuwait SaudiArabia#
- 2. Page 2 of 10 News Economic, Market & Corporate News CBQK's net profit declines 52.3% YoY and 49.3% QoQ in 3Q2020, below our estimate – The Commercial Bank's (CBQK) net profit declined 52.3% YoY (-49.3% QoQ) to QR253.2mn in 3Q2020, below our estimate of QR417.0mn (variation of - 39.3%). Net interest income increased 4.4% YoY in 3Q2020 to QR752.9mn. However, on QoQ basis Net interest income declined 1.2%. The company's net operating income came in at QR1,077.5mn in 3Q2020, which represents an increase of 7.1% YoY. However, on QoQ basis net operating income fell 1.2%. EPS amounted to QR0.06 in 3Q2020 as compared to QR0.13 in 3Q2019. The bank's total assets stood at QR143.1bn at the end of September 30, 2020, down 1.7% YoY (-0.4% QoQ). Loans and advances to customers were QR90.5bn, registering a rise of 1.5% YoY (+4.0% QoQ) at the end of September 30, 2020. Customer deposits declined 1.6% YoY and 5.9% QoQ to reach QR73.1bn at the end of September 30, 2020. In 9M2020, CBQK posted net profit of QR1,154.4mn as compared to QR1,479.0mn for the same period of the previous year. EPS amounted to QR0.29 for the period ended September 30, 2020 compared to QR0.37 for the same period of the previous year. CBQK Group’s CEO, Joseph Abraham commented, “CBQK has delivered a good set of results given the unusual environment in which we are operating. This is due to our prudent approach and our investments in digital technologies which have enabled us to rapidly adapt to an evolving environment during the COVID-19 pandemic. Net profit before associates and taxes increased by 22.3% to QR1.7bn during the first nine months of 2020 compared to the same period last year, supported by growth in net interest income and improved recoveries during the period. Consolidated net profit for the period was down 22% to QR1.2bn, due to increased impairment of our associate UAB and difficult market conditions in Turkey, which impacted Alternatif Bank’s performance. The domestic Bank reported a net profit of QR1.7bn for the first nine months of 2020, representing an increase of 23.9% compared to the same period last year. Group net interest income for the first nine months of 2020 increased 19.8% to QR2.3bn (normalized 19.2%) compared to the same period last year, despite the current low interest rate environment, as we carefully managed our cost of funding to ensure interest expense declined faster than interest income. This helped offset declines in total fees and other income, which were down 17.9% to QR751mn (normalized 10.3% to QR820.5mn) during the period, driven by investment income volatility. Consolidated operating income increased 7.8% to QR3.1bn (normalized 9.8%) during the first nine months of 2020 compared to the same period last year, supported by improved NIMs and our focus on cost optimization. CBQK’s cost to income ratio improved to 25% (normalized 26.4%) from 28.9% for the same period last year, as we continue to invest in technology to streamline our operations and maintain current opex levels. Gross loan provisioning for the period increased 13.5% compared to the previous year, reflecting our prudent approach of factoring in the COVID-19 impact on our ECL models. This was partially offset by recoveries of QR326.7mn during the period; consequently net loan provisioning was QR487.1mn, down 16.9% compared to the same period last year. Our focus on low cost deposits continues to yield results, with consolidated low-cost deposits growing 14.1% during the period, contributing to the improvement in NIMs.” He added, “Alternatif Bank’s performance for the first nine months of 2020 was impacted by the softening of the Turkish economy and 15.9% depreciation of the Turkish lira. Despite these challenges, Alternatif Bank reported a profit of QR53.6mn during the period. The bank’s customer deposits at the end of the period were QR8.6bn and its loans and advances to customers were QR10.6bn. The impact from our share of associates during the nine months of 2020 was negative as we took impairment on UAB in line with our guidance to bring the book value of the asset closer to its fair value.” (QNB FS Research, QSE, Gulf- Times.com) KCBK posts 25.7% YoY increase but 1.0% QoQ decline in net profit in 3Q2020, above our estimate – Al Khalij Commercial Bank's (KCBK) net profit rose 25.7% YoY (but declined 1.0% on QoQ basis) to QR182.4mn in 3Q2020, above our estimate of QR160.2mn (variation of +13.8%). ‘Net Interest Income’ increased 29.7% YoY and 10.8% QoQ in 3Q2020 to QR339.3mn. The company's ‘Net Operating Income’ came in at QR389.6mn in 3Q2020, which represents an increase of 28.1% YoY (+11.8% QoQ). EPS amounted to QR0.05 in 3Q2020 as compared to QR0.04 in 3Q2019 (2Q2020: QR0.05). The bank's Total Assets stood at QR55.3bn at the end of September 30, 2020, up 8.1% YoY (+2.2% QoQ). ‘Loans and Advances to Customers’ were QR32.6bn, registering a rise of 8.7% YoY (+1.4% QoQ) at the end of September 30, 2020. Customer Deposits rose 10.1% YoY and 3.8% QoQ to reach QR30.1bn at the end of September 30, 2020. In 9M2020, KCBK has posted net profit of QR543.5mn as compared to QR497.3mn for the same period of the previous year. EPS amounted to QR 0.15 in 9M2020 versus QR0.14 for the same period in 2019. The bank’s capital adequacy ratio stood at a healthy 18.6% at the end of the third quarter. These results, the bank noted, reflect an increase in operating income by growing assets and effectively managing margins. KCBK group’s CEO, Fahad Al-Khalifa said, “We are pleased to report a 9% improvement in net profit year on year, which has come about by growing operating income as well as expanding our balance sheet. We continue to grow in our domestic market in Qatar, selectively capitalizing on opportunities and diligently managing our margins. While sequentially growing operating income, we have also ensured that the Group continues to maintain an efficient cost base, improving its cost to income ratio. At the end of the first half of 2020, we had announced exploring a potential merger with Masraf Al Rayan. The potential merger discussions between the two banks are going on as scheduled and we remain committed to informing the public and investors about any significant progress in this regard.” (QNB FS Research, QSE, Gulf-Times.com) QAMC reports net loss of QR2.4mn in 3Q2020, misses our estimate – Qatar Aluminium Manufacturing Company (QAMC) reported net loss of QR2.4mn in 3Q2020 as compared to net profit of QR55.4mn in 3Q2019 and net profit of QR3.9mn in
- 3. Page 3 of 10 2Q2020, missed our net profit estimate of QR34.1mn. Loss from ‘Share of results from a joint venture’ stood at QR0.5mn in 3Q2020 as compared to gain from ‘Share of results from a joint venture’ at QR57.8mn (2Q2020: +QR5.1mn). The company recorded net profit of QR12.3mn in nine-month period ended September 30, 2020 as compared to net profit of QR60.6mn for the period (of ten-months) from December 3, 2018 to September 30, 2019. EPS amounted to QR0.002 for the nine months period ended September 30, 2020, compared to EPS of QR0.011 for the ten months of period ended September 30, 2019. QAMC posted ‘Share of results from a joint venture’ of QR17.8mn for nine months period ended September 30, 2020, compared to QR67.6mn for the period from December 3, 2018 to September 30, 2019. QAMC is a 50% joint venture (JV) partner in a smelter that produces premium quality aluminum products. QAMC's share of revenue shrank 14% YoY to QR1.6bn. The 9M2020 performance continued to be impacted by external macroeconomic factors and also due to the pandemic-led slowdown in major global industries across the automotive, transport jets and construction sectors. Sales volume was however, marginally up 1%, as QAMC’s JV swiftly shifted the production to standard ingots, whereas, the demand for premium aluminum products and alloys used by various industries declined. QAMC’s Chairman, Abdulrahman Ahmad Al-Shaibi said, “Despite of the macroeconomic headwinds affecting the global markets, QAMC continued to rely on its core strengths, based on which its JV managed to remain profitable in a market where global aluminum prices continued to show downwards trends amid unprecedented challenges posed to businesses globally due to COVID-19 pandemic." The weakened demand on the back of economic slowdown and continued production surplus negatively affected the selling prices in 2020. Although, there were some recoveries in prices in the latter part of the third quarter, the overall price sentiments remained negative throughout the 9M2020 period. Its JV’s average selling prices fell 16% YoY, thus negatively affecting the net profits in during the 9M2020 period. This was partially offset by the sales volumes, which positively contributed QR20mn. QAMC’s share of joint venture’s EBITDA stood at QR439mn, down 15% YoY; but EBITDA margins was resilient in the current turbulent market conditions and stood at 27.3% against 27.5% the year-ago period. The company’s JV was able to successfully contain its raw materials, energy, manpower and other direct costs by 12%. The overall decline in cost of goods sold contributed QR191mn positively to the 9M2020 net profits. Its JV has implemented various optimization measures to cut controllable operating costs and defer some capital expenditures, enabling it to optimize its overall costs and conserve cash. QAMC’s share of debt in the JV was down 8% to QR2.2bn, mainly due to principal repayment during the period. QAMC’s financial position continues to remain robust despite several macroeconomic headwinds, with the liquidity reaching QR670mn in cash and bank balances (including proportionate share of cash and bank balances of the joint venture), after accounting for dividend payments for 2019. QAMC’s JV generated positive share of operating cash flows of QR552mn, down 43%; with a share of free cash flows of QR346mn, up 34% against the same period of 2019. (QNB FS Research, QSE, Gulf- Times.com) QIIK's bottom line rises 2.1% YoY and 7.0% QoQ in 3Q2020, in- line with our estimate – Qatar International Islamic Bank's (QIIK) net profit rose 2.1% YoY (+7.0% QoQ) to QR272.0mn in 3Q2020, in line with our estimate of QR264.7mn (variation of +2.7%). ‘Total income from financing & investing activities’ decreased 3.0% YoY in 3Q2020 to QR553.5mn. However, on QoQ basis ‘Total income from financing & investing activities’ gained 7.9%. The company's Total Income came in at QR624.9mn in 3Q2020, which represents an increase of 2.1% YoY (+12.5% QoQ). EPS remained flat YoY at QR0.18 in 3Q2020 (2Q2020: QR0.16). The bank's total assets stood at QR59.3bn at the end of September 30, 2020, up 12.0% YoY (+0.1% QoQ). Financing Assets were QR39.1bn, registering a rise of 22.6% YoY (+11.7% QoQ) at the end of September 30, 2020. Customers' current accounts rose 17.1% YoY and 2.3% QoQ to reach QR7.6bn at the end of September 30, 2020. In 9M2020, QIIK recorded net profit of QR784.6mn as compared to QR777.0mn in 9M2019. EPS amounted to QR0.52 in 9M2020 as compared to QR0.51 for the same period in 2019. QIIK‘s CEO, Abdulbasit Ahmad Al Shaibei said, “The total revenues at the end of the third quarter amounted to QR1.84bn compared to QR1.76bn at the end of the corresponding period last year, a growth of 4.5%. During the third quarter, the bank continued to achieve success in improving operational efficiency as the cost-to-income ratio was 20%. The capital adequacy ratio reached 17.2%, underscoring once again the distinguished financial position of QIIK.” About the bank’s plans, he said, “The focus lately has been on enhancing operational performance, and through the results achieved, we can confirm that we are making tangible progress and aspire for more. The most important response achieved by the bank in facing the market factors was the qualitative evolution in the field of digital transformation. In this area, the bank developed various alternative channels and most services became available through electronic platforms such as mobile banking, internet banking for individuals and companies, ATMs and the call center,” he said. QIIK will continue to focus on the opportunities available in the local market and in various sectors, he said. (QNB FS Research, QSE, Qatar Tribune) VFQS' bottom line rises 50.3% YoY and 37.5% QoQ in 3Q2020, above our estimate – Vodafone Qatar's (VFQS) net profit rose 50.3% YoY (+37.5% QoQ) to QR45.6mn in 3Q2020, above our estimate of QR33.5mn (variation of +36.3%). The company's Revenue came in at QR539.4mn in 3Q2020, which represents an increase of 9.9% YoY (+1.5% QoQ). In 9M2020, VFQS posted net profit of QR126.7mn as compared to QR108.4mn in 9M2019, mainly driven by higher EBITDA. EPS amounted to QR0.030 in 9M2020 as compared to QR0.026 in 9M2019. Total revenue for the period improved by 4% YoY to QR1.6bn following service revenue growth of 4% driven by higher demand for the company’s fixed broadband solutions (GigaHome) and continued growth in its Postpaid subscriber base. EBITDA YoY increased by 12% to reach QR591mn, supported by the higher service revenue and continued cost optimization initiatives. Consequently, EBITDA margin improved by 2.7 percentage points YoY to reach 36.7%, the highest ever in the company’s history. Total mobile customers of the company stood at 1.7mn. (QNB FS Research, QSE, Peninsula Qatar)
- 4. Page 4 of 10 BLDN's bottom line declines 34.5% QoQ in 3Q2020, below our estimate – Baladna (BLDN) reported net profit of QR29.0mn in 3Q2020 as compared to QR44.2mn in 2Q2020 (-34.5% QoQ), below our estimate of QR47.6mn. The company’s Revenue stood at QR182.3mn, which represents QoQ decrease of 11.1%. EPS amounted to QR0.015 in 3Q2020 as compared to QR0.023 in 2Q2020. BLDN reported net profit of QR112.86mn for the period from December 2, 2019, establishment date, to September 30, 2020 (approximately 10 months) and EPS amounted to QR0.061 per share. Correspondingly, the company achieved a strong net profile margin for the ten-month period of approximately 18.1%. Operational improvements continue across the supply chain. In particular, the farming division continues delivering significant productivity gains achieving an average daily milk yield of 36.8 liters per cow for the period compared to 31.2 liters per cow for the same period last year. Retained earnings balance on September 30, 2020 is QR103.2mn after distributing the first interim dividend of QR40.0mn in April 2020. (QNB FS Research, QSE, Peninsula Qatar) IQCD net profit declined 19.2% YoY but rose 0.7% YoY on adjusted basis, ahead of our estimate –Industries Qatar's (IQCD) net profit declined 19.2% YoY (but rose 65.6% on QoQ basis) to QR466.0mn in 3Q2020. However, adjusted net profit (excluding one-offs such as impairment losses on property, plant, equipment and intangible asset) increased 0.7% YoY to QR580.8mn, which was 12.4% ahead of income expectations of QR516.7mn for 3Q2020. The company's Revenue came in at QR1,590.2mn in 3Q2020, which represents an increase of 13.2% YoY. However, on QoQ basis Revenue fell 34.3%. In 9M2020, IQCD posted net profit of QR951.3mn as compared to QR2,036.5mn in 9M2019. Reported EPS amounted to QR0.16 in 9M2020 as compared to QR0.34 in 9M2019. The Group revenue amounted to QR8.0bn (assuming proportionate consolidation), down by 21%, as compared to QR10.2bn for the same period last year. The Group recorded EPS of QR0.16 for the nine months period ended September 30, 2020, as compared to QR0.34 for the same period last year. In line with the requirements of IFRS, 25% of QAFCO’s net profits for the nine months period ended September 30, 2020 have been reported directly as part of the Group’s retained earnings, instead of reporting the same as part of Group’s net profit (attributable to equity holders of the Parent) within the consolidated income statement. When considering the profitability of the Group including 25% of QAFCO’s profits for the nine months period ended September 30, 2020, the net profit (normalized profits) for the period would reach to QR1.1bn, down by 48%, as compared to QR2.0bn for the same period last year. EBITDA for the period reached QR2.6bn, compared to QR3.2bn for the same period of last year. Year-to- date financial performance was impacted by several factors including the pandemic, weaker crude prices and a notable decline in product demand owing to weaker GDP growth, lack of infrastructure investments and subdued consumer & industrial participation. These adverse conditions directly translated into declining commodity prices, where blended selling prices declined by 10% versus last year, translating into a reduction of QR0.9bn inGroup’s earnings (normalized). The major reduction was noted in the petrochemicals segment which accounted for QR0.6bn, while fertilizer segment accounted for QR0.3bn of the total reduction. Group sales volumes declined by 20% versus nine months period of 2019, driven by a combination of reasons including weaker demand, lower production on account of facilities’ mothballing in the steel segment and periodic planned and unplanned maintenance. The decline in sales volumes was also attributed to a temporary sales & operating arrangement for QAFCO trains 1-4 until July 31, 2020, where sales volumes relating to QAFCO trains 1-4 were not recognized in the IQ books. The temporary sales & operating arrangement has now been replaced with a unified Gas Sales and Purchase Agreement (GSPA) covering QAFCO trains 1-6 and Qatar Melamine Company (QMC) with Qatar Petroleum, effective from August 1, 2020. The new GSPA was part of a bundled deal, along with the acquisition of 25% stake in QAFCO. This new agreement will now allow IQ to recognize the sales volumes of QAFCO trains 1-4, going forward. The new GSPA is expected to bring additional financial benefits to the Group driven via improved profitability margins. The Group’s profitability was also impacted due to booking of one-off impairment loss amounting to QR1.2bn recognized in relation to mothballing of certain Qatar Steel’s production facilities and QR153mn of impairment loss booked in relation to QMC facilities, as the melamine prices continue to remain under pressure. These one-off impairment losses were partially offset by a fair value gain recognized amounting to QR1.2bn in relation to 75% stake in QAFCO, as the Group now controls the company. The original stake QAFCO (75%) was previously accounted for by the Group as a joint venture using the equity accounting method. In line with the requirements of International Financial Reporting Standards (IFRS), since QAFCO is now a 100% owned subsidiary, at the date of reclassification of investment in QAFCO as a subsidiary i.e. January 01, 2020, the Group was required to re-measure its investment in QAFCO to its acquisition-date fair value. Compared to the previous quarter of 2020, the Group revenue and net profit (normalized) increased by 22% and 50% respectively. The recovery was mainly attributed to the improved product prices in the current quarter. This sequential increase in prices across key products was noted on the back of crude price recovery, supply shortages due to back-to-back hurricanes in the US causing disruptions for many producers and an overall deferral of new capacity additions amid uncertainties as a result of the spread of COVID-19 pandemic. On the demand side, recent recoveries were evident amid continuous unprecedented stimulus and lifting of lockdown in major markets. Operating costs also have generally declined in line with the optimization initiatives implemented across the Group. Production volumes also improved during the quarter, as there were no major shutdowns during the quarter. The Group’s financial position continue to remain robust despite several macro-economic headwinds, with the liquidity position at the end of September 30, 2020 reaching QR8.86bn in cash and bank balances, after accounting for a QR2.4bn dividend payment for 2019 and cash paid for the QAFCO transaction (net of cash acquired along with acquisition). Currently, the Group has no debt obligations. Group’s total assets and total equity reached QR35.2bn and QR32.9bn, respectively, as at September 30, 2020.During the period, the Group generated positive operating cash flows of QR2.5bn, with a free cash flow of QR2.18bn. IQ’s ability to generate positive operating cash flows in such distressed market conditions is a testament to Group’s efficient
- 5. Page 5 of 10 cash flow generation capabilities, effective cost structure and robust working capital management, which could safeguard the Group against any unexpected adversities. (QNB FS Research, Company Press Release, QSE) DHBK posts 9.7% YoY decrease but 53.3% QoQ increase in net profit in 3Q2020, above our estimate – Doha Bank's (DHBK) net profit declined 9.7% YoY (but rose 53.3% on QoQ basis) to QR270.8mn in 3Q2020, above our estimate of QR227.1mn (variation of +19.3%). Net interest income increased 18.1% YoY and 20.4% QoQ in 3Q2020 to QR630.3mn. The company's net operating income came in at QR788.4mn in 3Q2020, which remained almost flat YoY (+16% QoQ). EPS amounted to QR0.09 in 3Q2020 as compared to QR0.10 in 3Q2019 (2Q2020: QR0.06). The bank's total assets stood at QR106.5bn at the end of September 30, 2020, down 0.3% YoY (-1.5% QoQ). Loans and advances to customers were QR63.1bn, registering a fall of 2.9% YoY at the end of September 30, 2020. However, on QoQ basis loans and advances to customers increased 1.1%. Customer deposits declined 5.2% YoY and 0.4% QoQ to reach QR55.8bn at the end of September 30, 2020. In 9M2020, DHBK recorded net profit of QR771.5mn compared to QR818.5mn in 9M2019. EQS amounted to QR0.25 in 9M2020 as compared to QR0.26 in 9M2019. DHBK’s Chairman of the Board Of Directors, Sheikh Fahad bin Mohammad bin Jabor Al Thani said that the bank has made significant progress in improving the cost management and efficient utilization of resources where the operating cost for the period improved by 3.3% as compared to same period last year thus reducing the cost to income ratio to 30.5% from 33.6% showing bank’s productive operational performance. He also pointed out that the total financial investment portfolio stood at QR25.4bn as compared to QR27.8bn for the same period in 2019. DHBK’s Managing Director, Sheikh Abdul Rehman bin Mohammad bin Jabor Al Thani said, “The total shareholder’s equity stood at QR13.8bn as on September 30, 2020 registering a growth of 2.3%. The bank continued to strengthen its key capitalization ratios, where the total capital adequacy ratio of the bank increased to 18.38% as on September 30, 2020 from 16.85% as compared to the same period last year. The bank, given the scale of its operations, has achieved a return on the average assets of 0.96% as on September 30, 2020”. (QNB FS Research, QSE, Peninsula Qatar) ORDS' bottom line rises 53.2% YoY and 50.5% QoQ in 3Q2020 – Ooredoo's (ORDS) net profit rose 53.2% YoY (+50.5% QoQ) to QR649.8mn in 3Q2020.The company's Revenue came in at QR7,295.9mn in 3Q2020, which represents a decrease of 2.2% YoY. However, on QoQ basis Revenue rose 6.9%. EPS amounted to QR0.20 in 3Q2020 as compared to QR0.13 in 3Q2019 and (2Q2020: QR0.13). In 9M2020, ORDS recorded net profit of QR1,468.2mn as compared to QR1,265.2mn in 9M2019. EPS amounted to QR0.46 in 9M2020 compared to QR0.39 in 9M2019. Ooredoo Group continues to witness strong demand for its product and services, as demonstrated by the 3% increase in its customer base to 119mn during the challenging times, supported by strong customer growth in Indonesia and Myanmar. Driven by a favorable foreign exchange environment, Ooredoo Group’s nine-month net profit jumped 16% YoY to QR1.5bn. Group’s revenue declined by 3% YoY to QR21.4bn in the nine-month period up to September, due to the COVID-19 pandemic impact, with a reduction in handset sales and roaming business as well as macroeconomic weakness in some of our markets. This was partially offset by growth in Indonesia. EBITDA declined by 4% YoY to QR9.2bn in the nine- month period, impacted by lower revenues and higher cost of sales as well as challenging market conditions in Algeria, Kuwait, Iraq and Oman. The company maintains its focus on digitalization and cost optimization, which is reflected in the strong EBITDA margin for the 9M2020 and 3Q2020 periods. Data revenues account for more than 50% of total revenue driven by Ooredoo's data leadership and digital transformation initiatives across the countries it operates. Ooredoo Group said it has healthy cash reserve and liquidity levels to be able to absorb the impact of COVID-19 pandemic. Indosat Ooredoo reported revenue growth of 6% as it implemented its strategy of offering simple, relevant, and transparent products. Ooredoo Kuwait experienced revenue growth in 3Q2020 over 2Q2020, Ooredoo Algeria showed signs off an improved market situation in the recent months. Ooredoo Oman increased 5G coverage further, while Asiacell is preparing for the launch of LTE in 2021. Ooredoo Tunisia improved its mobile data leadership position and in our home market in Qatar, we improved revenue sequentially and year on year in 3Q2020. Ooredoo Group’s CEO, Sheikh Saud bin Nasser Al-Thani said, “Ooredoo Group reported a healthy set of results, despite challenging circumstances due to the COVID-19 pandemic. Group revenues for the first nine months of 2020 were QR21bn, down 3% compared to the same period last year, due to macroeconomic weaknesses in some of our markets that were partially offset by a robust performance in Indonesia.” He added, “We continued to focus of optimizing our cost base to absorb some of the pressure from the decline in revenues. For the first nine months of 2020, group EBITDA declined 4% to QR9.2bn, compared to the same period last year, due the declinein revenues. However, group net profit increased 16% during the same period, benefiting from FX gains in certain markets. Ooredoo Group continues to witness strong demand for its product and services, as demonstrated by the 3% increase in our customer base to 119mn during these challenging times, supported by strong customer growth in Indonesia and Myanmar.” (Company Press Release, QSE, Gulf-Times.com) AHCS' bottom line declines 6.2% YoY in 3Q2020, above our estimate – Aamal Company (AHCS) reported net profit of QR71.2mn in 3Q2020 as compared to net profit of QR75.9mn in 3Q2019 (-6.2% YoY) and net loss of QR62.2mn in 2Q2020, above our estimate of QR54.3mn. The company's Revenue came in at QR338.0mn in 3Q2020, which represents an increase of 9.3% YoY (+30.0% QoQ). In 9M2020, AHCS reported net profit of QR91.6mn as compared to QR257.8mn in 9M2019. EPS amounted to QR0.01 in 9M2020 as compared to QR0.04 in 9M2019. Despite the challenging market conditions presented by the pandemic and the strong competition, the trading and distribution segment delivered a commendable performance with revenue and net profit expanding 26% and 18%, respectively, largely attributable to Ebn Sina Medical, which recorded a significant increase in orders. Meanwhile, the industrial manufacturing segment has started seeing signs of improvement in the levels of project activity, as Qatar prepare to host the 2022 FIFA World Cup. Aamal Cables won a major three-year contract with Kahramaa, the sole transmission and distribution system owner and operator for the electricity and
- 6. Page 6 of 10 water segments in Qatar, to supply 11KV medium voltage and pilot power cables. "This significant contract, worth QR694mn over three years, demonstrates our strong competitive positioning in the sector. Theindustrial manufacturing segment recorded top line growth of 23.8% YoY driven by new contract wins, although pricing and margins remained under pressure from continuing acute competition at Aamal Readymix. The performance of the property segment continued to be impacted by the waiving of rents for commercial tenants at both City Center Doha and Souk Al Harraj, a decision that it took to support the tenants during these challenging times. In the managed services segment, Aamal Services has been impacted by reduced demand for hospitality and facilities management services, whilst other businesses such as Fun City and Winter Wonderland remained closed as a result of COVID-19-related restrictions imposed by the Qatari government. AHCS’ CEO and Managing Director, Sheikh Mohamed bin Faisal Al-Thani said, “We expect conditions to remain challenging throughout the remainder of 2020 as uncertainty prevails around the COVID-19 pandemic, its progression, severity and duration. Notwithstanding the uncertainty in global markets, in the longer term, there are significant opportunities across all four of Aamal’s segments." Sheikh Mohamed said he is confident that the diversification of the business model and the strength of the balance sheet would ensure the group will remain well- positioned to grasp opportunities as the market recovers. (QNB FS Research, QSE, Gulf-Times.com) MPHC's bottom line rises 3.5% YoY and 150.4% QoQ in 3Q2020 – Mesaieed Petrochemical Holding Company's (MPHC) net profit rose 3.5% YoY (+150.4% QoQ) to QR195.4mn in 3Q2020.The company's ‘Share of profit from joint ventures’ came in at QR192.1mn in 3Q2020, which represents an increase of 7.5% YoY (+155.4% QoQ). In 9M2020, MPHC recorded net profit of QR330.5mn as compared to QR493.4mn in 9M2019. EPS amounted to QR0.026 in 9M2020 as compared to QR0.039 in 9M2019. The YoY financial performance was impacted by current global macroeconomics, including unprecedented adversities amid COVID-19 outbreak. These external forces, outside the group’s control, exerted pressure on the product prices, and witnessed a decline by 20% YoY basis. On QoQ basis, the group’s revenue and net profits increased by 36% and 150% respectively, mainly attributed to the improved product prices in the current quarter. The group’s sales volumes declined 11% YoY, driven by a combination of reasons including lockdowns of key market geographies, weaker demand and lower production due to periodic planned maintenance shutdowns. The decline in selling prices and sales volumes, on a combined basis, contributed to a decrease of QR659mn in the net profits during the review period. MPHC continued to benefit from the supply of competitively priced feedstock, under long-term supply agreements. These contracting arrangements are an important value driver for the group’s performance in a competitive market environment. The feedstock cost savings on lowered unit prices and volumes contributed QR136mn to the bottom- line earnings for the nine months period. The petrochemicals segment reported total revenue of QR1.2bn, a decrease of 30% and net profit amounted to QR237mn, with a decline of 66% compared to the same period last year. The revenue and earnings were impacted by a drop in sales volumes by 13% and selling prices by 20%. The reduction in sales volumes was primarily due to the planned periodic turnaround of QChem-II facilities during the first quarter of 2020, while decline in selling prices was attributed to softening demand for petrochemical products arising from the current macroeconomic backdrop. The production volumes dropped by 13% compared to 9M2019, amid periodic planned turnarounds, which are necessary to maintain the plant life and ensure health safety and environment standards. The chlor-alkali segment revenue declined 25% to QR377mn due to 8% fall in sales volumes and 19% in selling prices. Sales volumes were down due to the planned shutdown of the facilities in 1Q2020 and non- availability of access to the core markets for chlor-alkali products, due to COIVID-19 lockdowns in the first part of the April-June this year. Accordingly, net profit shrank 70% to QR42mn. Liquidity remained robust as cash and cash equivalents of MPHC amounted to QR1.6bn. The total assets reached QR15.9bn at the end of September 30, 2020. (QSE, Peninsula Qatar) UDCD's net profit declines 90.4% YoY and 76.1% QoQ in 3Q2020 – United Development Company's (UDCD) net profit declined 90.4% YoY (-76.1% QoQ) to QR9.0mn in 3Q2020. The company's Revenue came in at QR285.9mn in 3Q2020, which represents a decrease of 33.3% YoY. However, on QoQ basis Revenue rose 6.9%. In 9M2020, UDCD posted net profit of QR96.0mn as compared to QR318.9mn in 9M2019. EPS amounted to QR0.027 in 9M2020 as compared to QR0.090 in 9M2019. In spite of the pandemic’s negative impact, UDCD has been actively pursuing development activities at The Pearl-Qatar and Gewan Island, while maintaining quality, safety, and environmental standards, which ensures UDC’s sustainable growth and creates new opportunities and revenue sources over the long term. UDCD has also achieved major strides in the development of Gewan Island with four major concrete pours completed on Crystal Residence’s 15 mixed-use buildings, marking the completion of more than a third of the total land area, in addition to ongoing dredging and infrastructure activities throughout the Island. The reopening of beaches, mosques, retail stores, and restaurants has resulted in an increase in visitor influx and consequently commercial activity, UDCD stated. (QSE, Qatar Tribune, Gulf-Times.com) MERS posts 14.9% YoY increase but 41.9% QoQ decline in net profit in 3Q2020 – Al Meera Consumer Goods Company's (MERS) net profit rose 14.9% YoY (but declined 41.9% on QoQ basis) to QR32.9mn in 3Q2020.The company's Sales came in at QR758.5mn in 3Q2020, which represents an increase of 12.4% YoY. However, on QoQ basis Sales fell 25.7%. In 9M2020, MERS posted net profit of QR140.1mn as compared to QR123.6mn in 9M2019. EPS amounted to QR0.70 in 9M2020 as compared to QR0.62 in 9M2019. (QSE, Gulf-Times.com)
- 7. Page 7 of 10 Qatar Stock Exchange Top Gainers Top Decliners Source: Qatar Stock Exchange (QSE) Source: Qatar Stock Exchange (QSE) Most Active Shares by Value (QR Million) Most Active Shares by Volume (Million) Source: Qatar Stock Exchange (QSE) Source: Qatar Stock Exchange (QSE) Investor Trading Percentage to Total Value Traded Net Traded Value by Nationality (QR Million) Source: Qatar Stock Exchange (QSE) Source: Qatar Stock Exchange (QSE) 12.5% 4.1% 1.8% 1.5% 0.8% 0.0% 5.0% 10.0% 15.0% Al Khalij Commercial Bank Qatar General Insurance & Reinsurance Company Masraf Al Rayan Qatar Insurance Company Vodafone Qatar -23.5% -19.3% -18.3% -17.1% -16.9% -30.0% -20.0% -10.0% 0.0% Dlala Brokerage & Investment Holding Company Qatari German Company for Medical Devices Ezdan Holding Group Qatar Aluminium Manufacturing Company Salam International Investment Limited 198.3 149.6 144.4 134.2 132.0 0.0 70.0 140.0 210.0 QNB Group Masraf Al Rayan Qatar Aluminium Manufacturing Company Ezdan Holding Group Investment Holding Group 243.1 161.6 155.8 93.7 74.0 0.0 90.0 180.0 270.0 Investment Holding Group Salam International Investment Limited Qatar Aluminium Manufacturing Company Mazaya Qatar Real Estate Development Ezdan Holding Group 0% 20% 40% 60% 80% 100% Buy Sell 47.49% 50.31% 18.21% 13.71% 17.46% 18.96% 16.83% 17.01% Qatari Individuals Qatari Institutions Non-Qatari Individuals Non-Qatari Institutions 1,400 731 1,365 767 36 -36 -500 0 500 1,000 1,500 Qatari Non-Qatari Net Investment Total Sold Total Bought
- 8. Page 8 of 10 TECHNICAL ANALYSIS OF THE QSE INDEX Source: Bloomberg The QSE Index lost 2.68% from last week, and closed at the 9,691.02 level. The Index dipped below the uptrend line, which was a lower side of the rising wedge formation, confirming the probable correction we were anticipating. The Index remains above its 200-day moving average, which could act as a support level, but we target the 9,500 as the next possible support from here. DEFINITIONS OF KEY TERMS USED IN TECHNICAL ANALYSIS RSI (Relative Strength Index) indicator – RSI is a momentum oscillator that measures the speedand change of price movements. The RSI oscillates between 0 to 100. The index is deemed to be overbought once the RSI approaches the 70 level, indicating that a correction is likely. On the other hand, if the RSI approaches 30, it is an indication that the index may be getting oversold and therefore likely to bounce back. MACD (Moving Average Convergence Divergence) indicator – The indicator consists of the MACD line and a signal line. The divergence or the convergence of the MACD line with the signal line indicates the strength in the momentum during the uptrend or downtrend, as the case may be. When the MACD crosses the signal line from below and trades above it, it gives a positive indication. The reverse is the situation for a bearish trend. Candlestick chart – A candlestick chart is a price chart that displays the high, low, open, and close for a security. The ‘body’ of the chart is portion between the open and close price, while the high and low intraday movements form the ‘shadow’. The candlestick may represent any time frame. We use a one-day candlestick chart (every candlestick represents one trading day) in our analysis. Doji candlestick pattern – A Doji candlestick is formed when a security's open and close are practically equal. The pattern indicates indecisiveness, and based on preceding price actions and future confirmation, may indicate a bullish or bearish trend reversal. ShootingStar/Inverted Hammer candlestick patterns – These candlestick patterns have a small real body (open price and close price are near to each other), and a long upper shadow (large intraday movement on the upside). The Shooting Star is a bearish reversal pattern that forms after a rally. The Inverted Hammer looks exactly like a Shooting Star, but forms after a downtrend. Inverted Hammers represent a potential bullish trend reversal.
- 9. Page 9 of 10 Source: Bloomberg Company Name Price October 29 % Change WTD % Change YTD Market Cap. QR Million TTM P/E P/B Div. Yield Qatar National Bank 17.70 (0.56) (14.04) 163,485 15.0 2.2 3.4 Qatar Islamic Bank 16.20 (2.06) 5.68 38,279 13.5 2.2 3.2 Commercial Bank of Qatar 4.25 (0.23) (9.57) 17,201 11.9 1.0 4.7 Doha Bank 2.43 (0.82) (3.95) 7,534 15.4 0.8 N/A Al Ahli Bank 3.20 (1.54) (3.97) 7,777 12.3 1.3 4.5 Qatar International Islamic Bank 8.30 (1.06) (14.25) 12,565 14.2 2.1 5.1 Masraf Al Rayan 4.30 1.80 8.46 32,213 14.7 2.3 5.2 Al Khaliji Bank 1.80 12.51 37.33 6,476 10.2 1.0 4.2 Qatar First Bank 1.62 (11.48) 98.04 1,134 N/A 2.3 N/A National Leasing 1.14 (11.06) 61.99 565 21.1 0.8 4.4 Dlala Holding 1.65 (23.48) 170.38 469 N/A 2.3 N/A Qatar & Oman Investment 0.80 (2.81) 18.98 251 19.9 0.9 2.5 Islamic Holding Group 3.60 (14.33) 89.37 204 37.0 1.4 N/A Banking and Financial Services 288,154 Zad Holding 15.00 (0.07) 8.54 3,555 17.5 2.5 5.7 Qatar German Co. for Medical Devices 1.61 (19.30) 177.32 186 N/A 6.2 N/A Salam International Investment 0.56 (16.87) 7.74 637 N/A 0.4 N/A Baladna 1.89 (6.72) 88.90 3,591 N/A 1.6 1.1 Medicare Group 8.60 0.41 1.78 2,420 29.5 2.4 20.9 Qatar Cinema & Film Distribution 3.51 (8.03) 59.36 220 50.3 0.2 2.9 Qatar Fuel 17.20 (0.35) (24.89) 17,101 22.0 2.1 4.7 Qatar Meat and Livestock 6.82 (2.53) 0.93 1,228 14.3 3.0 4.4 Mannai Corp. 2.81 (5.01) (8.93) 1,280 N/A 0.6 7.1 Al Meera Consumer Goods 20.00 0.35 30.72 4,000 19.8 2.9 4.3 Consumer Goods and Services 34,219 Qatar Industrial Manufacturing 3.05 (8.68) (14.57) 1,449 18.1 0.9 4.9 Qatar National Cement 3.86 (1.23) (31.61) 2,525 20.8 0.9 7.8 Industries Qatar 9.02 (6.96) (12.31) 54,541 37.2 1.7 4.4 Qatari Investors Group 1.76 (7.17) (1.68) 2,188 28.0 0.8 3.1 Qatar Electricity and Water 16.70 (1.59) 3.79 18,370 12.3 2.0 4.6 Aamal 0.80 (13.98) (1.60) 5,040 32.4 0.7 5.0 Gulf International Services 1.54 (4.00) (10.76) 2,853 41.3 0.8 N/A Mesaieed Petrochemical Holding 1.86 (10.39) (26.10) 23,305 22.5 1.5 3.8 Invesment Holding Group 0.54 (9.73) (4.61) 447 10.4 0.6 N/A Qatar Aluminum Manufacturing 0.86 (17.08) 10.63 4,821 N/A 0.8 1.2 Industrials 115,539 Qatar Insurance 2.30 1.46 (27.22) 7,512 N/A 1.0 6.5 Doha Insurance 1.16 0.61 (3.75) 578 11.2 0.6 6.9 Qatar General Insurance & Reinsurance 2.30 4.07 (6.50) 2,013 N/A 0.4 N/A Al Khaleej Takaful Insurance 1.90 (2.11) (5.05) 485 15.0 0.9 2.6 Qatar Islamic Insurance 6.31 (1.50) (5.48) 947 13.2 2.6 5.9 Insurance 11,534 United Development 1.48 (14.97) (2.43) 5,251 26.2 0.5 3.4 Barw a Real Estate 3.33 (3.59) (5.85) 12,970 9.1 0.7 6.0 Ezdan Real Estate 1.69 (18.32) 174.80 44,827 N/A 1.4 N/A Mazaya Qatar Real Estate Development 1.00 (13.62) 39.36 1,160 38.8 0.1 N/A Real Estate 64,208 Ooredoo 6.63 (0.15) (6.36) 21,237 11.2 0.9 3.8 Vodafone Qatar 1.30 0.78 12.07 5,495 34.2 1.2 3.8 Telecoms 26,732 Qatar Navigation (Milaha) 6.00 0.77 (1.64) 6,872 13.3 0.5 5.0 Gulf Warehousing 4.98 (2.37) (9.22) 292 12.3 1.6 4.0 Qatar Gas Transport (Nakilat) 2.69 (1.65) 12.55 14,903 12.7 2.5 3.7 Transportation 22,066 Qatar Exchange 565,075
- 10. Contacts Saugata Sarkar, CFA, CAIA Shahan Keushgerian Zaid al-Nafoosi , CMT, CFTe Head of Research Senior Research Analyst Senior Research Analyst Tel: (+974) 4476 6534 Tel: (+974) 4476 6509 Tel: (+974) 4476 6535 saugata.sarkar@qnbfs.com.qa shahan.keushgerian@qnbfs.com.qa zaid.alnafoosi@qnbfs.com.qa Mehmet Aksoy, PhD QNB Financial Services Co. W.L.L. Senior Research Analyst Contact Center: (+974) 4476 6666 Tel: (+974) 4476 6589 PO Box 24025 mehmet.aksoy@qnbfs.com.qa Doha, Qatar Disclaimer and Copyright Notice: This publication has been prepared by QNB Financial Services Co. W.L.L. (“QNB FS”) a wholly-owned subsidiary of Qatar National Bank (Q.P.S.C.). QNB FS is regulated by the Qatar Financial Markets Authority and the Qatar Exchange. Qatar National Bank (Q.P.S.C.) is regulated by the Qatar Central Bank. This publication expresses the views and opinions of QNB FS at a given time only. It is not an offer, promotion or recommendation to buy or sell securities or other investments, nor is it intended to constitute legal, tax, accounting, or financial advice. QNB FS accepts no liability whatsoever for any direct or indirect losses arising from use of this report. Any investment decision should depend on the individual circumstances of the investor and be based on specifically engaged investment advice. We therefore strongly advise potential investors to seek independent professional advice before making any investment decision. Although the information in this report has been obtained from sources that QNB FS believes to be reliable, we have not independently verified such information and it may not be accurate or complete. QNB FS does not make any representations or warranties as to the accuracy and completeness of the information it may contain, and declines any liability in that respect. For reports dealing with Technical Analysis, expressed opinions and/or recommendations may be different or contrary to the opinions/recommendations of QNB FS Fundamental Research as a result of depending solely on the historical technical data (price and volume). QNB FS reserves the right to amend the views and opinions expressed in this publication at any time. It may also express viewpoints or make investment decisions that differ significantly from, or even contradict, the views and opinions included in this report. This report may not be reproduced in whole or in part without permission from QNB FS COPYRIGHT: No part of this document may be reproduced without the explicit written permission of QNB FS. Page 10 of 10