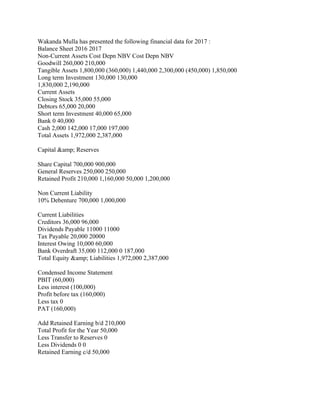
Wakanda Mulla has presented the following financial data for 2017 :
Balance Sheet 2016 2017
Non-Current Assets Cost Depn NBV Cost Depn NBV
Goodwill 260,000 210,000
Tangible Assets 1,800,000 (360,000) 1,440,000 2,300,000 (450,000) 1,850,000
Long term Investment 130,000 130,000
1,830,000 2,190,000
Current Assets
Closing Stock 35,000 55,000
Debtors 65,000 20,000
Short term Investment 40,000 65,000
Bank 0 40,000
Cash 2,000 142,000 17,000 197,000
Total Assets 1,972,000 2,387,000
Capital & Reserves
Share Capital 700,000 900,000
General Reserves 250,000 250,000
Retained Profit 210,000 1,160,000 50,000 1,200,000
Non Current Liability
10% Debenture 700,000 1,000,000
Current Liabilities
Creditors 36,000 96,000
Dividends Payable 11000 11000
Tax Payable 20,000 20000
Interest Owing 10,000 60,000
Bank Overdraft 35,000 112,000 0 187,000
Total Equity & Liabilities 1,972,000 2,387,000
Condensed Income Statement
PBIT (60,000)
Less interest (100,000)
Profit before tax (160,000)
Less tax 0
PAT (160,000)
Add Retained Earning b/d 210,000
Total Profit for the Year 50,000
Less Transfer to Reserves 0
Less Dividends 0 0
Retained Earning c/d 50,000
Tangible asset costing $80,000 with depreciation of $25,000 was sold for a loss of $55,000.
Required :
a. Prepare the cash flow statement for the year 2017
b. Select appropriate items in the cash flow to comment on the state of liquidity and
profitability of the company.
Incoming and Outgoing Shipments in 2 STEPS Using Odoo 17
Wakanda Mulla has presented the following financial data for 2017 - Ba.pdf
1. Wakanda Mulla has presented the following financial data for 2017 :
Balance Sheet 2016 2017
Non-Current Assets Cost Depn NBV Cost Depn NBV
Goodwill 260,000 210,000
Tangible Assets 1,800,000 (360,000) 1,440,000 2,300,000 (450,000) 1,850,000
Long term Investment 130,000 130,000
1,830,000 2,190,000
Current Assets
Closing Stock 35,000 55,000
Debtors 65,000 20,000
Short term Investment 40,000 65,000
Bank 0 40,000
Cash 2,000 142,000 17,000 197,000
Total Assets 1,972,000 2,387,000
Capital & Reserves
Share Capital 700,000 900,000
General Reserves 250,000 250,000
Retained Profit 210,000 1,160,000 50,000 1,200,000
Non Current Liability
10% Debenture 700,000 1,000,000
Current Liabilities
Creditors 36,000 96,000
Dividends Payable 11000 11000
Tax Payable 20,000 20000
Interest Owing 10,000 60,000
Bank Overdraft 35,000 112,000 0 187,000
Total Equity & Liabilities 1,972,000 2,387,000
Condensed Income Statement
PBIT (60,000)
Less interest (100,000)
Profit before tax (160,000)
Less tax 0
PAT (160,000)
Add Retained Earning b/d 210,000
Total Profit for the Year 50,000
Less Transfer to Reserves 0
Less Dividends 0 0
Retained Earning c/d 50,000
2. Tangible asset costing $80,000 with depreciation of $25,000 was sold for a loss of $55,000.
Required :
a. Prepare the cash flow statement for the year 2017
b. Select appropriate items in the cash flow to comment on the state of liquidity and
profitability of the company