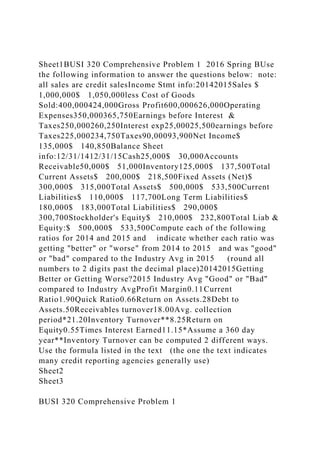
Sheet1BUSI 320 Comprehensive Problem 1 2016 Spring BUse the following information to answer the questions below: note: all sales are credit salesIncome Stmt info:20142015Sales $ 1,000,000$ 1,050,000less Cost of Goods Sold:400,000424,000Gross Profit600,000626,000Operating Expenses350,000365,750Earnings before Interest & Taxes250,000260,250Interest exp25,00025,500earnings before Taxes225,000234,750Taxes90,00093,900Net Income$ 135,000$ 140,850Balance Sheet info:12/31/1412/31/15Cash25,000$ 30,000Accounts Receivable50,000$ 51,000Inventory125,000$ 137,500Total Current Assets$ 200,000$ 218,500Fixed Assets (Net)$ 300,000$ 315,000Total Assets$ 500,000$ 533,500Current Liabilities$ 110,000$ 117,700Long Term Liabilities$ 180,000$ 183,000Total Liabilities$ 290,000$ 300,700Stockholder's Equity$ 210,000$ 232,800Total Liab & Equity:$ 500,000$ 533,500Compute each of the following ratios for 2014 and 2015 and indicate whether each ratio was getting "better" or "worse" from 2014 to 2015 and was "good" or "bad" compared to the Industry Avg in 2015 (round all numbers to 2 digits past the decimal place)20142015Getting Better or Getting Worse?2015 Industry Avg "Good" or "Bad" compared to Industry AvgProfit Margin0.11Current Ratio1.90Quick Ratio0.66Return on Assets.28Debt to Assets.50Receivables turnover18.00Avg. collection period*21.20Inventory Turnover**8.25Return on Equity0.55Times Interest Earned11.15*Assume a 360 day year**Inventory Turnover can be computed 2 different ways. Use the formula listed in the text (the one the text indicates many credit reporting agencies generally use)
Sheet2
Sheet3
BUSI 320 Comprehensive Problem 1
Use the following information to answer the questions below:
note: all sales are credit sales
Income Stmt info:
2013
2014
Sales
$ 1,050,000
$ 1,128,750
less Cost of Goods Sold:
325,000
346,125
Gross Profit
725,000
782,625
Operating Expenses
575,000
609,500
Earnings before Interest & Taxes
150,000
173,125
Interest exp
25,000
29,000
earnings before Taxes
125,000
144,125
Taxes
50,000
57,650
Net Income
$ 75,000
$ 86,475
Balance Sheet info:
12/31/2013
12/31/2014
Cash
60,000
$ 66,000
Accounts Receivable
80,000
$ 83,200
Inventory
110,000
$ 119,900
Total Current Assets
$ 250,000
$ 269,100
Fixed Assets (Net)
$ 300,000
$ 318,000
Total Assets
$ 550,000
$ 587,100
Current Liabilities
$ 130,000
$ 136,500
Long Term Liabilities
$ 150,000
$ 170,000
Total.
Sheet1BUSI 320 Comprehensive Problem 1 2016 Spring BUse the follo.docx
1. Sheet1BUSI 320 Comprehensive Problem 1 2016 Spring BUse
the following information to answer the questions below: note:
all sales are credit salesIncome Stmt info:20142015Sales $
1,000,000$ 1,050,000less Cost of Goods
Sold:400,000424,000Gross Profit600,000626,000Operating
Expenses350,000365,750Earnings before Interest &
Taxes250,000260,250Interest exp25,00025,500earnings before
Taxes225,000234,750Taxes90,00093,900Net Income$
135,000$ 140,850Balance Sheet
info:12/31/1412/31/15Cash25,000$ 30,000Accounts
Receivable50,000$ 51,000Inventory125,000$ 137,500Total
Current Assets$ 200,000$ 218,500Fixed Assets (Net)$
300,000$ 315,000Total Assets$ 500,000$ 533,500Current
Liabilities$ 110,000$ 117,700Long Term Liabilities$
180,000$ 183,000Total Liabilities$ 290,000$
300,700Stockholder's Equity$ 210,000$ 232,800Total Liab &
Equity:$ 500,000$ 533,500Compute each of the following
ratios for 2014 and 2015 and indicate whether each ratio was
getting "better" or "worse" from 2014 to 2015 and was "good"
or "bad" compared to the Industry Avg in 2015 (round all
numbers to 2 digits past the decimal place)20142015Getting
Better or Getting Worse?2015 Industry Avg "Good" or "Bad"
compared to Industry AvgProfit Margin0.11Current
Ratio1.90Quick Ratio0.66Return on Assets.28Debt to
Assets.50Receivables turnover18.00Avg. collection
period*21.20Inventory Turnover**8.25Return on
Equity0.55Times Interest Earned11.15*Assume a 360 day
year**Inventory Turnover can be computed 2 different ways.
Use the formula listed in the text (the one the text indicates
many credit reporting agencies generally use)
Sheet2
Sheet3
BUSI 320 Comprehensive Problem 1
2. Use the following information to answer the questions below:
note: all sales are credit sales
Income Stmt info:
2013
2014
Sales
$ 1,050,000
$ 1,128,750
less Cost of Goods Sold:
325,000
346,125
Gross Profit
725,000
782,625
Operating Expenses
575,000
609,500
Earnings before Interest & Taxes
150,000
173,125
Interest exp
25,000
4. Total Current Assets
$ 250,000
$ 269,100
Fixed Assets (Net)
$ 300,000
$ 318,000
Total Assets
$ 550,000
$ 587,100
Current Liabilities
$ 130,000
$ 136,500
Long Term Liabilities
$ 150,000
$ 170,000
Total Liabilities
$ 280,000
$ 306,500
Stockholder's Equity
$ 270,000
$ 280,600
Total Liab & Equity:
$ 550,000
$ 587,100
5. Compute each of the following ratios for 2013 and 2014 and
indicate whether each ratio was getting "better" or "worse"
from 2013 to 2014
and whether the 2014 ratio was "good" or "bad" compared to
the Industry Avg.
(round all numbers to 2 digits past the decimal place)
2013
2014
Getting Better or Getting Worse?
2014 Industry Avg
"Good" or "Bad" compared to Industry Avg
Profit Margin
0.11
Current Ratio
6. 1.90
Quick Ratio
1.12
Return on Assets
.26
Debt to Assets
.55
Receivables turnover
18.00
Avg. collection period*
21.20
Inventory Turnover**
7. 8.25
Return on Equity
0.25
Times Interest Earned
8.15
*Assume a 360 day year
**Inventory Turnover can be computed 2 different ways. Use
the formula listed in the text
(the one the text indicates many credit reporting agencies
generally use)