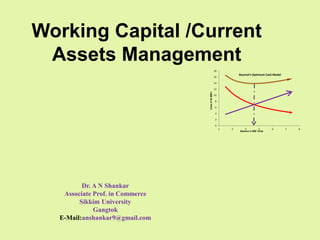
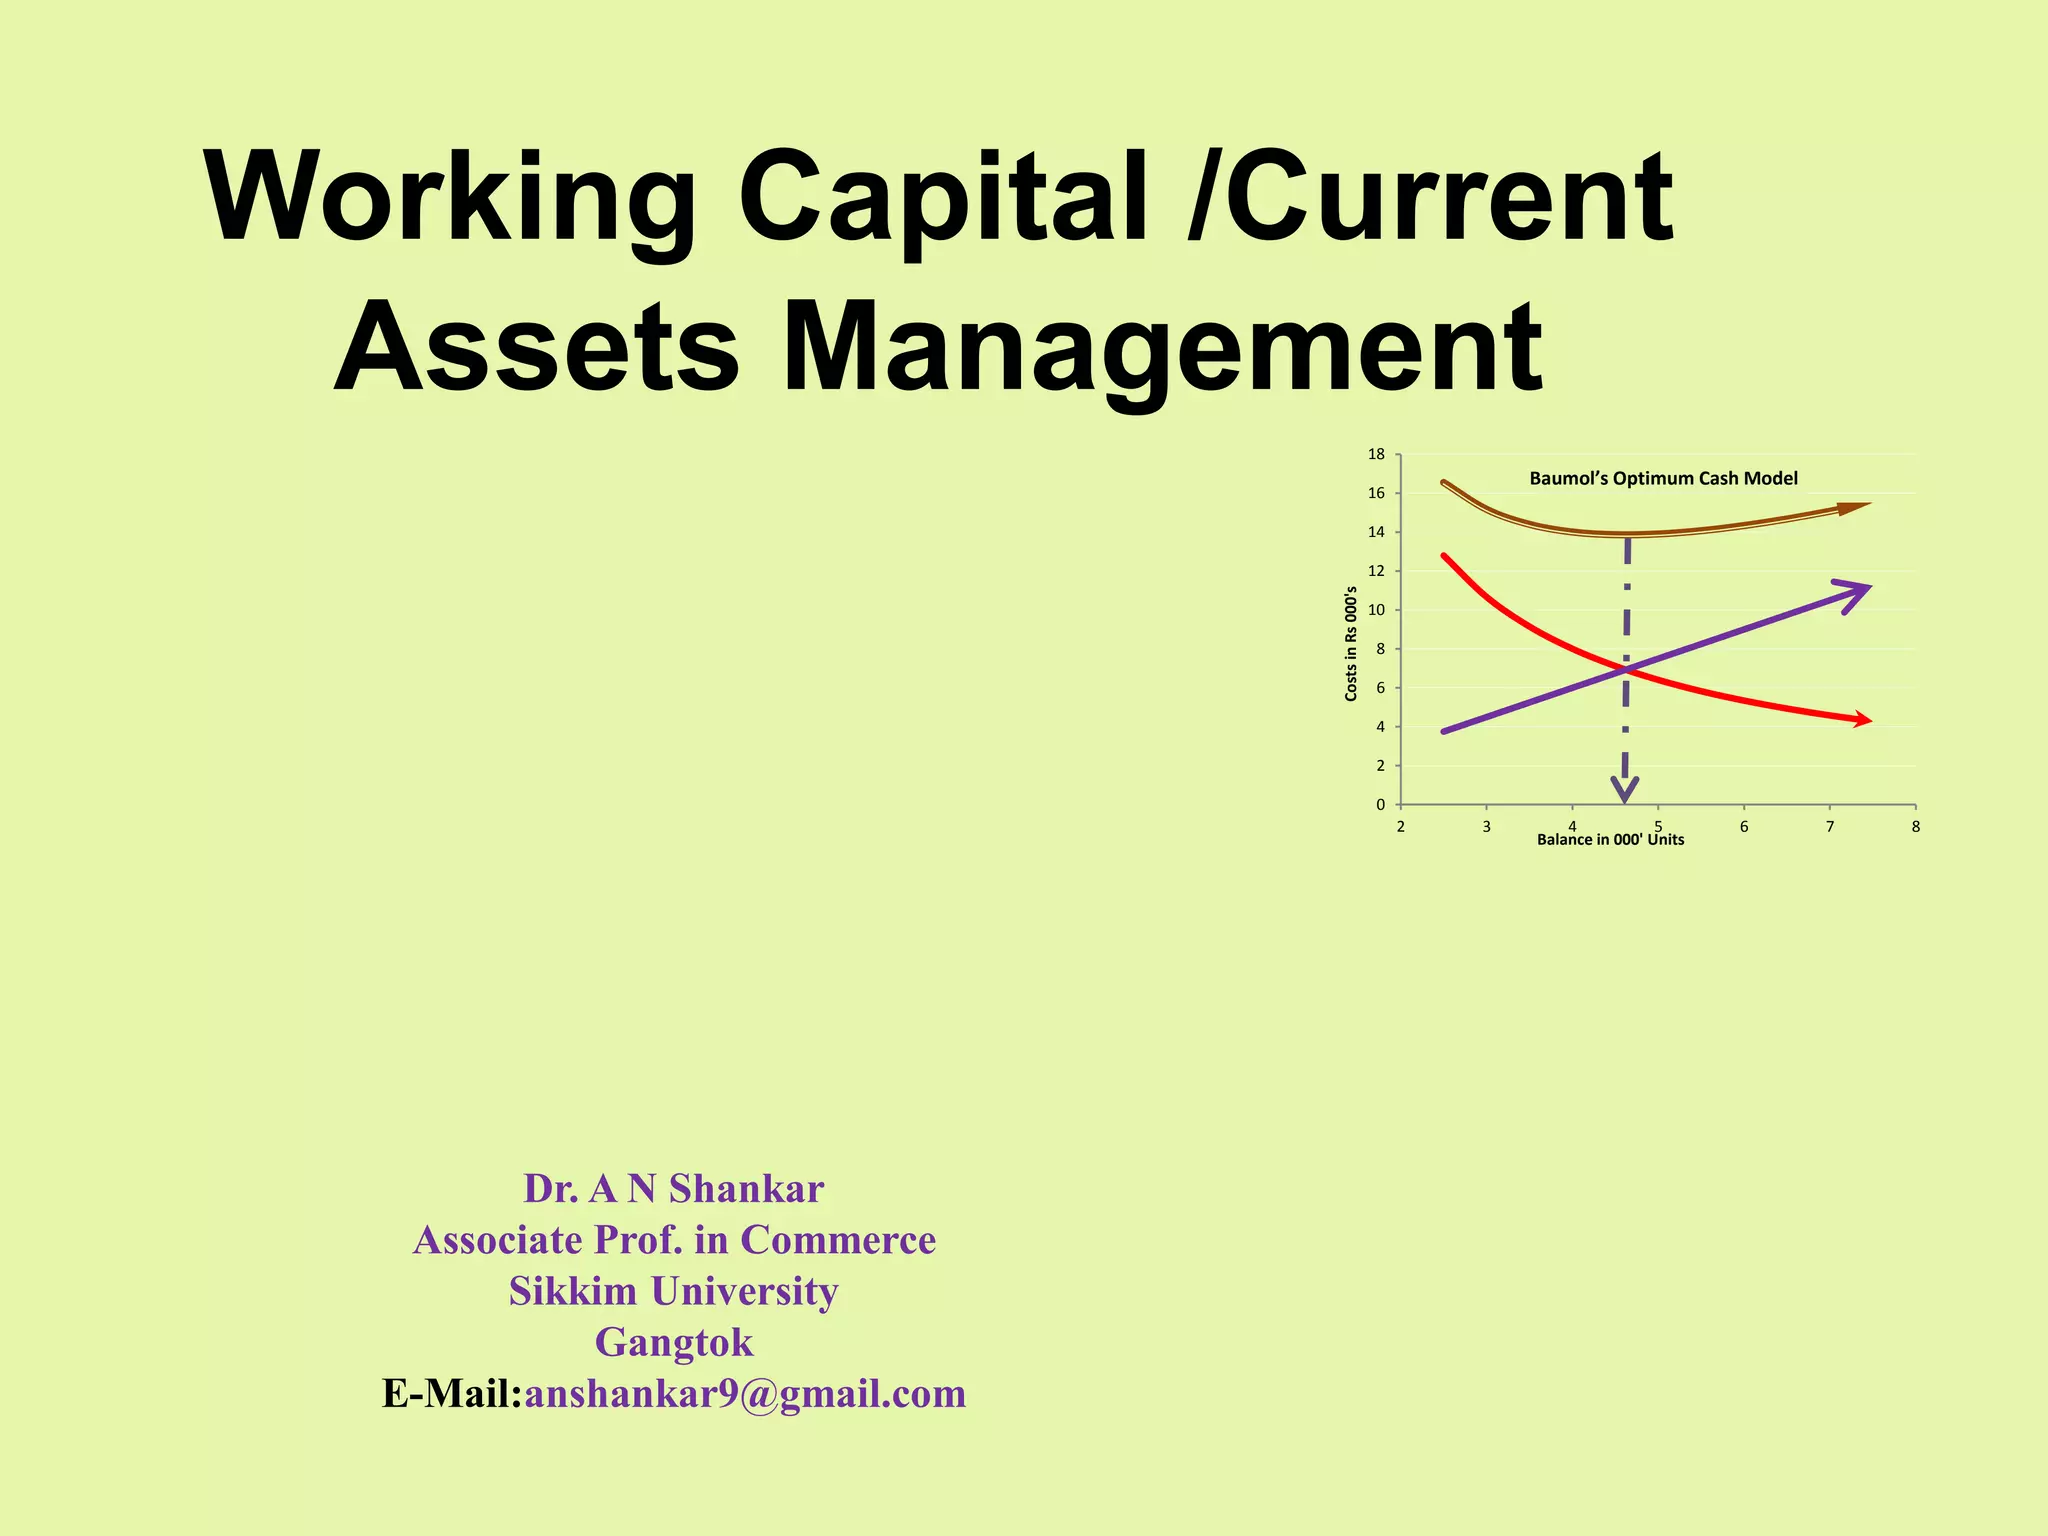
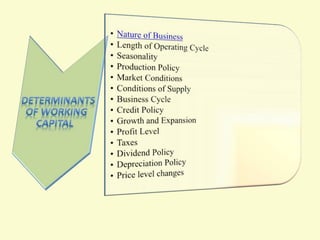
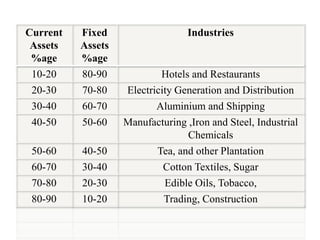
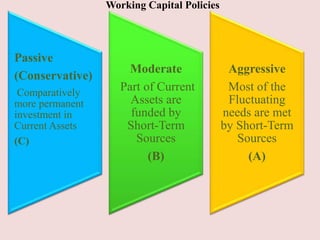
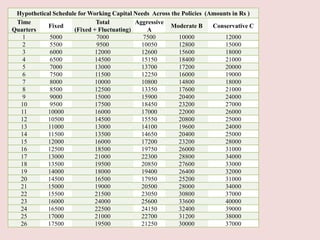
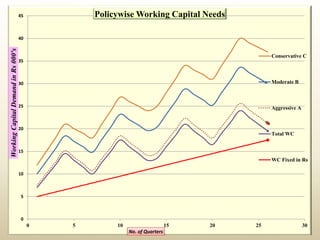
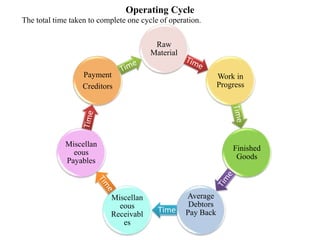
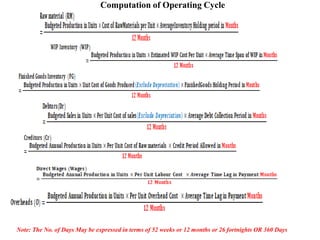
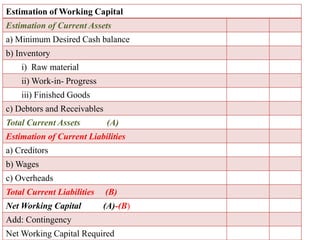
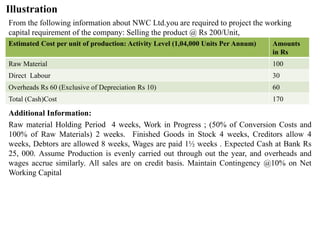
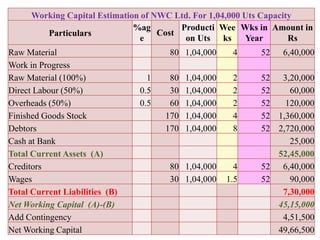
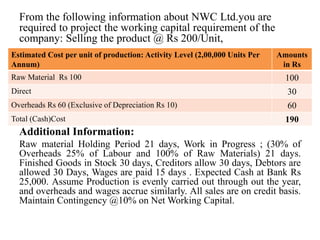
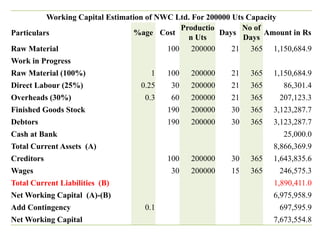
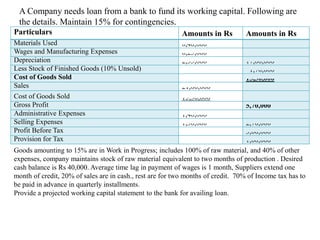
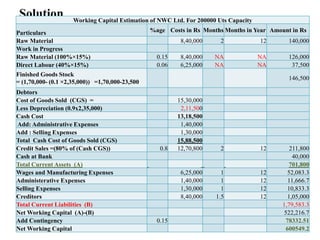
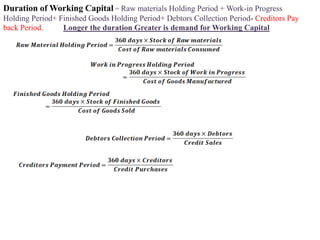
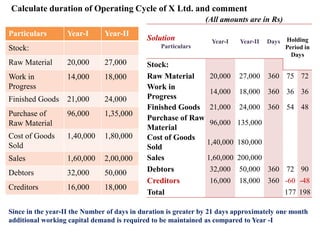
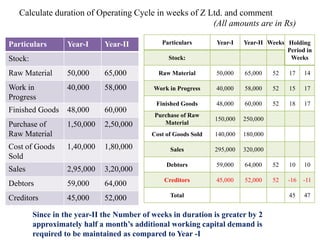
Working Capital /Current Assets Management discusses planning, directing, coordinating investment in current assets and liabilities to ensure healthy cash flow. It maximizes performance while balancing investment. Gross working capital is total current assets. Net working capital is the difference between current assets and liabilities. Current liabilities represent short-term funds; excess must be funded with long-term sources. Industries require varying percentages of working capital versus fixed assets. Companies adopt passive, moderate, or aggressive working capital policies based on permanent versus temporary current asset investment. The operating cycle measures the time to complete one production cycle. Estimating working capital involves calculating minimum cash, inventory levels, debtors, and current liabilities to determine net working capital requirements.