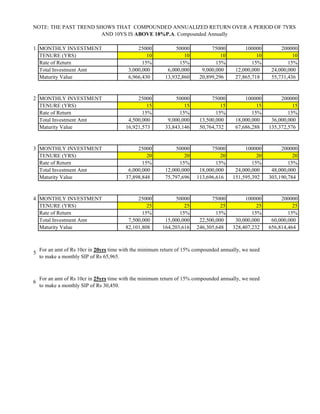
The document outlines investment scenarios with varying monthly investment amounts, tenure periods, rates of return, total investment amounts, and maturity values. Specifically, it shows investments over 10, 15, 20, and 25 year periods with monthly investments ranging from Rs. 25,000 to Rs. 200,000 and a fixed 15% annual return rate. It then notes that to achieve a maturity value of Rs. 10 crore in 25 and 20 years, a monthly SIP of Rs. 30,450 and Rs. 65,965 respectively would be needed assuming a 15% annual return. Finally, it mentions that past returns have been above 18% annually over 7-10 year periods.
The derivative itself is merely a contract between two or more parties. Its value is determined by fluctuations in the underlying asset. The most common underlying assets include stocks, bonds, commodities, currencies, interest rates and market indexes. Most derivatives are characterized by high leverage.
The derivative itself is merely a contract between two or more parties. Its value is determined by fluctuations in the underlying asset. The most common underlying assets include stocks, bonds, commodities, currencies, interest rates and market indexes. Most derivatives are characterized by high leverage.
Wakanda Mulla has presented the following financial data for 2017 - Ba.pdfOwenPBLRobertsv
Wakanda Mulla has presented the following financial data for 2017 :
Balance Sheet 2016 2017
Non-Current Assets Cost Depn NBV Cost Depn NBV
Goodwill 260,000 210,000
Tangible Assets 1,800,000 (360,000) 1,440,000 2,300,000 (450,000) 1,850,000
Long term Investment 130,000 130,000
1,830,000 2,190,000
Current Assets
Closing Stock 35,000 55,000
Debtors 65,000 20,000
Short term Investment 40,000 65,000
Bank 0 40,000
Cash 2,000 142,000 17,000 197,000
Total Assets 1,972,000 2,387,000
Capital & Reserves
Share Capital 700,000 900,000
General Reserves 250,000 250,000
Retained Profit 210,000 1,160,000 50,000 1,200,000
Non Current Liability
10% Debenture 700,000 1,000,000
Current Liabilities
Creditors 36,000 96,000
Dividends Payable 11000 11000
Tax Payable 20,000 20000
Interest Owing 10,000 60,000
Bank Overdraft 35,000 112,000 0 187,000
Total Equity & Liabilities 1,972,000 2,387,000
Condensed Income Statement
PBIT (60,000)
Less interest (100,000)
Profit before tax (160,000)
Less tax 0
PAT (160,000)
Add Retained Earning b/d 210,000
Total Profit for the Year 50,000
Less Transfer to Reserves 0
Less Dividends 0 0
Retained Earning c/d 50,000
Tangible asset costing $80,000 with depreciation of $25,000 was sold for a loss of $55,000.
Required :
a. Prepare the cash flow statement for the year 2017
b. Select appropriate items in the cash flow to comment on the state of liquidity and
profitability of the company.
'Cash Flow Dashboard'. Keep focusing on the indicators that matter to your cash flow management. Dynamic and flexible dashboard, just plug your data. More:https://www.bizinfograph.com/dashboard-templates/53
International Contractor Overviews Q2 2017Jonathan Hunt
The latest Star America Capital Advisors summary of International Construction Companies. This presentation includes 1H 2017 financial highlights and news from the following contractors: Acciona, ACS, Ferrovial, OHL, Sacyr, Skanska, and Vinci.
International Contractor Overviews Q3 2017Jonathan Hunt
The latest Star America Capital Advisors summary of international construction companies. This presentation includes Q3 2017 financial highlights and news from the following contractors: Acciona, ACS, Ferrovial, OHL, Sacyr, and Skanska.
1. 1 MONTHLY INVESTMENT 25000 50000 75000 100000 200000
TENURE (YRS) 10 10 10 10 10
Rate of Return 15% 15% 15% 15% 15%
Total Investment Amt 3,000,000 6,000,000 9,000,000 12,000,000 24,000,000
Maturity Value 6,966,430 13,932,860 20,899,296 27,865,718 55,731,436
2 MONTHLY INVESTMENT 25000 50000 75000 100000 200000
TENURE (YRS) 15 15 15 15 15
Rate of Return 15% 15% 15% 15% 15%
Total Investment Amt 4,500,000 9,000,000 13,500,000 18,000,000 36,000,000
Maturity Value 16,921,573 33,843,146 50,764,732 67,686,288 135,372,576
3 MONTHLY INVESTMENT 25000 50000 75000 100000 200000
TENURE (YRS) 20 20 20 20 20
Rate of Return 15% 15% 15% 15% 15%
Total Investment Amt 6,000,000 12,000,000 18,000,000 24,000,000 48,000,000
Maturity Value 37,898,848 75,797,696 113,696,616 151,595,392 303,190,784
4 MONTHLY INVESTMENT 25000 50000 75000 100000 200000
TENURE (YRS) 25 25 25 25 25
Rate of Return 15% 15% 15% 15% 15%
Total Investment Amt 7,500,000 15,000,000 22,500,000 30,000,000 60,000,000
Maturity Value 82,101,808 164,203,616 246,305,648 328,407,232 656,814,464
5
6
For an amt of Rs 10cr in 25yrs time with the minimum return of 15% compounded annually, we need
to make a monthly SIP of Rs 30,450.
For an amt of Rs 10cr in 20yrs time with the minimum return of 15% compounded annually, we need
to make a monthly SIP of Rs 65,965.
NOTE: THE PAST TREND SHOWS THAT COMPOUNDED ANNUALIZED RETURN OVER A PERIOD OF 7YRS
AND 10YS IS ABOVE 18%P.A. Compounded Annually