Download as PDF, PPTX

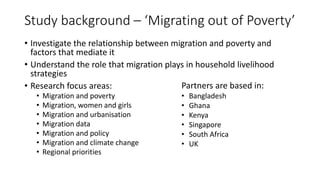
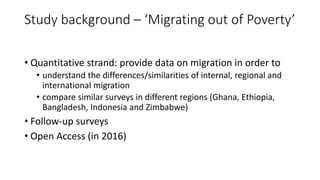
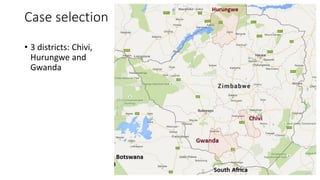
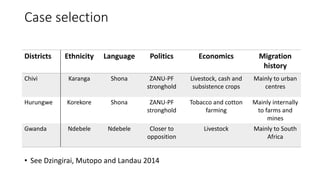
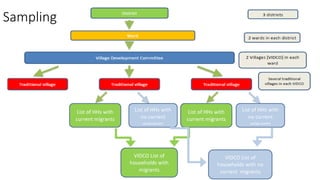
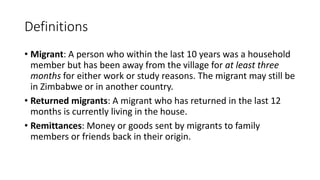
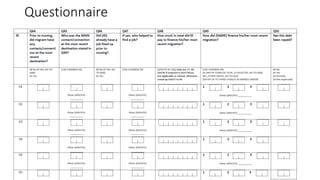
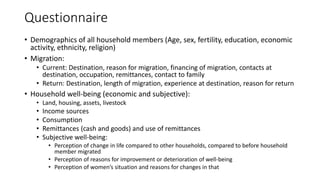
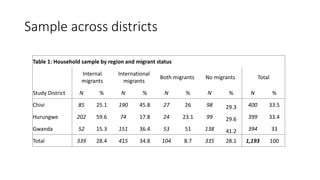
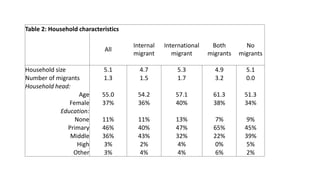
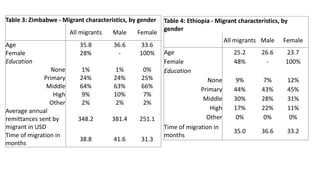
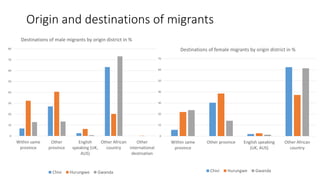
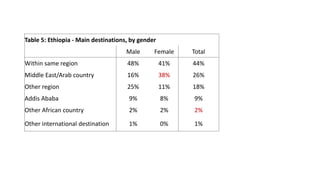
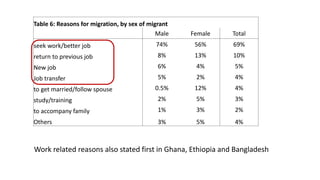
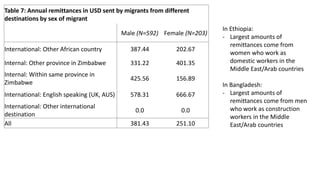
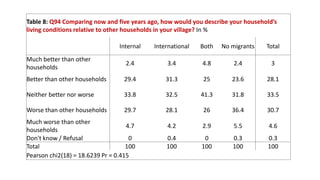
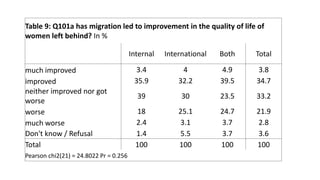
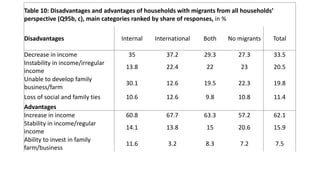
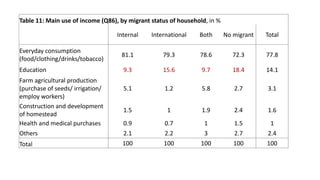
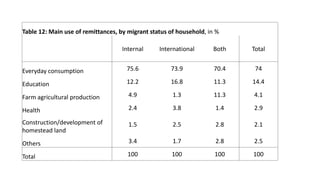


This document summarizes a quantitative research study on the effects of migration on communities in Zimbabwe. It provides background on the study which examines how migration relates to poverty reduction. It then describes the Zimbabwe case study in more detail, including the districts studied, definitions used, questionnaire details, and preliminary results. Key results include statistics on migrant demographics and characteristics, common destinations, reasons for migrating, remittance amounts, perceived changes in living standards and women's situations, and main uses of remittances.


![제 23회 보아즈(BOAZ) 빅데이터 컨퍼런스 - [MBOAX] : ABSA를 활용한 소비자 반응 분석 기반 운영 효율화 대시보드 설계](https://cdn.slidesharecdn.com/ss_thumbnails/3-1boaz23rdconferencemboax-260203102709-9d519923-thumbnail.jpg?width=640&height=640&fit=bounds)


