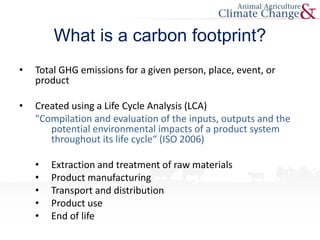
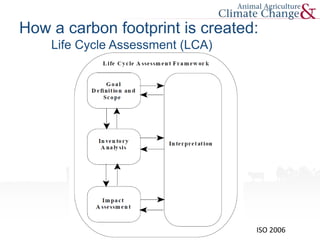
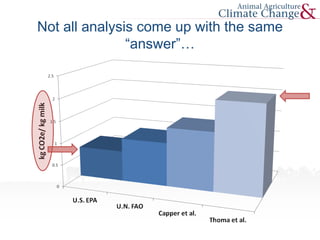
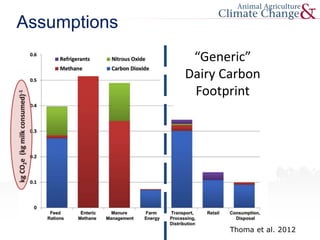
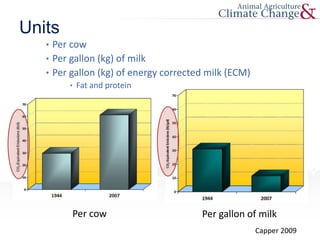
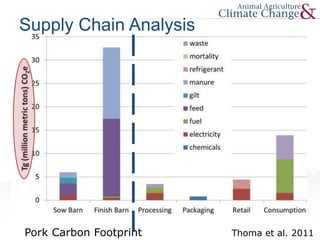
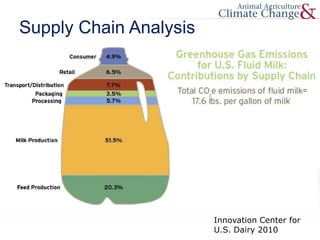
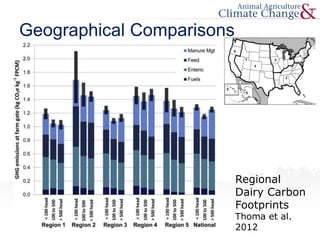
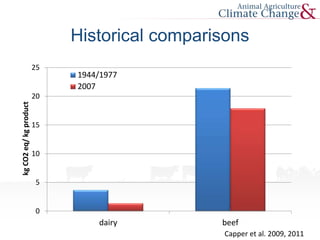
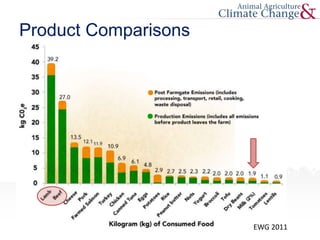
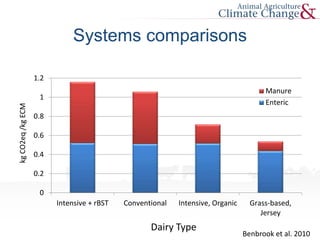
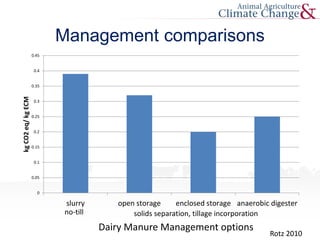
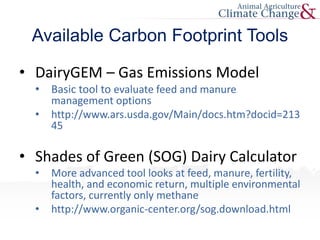
Animal Agriculture’s
Contribution to Greenhouse
Gas Emissions
Outline
• U.S. inventory of greenhouse gases
• Carbon Footprint - Life Cycle Assessment
• How they are calculated
• Why they vary
• How they are used
US Greenhouse Gas Emissions
EPA 2013
Agriculture Sources
Energy use
15%
Enteric
fermentation
28%
Manure
management
14%
Rice cultivation
1%
Burning of
residue
0%
Cropland soils
30%
Grassland
soils
12%
Adapted from Archibeque, S. et al., 2012.
Animal Agriculture GHG Emissions
USDA 2011
HOW DO WE FIND A CARBON FOOTPRINT?
Life Cycle Analysis (LCA)
What is a carbon footprint?
• Total GHG emissions for a given person, place, event, or
product
• Created using a Life Cycle Analysis (LCA)
"Compilation and evaluation of the inputs, outputs and the
potential environmental impacts of a product system
throughout its life cycle“ (ISO 2006)
• Extraction and treatment of raw materials
• Product manufacturing
• Transport and distribution
• Product use
• End of life
ISO 2006
How a carbon footprint is created:
Life Cycle Assessment (LCA)
Not all analysis come up with the same
“answer”…
0.7 1.0 1.35
2.05
WHY DO FOOTPRINTS VARY?
Boundaries
• Boundary definition
• Cradle – to – grave
• EPA: only manure management
• Cradle – to – farm gate
Manure
GHGs
Inputs
GHGs
GHGs
GHGs
GHGs
Use &
Disposal
GHGs
Thoma et al. 2012
Assumptions
“Generic”
Dairy Carbon
Footprint
Units
Capper 2009
Per cow Per gallon of milk
• Per cow
• Per gallon (kg) of milk
• Per gallon (kg) of energy corrected milk (ECM)
• Fat and protein
HOW ARE FOOTPRINTS USED?
Pork Carbon Footprint Thoma et al. 2011
Supply Chain Analysis
Innovation Center for
U.S. Dairy 2010
Supply Chain Analysis
Geographical Comparisons
Regional
Dairy Carbon
Footprints
Thoma et al.
2012
Historical comparisons
0
5
10
15
20
25
dairy beef
kgCO2eq/kgproduct
1944/1977
2007
Capper et al. 2009, 2011
Product Comparisons
EWG 2011
Benbrook et al. 2010
0
0.2
0.4
0.6
0.8
1
1.2
Intensive + rBST Conventional Intensive, Organic Grass-based,
Jersey
Manure
Enteric
kgCO2eq/kgECM
Systems comparisons
Dairy Type
Management comparisons
0
0.05
0.1
0.15
0.2
0.25
0.3
0.35
0.4
0.45
slurry open storage enclosed storage anaerobic digester
kgCO2eq/kgECM
Rotz 2010
no-till solids separation, tillage incorporation
Dairy Manure Management options
Available Carbon Footprint Tools
• DairyGEM – Gas Emissions Model
• Basic tool to evaluate feed and manure
management options
• http://www.ars.usda.gov/Main/docs.htm?docid=213
45
• Shades of Green (SOG) Dairy Calculator
• More advanced tool looks at feed, manure, fertility,
health, and economic return, multiple environmental
factors, currently only methane
• http://www.organic-center.org/sog.download.html
More Carbon Footprint Tools
• Live Swine Carbon Footprint Calculator
• http://www.pork.org/Resources/1220/CarbonFootprintCalculatorHome
page.aspx#.UHg2K66s971
• Poultry Carbon Footprint Estimation Toolkit
• https://www.uspoultry.org/uspforms/cdrom/CarbonFootprint/start.cfm
• Cool Farm Tool
• All species
• Includes emissions from fields, inputs, livestock, land use and land use
change and primary processing
• http://www.unilever.com/aboutus/supplier/sustainablesourcing/tools
Outline
• U.S. inventory of greenhouse gases
• Carbon Footprint - Life Cycle Assessment
• How they are calculated
• Why they vary
• How they are used
For a full list of references cited in this presentation, please visit:
www.animalagclimatechange.org
This project was supported by Agricultural and Food Research Initiative Competitive Grant
No. 2011-67003-30206 from the USDA National Institute of Food and Agriculture.
Graphic Sources
U.S. EPA. 2013. “Inventory of U.S. Greenhouse Gas Emissions and Sinks:
1990-2011.”
Archibeque et al., 2012. “Greenhouse Gas Mitigation Opportunities for
Livestock Management in the United States.”
USDA. 2011. U.S. Agriculture and Forestry Greenhouse Gas Inventory:
1990-2008.
ISO 14040:2006. Environmental management - Life cycle assessment -
Principles and framework
Graphic Sources
U.S. EPA. 2010. “Inventory of U.S. Greenhouse Gas Emissions and Sinks:
1990-2008”
UN-FAO 2010. “Greenhouse Gas Emissions from the Dairy Sector: A Life
Cycle Assessment”
Capper, J. L., R. A. Cady and D. E. Bauman (2009) “The Environmental Impact
of Dairy Production, 1944 vs 2007.” J. An Sci. 2009.87:2160-2167
Thoma et al. 2010. ”Greenhouse Gas Emissions of Fluid Milk in the U.S.”
Thoma et al. 2012. International Dairy Journal (2012) 1-12
“Greenhouse gas emissions from milk production and consumption in
the United States: A cradle-to-grave life cycle assessment circa 2008”
Capper, J. L., R. A. Cady and D. E. Bauman (2009) “The Environmental
Impact of Dairy Production, 1944 vs 2007.” J. An Sci. 2009.87:2160-2167
Thoma et al. 2011. “National Life Cycle Carbon Footprint Study for
Production of US Swine.”
Graphic Sources
Capper, J. L., R. A. Cady and D. E. Bauman. 2009. “The Environmental
Impact of Dairy Production, 1944 vs 2007.” J. An Sci. 2009.87:2160-
2167
Capper, J.L. 2011. “The environmental impact of beef production in the
United States: 1977 compared with 2007.” J. An Sci. 2011.89:4249-4261
Innovation Center for U.S. Dairy. 2010. “Greenhouse Gas LCA for Fluid
Milk”
Thoma et al. 2012. “Regional analysis of greenhouse gas emissions
from USA dairy farms: A cradle to farm-gate assessment of the
American dairy industry circa 2008”
Graphic Sources
Environmental Working Group. 2011. “Meat Eater’s Guide to Climate
Change + Health”
Benbrook et al. 2010. “A Dairy Farm’s Footprint: Evaluating the Impacts
of Conventional and Organic Farming Systems”
Rotz, C.A., Montes, F., Chianese, D.S. 2010. The carbon footprint of
dairy production systems through partial life cycle assessment. Journal
of Dairy Science. 93(3):1266-1282.

Animal Agriculture's Contribution to Greenhouse Gas Emissions

  • 1.
  • 2.
    Outline • U.S. inventoryof greenhouse gases • Carbon Footprint - Life Cycle Assessment • How they are calculated • Why they vary • How they are used
  • 3.
    US Greenhouse GasEmissions EPA 2013
  • 4.
    Agriculture Sources Energy use 15% Enteric fermentation 28% Manure management 14% Ricecultivation 1% Burning of residue 0% Cropland soils 30% Grassland soils 12% Adapted from Archibeque, S. et al., 2012.
  • 5.
    Animal Agriculture GHGEmissions USDA 2011
  • 6.
    HOW DO WEFIND A CARBON FOOTPRINT? Life Cycle Analysis (LCA)
  • 7.
    What is acarbon footprint? • Total GHG emissions for a given person, place, event, or product • Created using a Life Cycle Analysis (LCA) "Compilation and evaluation of the inputs, outputs and the potential environmental impacts of a product system throughout its life cycle“ (ISO 2006) • Extraction and treatment of raw materials • Product manufacturing • Transport and distribution • Product use • End of life
  • 8.
    ISO 2006 How acarbon footprint is created: Life Cycle Assessment (LCA)
  • 9.
    Not all analysiscome up with the same “answer”… 0.7 1.0 1.35 2.05
  • 10.
  • 11.
    Boundaries • Boundary definition •Cradle – to – grave • EPA: only manure management • Cradle – to – farm gate Manure GHGs Inputs GHGs GHGs GHGs GHGs Use & Disposal GHGs
  • 12.
    Thoma et al.2012 Assumptions “Generic” Dairy Carbon Footprint
  • 13.
    Units Capper 2009 Per cowPer gallon of milk • Per cow • Per gallon (kg) of milk • Per gallon (kg) of energy corrected milk (ECM) • Fat and protein
  • 14.
  • 15.
    Pork Carbon FootprintThoma et al. 2011 Supply Chain Analysis
  • 16.
    Innovation Center for U.S.Dairy 2010 Supply Chain Analysis
  • 17.
  • 18.
  • 19.
  • 20.
    Benbrook et al.2010 0 0.2 0.4 0.6 0.8 1 1.2 Intensive + rBST Conventional Intensive, Organic Grass-based, Jersey Manure Enteric kgCO2eq/kgECM Systems comparisons Dairy Type
  • 21.
    Management comparisons 0 0.05 0.1 0.15 0.2 0.25 0.3 0.35 0.4 0.45 slurry openstorage enclosed storage anaerobic digester kgCO2eq/kgECM Rotz 2010 no-till solids separation, tillage incorporation Dairy Manure Management options
  • 22.
    Available Carbon FootprintTools • DairyGEM – Gas Emissions Model • Basic tool to evaluate feed and manure management options • http://www.ars.usda.gov/Main/docs.htm?docid=213 45 • Shades of Green (SOG) Dairy Calculator • More advanced tool looks at feed, manure, fertility, health, and economic return, multiple environmental factors, currently only methane • http://www.organic-center.org/sog.download.html
  • 23.
    More Carbon FootprintTools • Live Swine Carbon Footprint Calculator • http://www.pork.org/Resources/1220/CarbonFootprintCalculatorHome page.aspx#.UHg2K66s971 • Poultry Carbon Footprint Estimation Toolkit • https://www.uspoultry.org/uspforms/cdrom/CarbonFootprint/start.cfm • Cool Farm Tool • All species • Includes emissions from fields, inputs, livestock, land use and land use change and primary processing • http://www.unilever.com/aboutus/supplier/sustainablesourcing/tools
  • 24.
    Outline • U.S. inventoryof greenhouse gases • Carbon Footprint - Life Cycle Assessment • How they are calculated • Why they vary • How they are used
  • 25.
    For a fulllist of references cited in this presentation, please visit: www.animalagclimatechange.org This project was supported by Agricultural and Food Research Initiative Competitive Grant No. 2011-67003-30206 from the USDA National Institute of Food and Agriculture.
  • 26.
    Graphic Sources U.S. EPA.2013. “Inventory of U.S. Greenhouse Gas Emissions and Sinks: 1990-2011.” Archibeque et al., 2012. “Greenhouse Gas Mitigation Opportunities for Livestock Management in the United States.” USDA. 2011. U.S. Agriculture and Forestry Greenhouse Gas Inventory: 1990-2008. ISO 14040:2006. Environmental management - Life cycle assessment - Principles and framework
  • 27.
    Graphic Sources U.S. EPA.2010. “Inventory of U.S. Greenhouse Gas Emissions and Sinks: 1990-2008” UN-FAO 2010. “Greenhouse Gas Emissions from the Dairy Sector: A Life Cycle Assessment” Capper, J. L., R. A. Cady and D. E. Bauman (2009) “The Environmental Impact of Dairy Production, 1944 vs 2007.” J. An Sci. 2009.87:2160-2167 Thoma et al. 2010. ”Greenhouse Gas Emissions of Fluid Milk in the U.S.” Thoma et al. 2012. International Dairy Journal (2012) 1-12 “Greenhouse gas emissions from milk production and consumption in the United States: A cradle-to-grave life cycle assessment circa 2008” Capper, J. L., R. A. Cady and D. E. Bauman (2009) “The Environmental Impact of Dairy Production, 1944 vs 2007.” J. An Sci. 2009.87:2160-2167 Thoma et al. 2011. “National Life Cycle Carbon Footprint Study for Production of US Swine.”
  • 28.
    Graphic Sources Capper, J.L., R. A. Cady and D. E. Bauman. 2009. “The Environmental Impact of Dairy Production, 1944 vs 2007.” J. An Sci. 2009.87:2160- 2167 Capper, J.L. 2011. “The environmental impact of beef production in the United States: 1977 compared with 2007.” J. An Sci. 2011.89:4249-4261 Innovation Center for U.S. Dairy. 2010. “Greenhouse Gas LCA for Fluid Milk” Thoma et al. 2012. “Regional analysis of greenhouse gas emissions from USA dairy farms: A cradle to farm-gate assessment of the American dairy industry circa 2008”
  • 29.
    Graphic Sources Environmental WorkingGroup. 2011. “Meat Eater’s Guide to Climate Change + Health” Benbrook et al. 2010. “A Dairy Farm’s Footprint: Evaluating the Impacts of Conventional and Organic Farming Systems” Rotz, C.A., Montes, F., Chianese, D.S. 2010. The carbon footprint of dairy production systems through partial life cycle assessment. Journal of Dairy Science. 93(3):1266-1282.

Editor's Notes

  • #4 EPA. 2013. INVENTORY OF U.S. GREENHOUSE GAS EMISSIONS AND SINKS: 1990-2011. Accessed Aug 15, 2013. http://www.epa.gov/climatechange/ghgemissions/usinventoryreport.html
  • #5 Archibeque, S. et al., 2012. Greenhouse Gas Mitigation Opportunities for Livestock Management in the United States. Brief NI B 12-01, July 2012. Nicholas Institute for Environmental Policy Solutions. Duke University. Accessed 12/4/12. http://nicholasinstitute.duke.edu/ecosystem/land/greenhouse-gas-mitigation-opportunities-for-livestock-management-in-the-united-states
  • #6 USDA. 2011. U.S. Agriculture and Forestry Greenhouse Gas Inventory: 1990-2008. Accessed Dec 17, 2012. http://www.usda.gov/oce/climate_change/AFGGInventory1990_2008.htm
  • #9 ISO 14040:2006. Environmental management - Life cycle assessment - Principles and framework
  • #10 Sources: U.S. EPA (2010) “Inventory of U.S. Greenhouse Gas Emissions and Sinks: 1990-2008” UN-FAO (2010) “Greenhouse Gas Emissions from the Dairy Sector: A Life Cycle Assessment” Capper, J. L., R. A. Cady and D. E. Bauman (2009) “The Environmental Impact of Dairy Production, 1944 vs 2007.” J. An Sci. 2009.87:2160-2167 Thoma et al. 2010. ”Greenhouse Gas Emissions of Fluid Milk in the U.S.” Accessed Dec 17, 2012. http://www.usdairy.com/Sustainability/Science/GreenhouseGas/Pages/FluidMilk.aspx
  • #13 G. Thoma et al. / International Dairy Journal (2012) 1-12 Greenhouse gas emissions from milk production and consumption in the United States: A cradle-to-grave life cycle assessment circa 2008 Greg Thoma, Jennie Popp, Darin Nutter, David Shonnard, Richard Ulrich, Marty Matlock, Dae Soo Kim, Zara Neiderman, Nathan Kemper, Cashion East, Felix Adomd Available online 26 October 2012 http://dx.doi.org/10.1016/j.idairyj.2012.09.010
  • #14 Capper, J. L., R. A. Cady and D. E. Bauman (2009) “The Environmental Impact of Dairy Production, 1944 vs 2007.” J. An Sci. 2009.87:2160-2167
  • #16 Greg Thoma, Darin Nutter, Richard Ulrich, Charles Maxwell, Jason Frank, Cashion East. 2011. “National Life Cycle Carbon Footprint Study for Production of US Swine.” Accessed Dec 17, 2012. http://www.pork.org/filelibrary/NPB%20Scan%20Final%20-%20May%202011.pdf
  • #17 Graphic: Innovation Center for U.S. Dairy. 2010. “Greenhouse Gas LCA for Fluid Milk” Accessed Dec 17, 2012. http://www.usdairy.com/Sustainability/Science/GreenhouseGas/Pages/FluidMilk.aspx Adapted from: Thoma et al. 2010. “Greenhouse Gas Emissions of Fluid Milk in the U.S.”
  • #18 Greg Thoma, Jennie Popp, David Shonnard, Darin Nutter, Marty Matlock, Richard Ulrich, Wayne Kellogg, Dae Soo Kim, Zara Neiderman, Nathan Kemper, Felix Adom, Cashion East. 2012. “Regional analysis of greenhouse gas emissions from USA dairy farms: A cradle to farm-gate assessment of the American dairy industry circa 2008” International Dairy Journal, Available online 26 October 2012 http://dx.doi.org/10.1016/j.idairyj.2012.09.010
  • #19 Adapted from: Capper, J. L., R. A. Cady and D. E. Bauman. 2009. “The Environmental Impact of Dairy Production, 1944 vs 2007.” J. An Sci. 2009.87:2160-2167 Capper, J.L. 2011. “The environmental impact of beef production in the United States: 1977 compared with 2007.” J. An Sci. 2011.89:4249-4261
  • #20 Environmental Working Group. 2011. “Meat Eater’s Guide to Climate Change + Health” Accessed Dec. 17, 2012. http://www.ewg.org/meateatersguide/
  • #21 Adapted from: Charles Benbrook, Cory Carman, E. Ann Clark, Cindy Daley, Wendy Fulwider, Michael Hansen, Carlo Leifert, Klaas Martens, Laura Paine, Lisa Petkewitz, Guy Jodarski, Francis Thicke, Juan Velez and Gary Wegner. 2010. “A Dairy Farm’s Footprint: Evaluating the Impacts of Conventional and Organic Farming Systems” Accessed Dec 17, 2012. http://www.organic-center.org/sog.html
  • #22 Rotz, C.A., Montes, F., Chianese, D.S. 2010. The carbon footprint of dairy production systems through partial life cycle assessment. Journal of Dairy Science. 93(3):1266-1282.