Apollo Tyres Q1 FY16 Results Update
•
2 likes•1,331 views

Apollo Tyres reported a 12.4% decrease in net sales but a 27.5% increase in net profit for Q1 FY16 compared to Q1 FY15. EBITDA rose 15.4% and profit margins increased 319 and 447 basis points respectively. Apollo Tyres approved expanding its Chennai truck and bus radial tire capacity and raising Rs. 20,000 million in debt for ongoing expansions. Analyst estimates see Apollo Tyres' operating profit and PAT growing at a CAGR of 13% and 23% from FY14 to FY17 respectively.

Recommended
Recommended
More Related Content
What's hot
What's hot (19)
Viewers also liked
Viewers also liked (7)
Similar to Apollo Tyres Q1 FY16 Results Update
Similar to Apollo Tyres Q1 FY16 Results Update (20)
More from IndiaNotes.com
More from IndiaNotes.com (20)
Recently uploaded
Recently uploaded (20)
Apollo Tyres Q1 FY16 Results Update
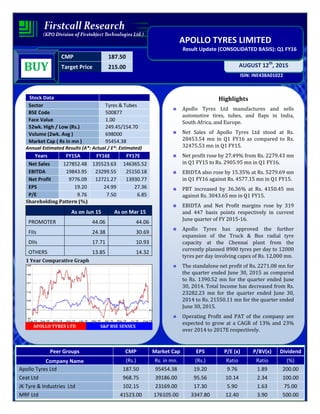
- 1. CMP 187.50 Target Price 215.00 ISIN: INE438A01022 AUGUST 12th , 2015 APOLLO TYRES LIMITED Result Update (CONSOLIDATED BASIS): Q1 FY16 BUY Stock Data Sector Tyres & Tubes BSE Code 500877 Face Value 1.00 52wk. High / Low (Rs.) 249.45/154.70 Volume (2wk. Avg ) 698000 Market Cap ( Rs in mn ) 95454.38 Annual Estimated Results (A*: Actual / E*: Estimated) Years FY15A FY16E FY17E Net Sales 127852.48 135523.63 146365.52 EBITDA 19843.95 23299.55 25150.18 Net Profit 9776.09 12721.27 13930.77 EPS 19.20 24.99 27.36 P/E 9.76 7.50 6.85 Shareholding Pattern (%) As on Jun 15 As on Mar 15 PROMOTER 44.06 44.06 FIIs 24.38 30.69 DIIs 17.71 10.93 OTHERS 13.85 14.32 1 Year Comparative Graph APOLLO TYRES LTD S&P BSE SENSEX Highlights Apollo Tyres Ltd manufactures and sells automotive tires, tubes, and flaps in India, South Africa, and Europe. Net Sales of Apollo Tyres Ltd stood at Rs. 28453.54 mn in Q1 FY16 as compared to Rs. 32475.53 mn in Q1 FY15. Net profit rose by 27.49% from Rs. 2279.43 mn in Q1 FY15 to Rs. 2905.95 mn in Q1 FY16. EBIDTA also rose by 15.35% at Rs. 5279.69 mn in Q1 FY16 against Rs. 4577.15 mn in Q1 FY15. PBT increased by 36.36% at Rs. 4150.45 mn against Rs. 3043.65 mn in Q1 FY15. EBIDTA and Net Profit margins rose by 319 and 447 basis points respectively in current June quarter of FY 2015-16. Apollo Tyres has approved the further expansion of the Truck & Bus radial tyre capacity at the Chennai plant from the currently planned 8900 tyres per day to 12000 tyres per day involving capex of Rs. 12,000 mn. The standalone net profit of Rs. 2271.08 mn for the quarter ended June 30, 2015 as compared to Rs. 1390.52 mn for the quarter ended June 30, 2014. Total Income has decreased from Rs. 23282.23 mn for the quarter ended June 30, 2014 to Rs. 21550.11 mn for the quarter ended June 30, 2015. Operating Profit and PAT of the company are expected to grow at a CAGR of 13% and 23% over 2014 to 2017E respectively. Peer Groups CMP Market Cap EPS P/E (x) P/BV(x) Dividend Company Name (Rs.) Rs. in mn. (Rs.) Ratio Ratio (%) Apollo Tyres Ltd 187.50 95454.38 19.20 9.76 1.89 200.00 Ceat Ltd 968.75 39186.00 95.56 10.14 2.34 100.00 JK Tyre & Industries Ltd 102.15 23169.00 17.30 5.90 1.63 75.00 MRF Ltd 41523.00 176105.00 3347.80 12.40 3.90 500.00
- 2. Company Profile Apollo Tyres Ltd, with its corporate headquarters in Gurgaon, India, is in the business of manufacture and sale of tyres since its inception in 1972. Over the years, the company has grown manifold, establishing its footprint across the globe. The company has manufacturing units in India and The Netherlands. It is also setting up a new manufacturing facility in Hungary, with a planned investment of €475 million. The company markets its products under its two global brands - Apollo and Vredestein, and its products are available in over 100 countries through a vast network of branded, exclusive and multi-product outlets. The company’s joint venture with Michelin, France for producing dual branded truck & bus radial tyres in India is the market leader in the category. The company is in technical collaboration with General Tire International Company USA and produces some of India`s most advanced tyres for trucks, tractors, light commercial vehicles and cars. Mahindra and Mahindra and TAFE are its major OEM clients. At the end of its financial year on March 31, 2015, Apollo Tyres had clocked a turnover of US$ 2.08 billion, backed by a global workforce of approximately 16000 employees. QUARTERLY RESULTS (CONSOLIDATED BASIS) Q1 FY16 Net Sales of Apollo Tyres Ltd stood at Rs. 28453.54 mn in Q1 FY16 as compared to Rs. 32475.53 mn in Q1 FY15. Net profit rose by 27.49% from Rs. 2279.43 mn in Q1 FY15 to Rs. 2905.95 mn in Q1 FY16. EBIDTA also rose by 15.35% at Rs. 5279.69 mn against Rs. 4577.15 mn in Q1 FY15. PBT increased by 36.36% at Rs. 4150.45 mn against Rs. 3043.65 mn in Q1 FY15. EBIDTA and Net Profit margins rose by 319 and 447 basis points respectively in current June quarter of FY 2015-16. Rs.In Mn Q1 FY16 Q1 FY15 % Change Net Sales 28453.54 32475.53 -12.38% Net Profit 2905.95 2279.43 27.49% Net Profit Margin 10.21% 7.02% 319BP EBIDTA 5279.69 4577.15 15.35% EBIDTA Margin 18.56% 14.09% 447BP Other Income 254.30 289.79 -12.25% PBT 4150.45 3043.65 36.36%
- 3. Break Up of Expenditure Geographic Wise - Revenue The Standalone results for the Quarter ended June 30, 2015 The Company has posted a net profit of Rs. 2271.08 million for the quarter ended June 30, 2015 as compared to Rs. 1390.52 million for the quarter ended June 30, 2014. Total Income has decreased from Rs. 23282.23 million for the quarter ended June 30, 2014 to Rs. 21550.11 million for the quarter ended June 30, 2015. Particulars (Rs. Mn) Q1 FY16 Q1 FY15 CHNG % Cost of Material Consumed 12733.24 17633.90 -28% Purchase of Stock in Trade 2025.33 1752.99 16% Employee Benefit Expenses 3589.56 4239.36 -15% Depreciation & Amortization Expense 886.02 1003.92 -12% Other Expenditure 5449.61 5540.86 -2%
- 4. Other updates • Apollo Tyres Ltd has approved the further expansion of the Truck & Bus radial tyre capacity at the Chennai plant from the currently planned 8900 tyres per day to 12000 tyres per day Involving capex of Rs. 12,000 million. • In order to meet Capex requirements towards ongoing/ proposed expansions at Chennai and Kalamassery Plants, the company approved authorization for raising of debt of Rs. 20,000 million by way of Rupee Term Loan/ Foreign Currency Term Loan/ ECBs/ Non-Convertible Debentures etc. from time to time.
- 5. FINANCIAL STATEMENTS & ESTIMATIONS (CONSOLIDATED BASIS) (A*- Actual, E* -Estimations & Rs. In Millions) Balance sheet as on 31st March, 2014-2017E APOLLO TYRES LTD FY-14A FY-15A FY-16E FY-17E SOURCES OF FUNDS Shareholder's Funds • Share Capital 504.09 509.09 509.09 509.09 • Reserves and Surplus 45134.39 49913.88 58362.71 65949.86 • Money Received against Share Warrants 107.75 0.00 0.00 0.00 Total Net worth (a) 45746.23 50422.97 58871.80 66458.95 Non Current Liabilities • Long term borrowing 7137.33 3339.39 2671.51 2244.07 • Deferred Tax Liability (net) 5358.42 5208.95 5365.22 5526.18 • Other Long term Liabilities 161.35 72.68 84.31 94.43 • Long Term Provisions 1274.02 1259.77 1322.76 1375.67 Total Non Current Liabilities (b) 13931.12 9880.79 9443.80 9240.34 Current Liabilities • Short term borrowings 2751.19 4666.36 5366.31 6010.27 • Trade payables 12537.63 8640.17 7430.55 6687.49 • Other Current Liabilities 9800.56 6624.66 5962.19 5485.22 • Short term Provisions 5689.11 5915.89 6152.53 6337.10 Total Current Liabilities (c) 30778.49 25847.08 24911.58 24520.08 Total Liabilities (a + b + c) 90455.84 86150.84 93227.18 100219.38 APPLICATION OF FUNDS Non-Current Assets Fixed Assets Tangible Assets 43570.70 41588.47 43252.01 44982.09 Intangible Assets 986.80 1096.33 1184.04 1266.92 Capital work-in-progress 464.78 2182.06 2574.83 2935.31 • Sub-Total Fixed Assets 45022.28 44866.86 47010.88 49184.32 • Goodwill on consolidation (net) 1375.62 1165.13 1258.34 1346.42 • Non Current Investments 637.21 470.27 536.11 589.72 • Deferred tax assets 117.00 296.95 350.40 392.45 • Long Term loans and advances 1371.56 1907.37 2365.14 2861.82 • Other Non Current Assets 214.14 360.18 428.61 497.19 Total Non Current Assets (d) 48737.81 49066.76 51949.48 54871.92 Current Assets • Current Investments 0.00 1000.00 1080.00 1144.80 • Inventories 20664.24 17782.06 19791.84 21771.02 • Trade receivables 10426.67 9589.43 10548.37 11497.73 • Cash and Bank Balances 6540.50 5945.90 6659.41 7325.35 • Short-terms loans & advances 3706.56 2390.73 2773.25 3145.49 • Other current assets 380.06 375.96 424.83 463.07 Total Current Assets (e) 41718.03 37084.08 41277.70 45347.46 Total Assets (d+e) 90455.84 86150.84 93227.18 100219.38
- 6. Annual Profit & Loss Statement for the period of 2014 to 2017E Value(Rs.in.mn) FY14A FY15A FY16E FY17E Description 12m 12m 12m 12m Net Sales 134119.80 127852.48 135523.63 146365.52 Other Income 978.46 537.99 667.11 707.13 Total Income 135098.26 128390.47 136190.74 147072.65 Expenditure -115364.67 -108546.52 -112891.18 -121922.48 Operating Profit 19733.59 19843.95 23299.55 25150.18 Interest -2837.94 -1827.90 -1261.25 -1135.13 Gross profit 16895.65 18016.05 22038.30 24015.05 Depreciation -4108.51 -3882.88 -4271.17 -4612.86 Exceptional Items -467.86 -824.90 0.00 0.00 Profit Before Tax 12319.28 13308.27 17767.13 19402.19 Tax -2268.70 -3532.18 -5045.87 -5471.42 Net Profit 10050.58 9776.09 12721.27 13930.77 Equity capital 504.09 509.09 509.09 509.09 Reserves 45103.17 49882.66 58362.71 65949.86 Face value 1.00 1.00 1.00 1.00 EPS 19.94 19.20 24.99 27.36 Quarterly Profit & Loss Statement for the period of 31st Dec, 2014 to 30th Sep, 2015E Value(Rs.in.mn) 31-Dec-14 31-Mar-15 30-Jun-15 30-Sep-15E Description 3m 3m 3m 3m Net sales 31048.21 31176.28 28453.54 30160.75 Other income 111.40 -58.90 254.30 185.92 Total Income 31159.61 31117.38 28707.84 30346.67 Expenditure -26142.96 -25997.74 -23428.15 -25093.75 Operating profit 5016.65 5119.64 5279.69 5252.92 Interest -454.49 -347.69 -243.22 -233.49 Gross profit 4562.16 4771.95 5036.47 5019.43 Depreciation -932.60 -876.22 -886.02 -930.32 Exceptional Items -789.87 -35.03 0.00 0.00 Profit Before Tax 2839.69 3860.70 4150.45 4089.11 Tax -997.28 -785.87 -1244.50 -1157.22 Profit After Tax 1842.41 3074.83 2905.95 2931.89 Equity capital 509.09 509.09 509.09 509.09 Face value 1.00 1.00 1.00 1.00 EPS 3.62 6.04 5.71 5.76
- 7. Ratio Analysis Particulars FY14A FY15A FY16E FY17E EPS (Rs.) 19.94 19.20 24.99 27.36 EBITDA Margin (%) 14.71 15.52 17.19 17.18 PBT Margin (%) 9.19 10.41 13.11 13.26 PAT Margin (%) 7.49 7.65 9.39 9.52 P/E Ratio (x) 9.40 9.76 7.50 6.85 ROE (%) 22.04 19.40 21.61 20.96 ROCE (%) 42.96 296.37 41.21 39.84 Debt Equity Ratio 0.22 0.16 0.14 0.12 EV/EBITDA (x) 4.96 4.86 4.11 3.79 Book Value (Rs.) 90.47 98.98 115.64 130.54 P/BV 2.07 1.89 1.62 1.44 Charts
- 8. Outlook and Conclusion At the current market price of Rs.187.50, the stock P/E ratio is at 7.50 x FY16E and 6.85 x FY17E respectively. Earning per share (EPS) of the company for the earnings for FY16E and FY17E is seen at Rs.24.99 and Rs.27.36 respectively. Operating Profit and PAT of the company are expected to grow at a CAGR of 13% and 23% over 2014 to 2017E respectively. On the basis of EV/EBITDA, the stock trades at 4.11 x for FY16E and 3.79 x for FY17E. Price to Book Value of the stock is expected to be at 1.62 x and 1.44 x for FY16E and FY17E respectively. We recommend ‘BUY’ in this particular scrip with a target price of Rs.215.00 for Medium to Long term investment. Industry Overview The Scooters (two/ three wheelers) and the Motorcycle tyre accounted for 52% of the total volumes, while the other heavyweights (M&HCV, passenger cars, LCV, tractors and off road highway, etc.) accounted for the balance 48%. As per industry estimates, the key heavyweights, passenger car segment posted a healthy clip of 12.4% and the truck segment grew at a 7.9% in volume terms. For the segments under consideration, passenger car and truck, as per estimates, OEMs accounted for 42% and 17% respectively. The replacement market continued to support the tyre majors and accounted for 45% and 78% for the mentioned segments. Imports have become an important source of tyres into the country and, as per industry estimates, accounted for 13% and 14% for the passenger car and TBR segments. This will continue to haunt the industry in the current
- 9. fiscal as the growth of low cost tyres from China continues unabated. Given the ‘inverted’ import duty structure in India, where tyres (finished product) attract lower duty, whereas raw rubber (raw material) attracts a higher duty levy, the Indian market was flooded with low cost tyres in the last quarter of FY15. According to market estimates, Chinese tyre imports grew 138% to 555,438 tyres in FY15 for the truck radial segment and accounted for 11% of the total availability in the Indian market. Similarly, the imports for the passenger car segment were up by 10% to 1,480,044 units and now accounts for 4.2% of the Indian market. In terms of raw material, natural rubber prices ruled lower in FY15 due to weak demand from major consuming blocks such as BRICS, EU, ASEAN and Japan. The domestic rubber production in India continued to fall short of the demand and imports of rubber from ASEAN region were necessary to offset the shortfall in domestic supplies. In order to ensure long-term sustainability of its natural rubber supply chain, the company supported the Kerala Government scheme of sourcing domestic rubber at 20% higher than international prices. Given weakness in oil prices, synthetic rubber prices remained subdued in the fiscal. Other crude based raw materials such as carbon black displayed a similar trend. In FY15, the European passenger vehicle tyre sales in replacement market have remained flat as per data from the Industry Association in Europe. The growth for almost all segments has remained flat with an exception of 7% growth in the SUV tyres segement. In passenger vehicle tyre category, there were some signs of recovery evident in markets such as Hungary, France, Spain, Switzerland & Nordics, while countries like Germany, Netherlands, Belgium, UK & Austria, Poland stayed longer on a descending slope. The agricultural tyre market showed a negative growth in FY15. The beginning of the new year 2015 brought mixed results for the European tyre industry. The all season tyre market is getting more mature and the recent introduction of such products by another major tyre player only confirms the growing importance of all season tyres in Europe. Further, the introduction of TPMS (Tyre Pressure Monitoring System), mandatory in new cars from November 2014 onward, pushes European consumers to use all season tyres as tyre changes between summer and winter is expected to become time consuming and costlier due to the TPMS legislation. The other big trend is the growing impact of the internet, both on B2B as well as on B2C. Initiatives in B2C are to bring products and end-consumers together and pushing the retail business into a more service minded approach. Like India, Europe is witnessing the growth of low cost non-European imported brands. While the introduction of the European tyre label in November 2012 has forced many imported brands to invest in improved quality, the European tyre landscape is changing very quickly. In terms of raw material, prices remained soft during the year with further decline during second half of the financial year. However, these benefits were passed on to the market with lower sales prices due to a highly competitive market situation.
- 10. Outlook Growth prospects for FY 2015-16 remain good, with an improving economy, positive consumer sentiment, pick- up in auto demand, as well as moderate raw material cost: coupled with these trends, declining interest rates are expected to push up volume growth to 9-10%. The domestic tyre industry is expected to get a further boost as a result of increasing radilalisation, with strong thrust from OEMs, steady aftermarket demand, improved fleet utilization and increased focus on geographical diversification. Original Equipment (OE) demand is expected to pick up by 10% and replacement by 8-9% during the year. This anticipated demand potential has encouraged the industry to invest significantly in capacities, particularly in the consumer segment. Disclaimer: This document is prepared by our research analysts and it does not constitute an offer or solicitation for the purchase or sale of any financial instrument or as an official confirmation of any transaction. The information contained herein is from publicly available data or other sources believed to be reliable but we do not represent that it is accurate or complete and it should not be relied on as such. Firstcall Research or any of its affiliates shall not be in any way responsible for any loss or damage that may arise to any person from any inadvertent error in the information contained in this report. Firstcall Research and/ or its affiliates and/or employees will not be liable for the recipients’ investment decision based on this document.
- 11. Firstcall India Equity Research: Email – info@firstobjectindia.com C.V.S.L.Kameswari Pharma & Diversified U. Janaki Rao Capital Goods B. Anil Kumar Auto, IT & FMCG M. Vinayak Rao Diversified G. Amarender Diversified Firstcall Research Provides Industry Research on all the Sectors and Equity Research on Major Companies forming part of Listed and Unlisted Segments For Further Details Contact: Tel.: 022-2527 2510/2527 6077 / 25276089 Telefax: 022-25276089 040-20000235 /20000233 E-mail: info@firstobjectindia.com www.firstcallresearch.com