KSB Pumps Q3CY14 Result Update: Weak margin performance - Prabhudas Lilladher
•
0 likes•273 views

- KSB Pumps reported flat profits for the quarter despite a 5.7% rise in sales, due to weaker margins from an unfavorable product mix and losses in the valve segment. - While the pump segment grew sales by 5.7%, the valve segment returned to growth after four declining quarters but reported losses. - Margins declined due to high prior year margins providing a tough comparison and costs rising faster than revenues. - The analyst maintains a 'Buy' rating, expecting the company to benefit from an industrial recovery and its diverse portfolio.

Recommended
Recommended
More Related Content
What's hot
What's hot (20)
Similar to KSB Pumps Q3CY14 Result Update: Weak margin performance - Prabhudas Lilladher
Similar to KSB Pumps Q3CY14 Result Update: Weak margin performance - Prabhudas Lilladher (20)
More from IndiaNotes.com
More from IndiaNotes.com (20)
KSB Pumps Q3CY14 Result Update: Weak margin performance - Prabhudas Lilladher
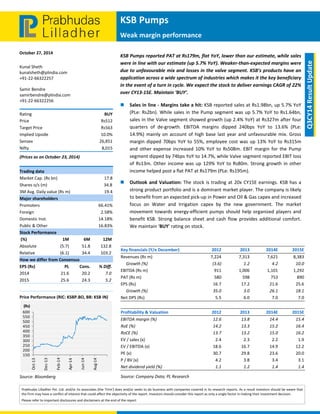
- 1. KSB Pumps Weak margin performance October 27, 2014 600 550 500 450 400 350 300 250 200 150 Oct‐13 Dec‐13 Prabhudas Lilladher Pvt. Ltd. and/or its associates (the 'Firm') does and/or seeks to do business with companies covered in its research reports. As a result investors should be aware that the Firm may have a conflict of interest that could affect the objectivity of the report. Investors should consider this report as only a single factor in making their investment decision. Please refer to important disclosures and disclaimers at the end of the report Q3CY14 Result Update Kunal Sheth kunalsheth@plindia.com +91‐22‐66322257 Samir Bendre samirbendre@plindia.com +91‐22‐66322256 Rating BUY Price Rs512 Target Price Rs563 Implied Upside 10.0% Sensex 26,851 Nifty 8,015 (Prices as on October 23, 2014) Trading data Market Cap. (Rs bn) 17.8 Shares o/s (m) 34.8 3M Avg. Daily value (Rs m) 19.4 Major shareholders Promoters 66.41% Foreign 2.58% Domestic Inst. 14.18% Public & Other 16.83% Stock Performance (%) 1M 6M 12M Absolute (5.7) 51.8 132.8 Relative (6.1) 34.4 103.2 How we differ from Consensus EPS (Rs) PL Cons. % Diff. 2014 21.6 20.2 7.0 2015 25.6 24.3 5.2 Price Performance (RIC: KSBP.BO, BB: KSB IN) Source: Bloomberg Feb‐14 Apr‐14 Jun‐14 Aug‐14 (Rs) KSB Pumps reported PAT at Rs179m, flat YoY, lower than our estimate, while sales were in line with our estimate (up 5.7% YoY). Weaker‐than‐expected margins were due to unfavourable mix and losses in the valve segment. KSB’s products have an application across a wide spectrum of industries which makes it the key beneficiary in the event of a turn in cycle. We expect the stock to deliver earnings CAGR of 22% over CY13‐15E. Maintain ‘BUY’. Sales in line ‐ Margins take a hit: KSB reported sales at Rs1.98bn, up 5.7% YoY (PLe: Rs2bn). While sales in the Pump segment was up 5.7% YoY to Rs1.64bn, sales in the Valve segment showed growth (up 2.4% YoY) at Rs327m after four quarters of de‐growth. EBITDA margins dipped 240bps YoY to 13.6% (PLe: 14.9%) mainly on account of high base last year and unfavourable mix. Gross margin dipped 70bps YoY to 55%, employee cost was up 13% YoY to Rs315m and other expense increased 10% YoY to Rs508m. EBIT margin for the Pump segment dipped by 74bps YoY to 14.7%, while Valve segment reported EBIT loss of Rs13m. Other income was up 129% YoY to Rs80m. Strong growth in other income helped post a flat PAT at Rs179m (PLe: Rs195m). Outlook and Valuation: The stock is trading at 20x CY15E earnings. KSB has a strong product portfolio and is a dominant market player. The company is likely to benefit from an expected pick‐up in Power and Oil & Gas capex and increased focus on Water and Irrigation capex by the new government. The market movement towards energy‐efficient pumps should help organized players and benefit KSB. Strong balance sheet and cash flow provides additional comfort. We maintain ‘BUY’ rating on stock. Key f inancials (Y/e December) 2012 2013 2014E 2015E Revenues (Rs m) 7,224 7,313 7,621 8,383 Growth (%) (3.6) 1.2 4.2 10.0 EBITDA (Rs m) 911 1,006 1,101 1,292 PAT (Rs m) 580 598 753 890 EPS (Rs) 16.7 17.2 21.6 25.6 Growth (%) 35.0 3.0 26.1 18.1 Net DPS (Rs) 5.5 6.0 7.0 7.0 Profitability & Valuation 2012 2013 2014E 2015E EBITDA margin (%) 12.6 13.8 14.4 15.4 RoE (%) 14.2 13.3 15.2 16.4 RoCE (%) 13.7 13.2 15.0 16.2 EV / sales (x) 2.4 2.3 2.2 1.9 EV / EBITDA (x) 18.6 16.7 14.9 12.2 PE (x) 30.7 29.8 23.6 20.0 P / BV (x) 4.2 3.8 3.4 3.1 Net dividend yield (%) 1.1 1.2 1.4 1.4 Source: Company Data; PL Research
- 2. KSB Pumps Exhibit 1: Q3CY14 Result Overview (Rs m) Y/e March Q3CY14 Q3CY13 YoY gr. (%) Q2CY13 9MFY14 9MFY13 YoY gr. (%) Net Sales 1,989 1,882 5.7 1,994 5,716 5,492 4.1 RM cost 896 860 4.2 926 2,599 2,556 1.7 % of Net Sales 45.0 45.7 46.4 45.5 46.5 Employee Costs 315 278 13.5 323 949 844 12.4 % of Net Sales 15.8 14.8 16.2 16.6 15.4 Other Costs 508 463 9.7 452 1,353 1,304 3.8 % of Net Sales 25.5 24.6 22.7 23.7 23.7 Cost of Goods Sold 1,719 1,600 7.4 1,700 4,901 4,704 4.2 % of Net Sales 86.4 85.0 85.3 85.7 85.6 EBITDA 270 302 (10.5) 293 815 788 3.4 % of Sales 13.6 16.1 14.7 14.3 14.4 Depreciation 69 68 2.2 68 204 195 4.6 Other Income 80 35 129.1 94 220 138 59.4 EBIT 282 270 4.5 319 831 731 13.6 Interest 13 6 115.5 3 18 23 (23.6) PBT 269 264 2.0 316 813 708 14.8 Total Tax 90 85 6.7 92 259 219 18.4 ETR % 33.6 32.1 29.0 31.8 30.9 Reported PAT 179 179 (0.2) 225 555 490 13.2 Adj PAT 179 179 (0.2) 225 555 490 13.2 Source: Company Data, PL Research October 27, 2014 2
- 3. KSB Pumps Income Statement (Rs m) Y/e December 2012 2013 2014E 2015E Net Revenue 7,224 7,313 7,621 8,383 Raw Material Expenses 3,582 3,326 3,353 3,688 Gross Profit 3,642 3,988 4,268 4,694 Employee Cost 1,036 1,101 1,156 1,271 Other Expenses 1,695 1,881 2,011 2,131 EBITDA 911 1,006 1,101 1,292 Depr. & Amortization 235 265 290 315 Net Interest 52 26 25 25 Other Income 184 162 291 320 Profit before Tax 807 876 1,076 1,271 Total Tax 226 279 323 381 Profit after Tax 580 598 753 890 Ex‐Od items / Min. Int. — — 1 — Adj. PAT 580 598 753 890 Avg. Shares O/S (m) 34.8 34.8 34.8 34.8 EPS (Rs.) 16.7 17.2 21.6 25.6 Cash Flow Abstract (Rs m) Y/e December 2012 2013 2014E 2015E C/F from Operations 1,246 729 955 1,036 C/F from Investing (390) (300) (300) (300) C/F from Financing (677) (209) (244) (244) Inc. / Dec. in Cash 180 220 412 493 Opening Cash 817 1,002 1,222 1,634 Closing Cash 997 1,222 1,634 2,127 FCFF 1,082 355 655 736 FCFE 618 355 655 736 Key Financial Metrics Y/e December 2012 2013 2014E 2015E Growth Revenue (%) (3.6) 1.2 4.2 10.0 EBITDA (%) 27.9 10.4 9.4 17.4 PAT (%) 35.0 3.0 26.1 18.1 EPS (%) 35.0 3.0 26.1 18.1 Profitability EBITDA Margin (%) 12.6 13.8 14.4 15.4 PAT Margin (%) 8.0 8.2 9.9 10.6 RoCE (%) 13.7 13.2 15.0 16.2 RoE (%) 14.2 13.3 15.2 16.4 Balance Sheet Net Debt : Equity (0.2) (0.2) (0.3) (0.4) Net Wrkng Cap. (days) — — — — Valuation PER (x) 30.7 29.8 23.6 20.0 P / B (x) 4.2 3.8 3.4 3.1 EV / EBITDA (x) 18.6 16.7 14.9 12.2 EV / Sales (x) 2.4 2.3 2.2 1.9 Earnings Quality Eff. Tax Rate 28.1 31.8 30.0 30.0 Other Inc / PBT 22.8 18.4 27.0 25.2 Eff. Depr. Rate (%) 6.5 6.8 6.9 7.0 FCFE / PAT 106.6 59.5 87.0 82.7 Source: Company Data, PL Research. Balance Sheet Abstract (Rs m) Y/e December 2012 2013 2014E 2015E Shareholder's Funds 4,259 4,730 5,181 5,664 Total Debt 169 169 169 169 Other Liabilities — — — — Total Liabilities 4,427 4,898 5,350 5,832 Net Fixed Assets 1,852 1,887 1,896 1,604 Goodwill — — — — Investments 64 64 64 64 Net Current Assets 2,438 2,873 3,315 4,090 Cash & Equivalents 1,002 1,230 1,584 2,190 Other Current Assets 4,130 4,148 4,320 4,748 Current Liabilities 2,695 2,505 2,589 2,848 Other Assets 75 75 75 75 Total Assets 4,428 4,898 5,350 5,832 Quarterly Financials (Rs m) Y/e December Q4CY14 Q1CY14 Q2CY14 Q3CY14 Net Revenue 1,795 1,734 1,994 1,989 EBITDA 217 251 293 270 % of revenue 11.9 14.5 14.7 13.6 Depr. & Amortization 70 67 68 69 Net Interest 3 2 3 13 Other Income 24 46 94 80 Profit before Tax 168 228 316 269 Total Tax 60 77 92 90 Profit after Tax 108 151 225 179 Adj. PAT 108 151 225 179 Source: Company Data, PL Research. October 27, 2014 3
- 4. KSB Pumps Prabhudas Lilladher Pvt. Ltd. 3rd Floor, Sadhana House, 570, P. B. Marg, Worli, Mumbai‐400 018, India Tel: (91 22) 6632 2222 Fax: (91 22) 6632 2209 Rating Distribution of Research Coverage 31.7% 51.9% 16.3% 0.0% 60% 50% 40% 30% 20% 10% 0% BUY Accumulate Reduce Sell % of Total Coverage PL’s Recommendation Nomenclature BUY : Over 15% Outperformance to Sensex over 12‐months Accumulate : Outperformance to Sensex over 12‐months Reduce : Underperformance to Sensex over 12‐months Sell : Over 15% underperformance to Sensex over 12‐months Trading Buy : Over 10% absolute upside in 1‐month Trading Sell : Over 10% absolute decline in 1‐month Not Rated (NR) : No specific call on the stock Under Review (UR) : Rating likely to change shortly This document has been prepared by the Research Division of Prabhudas Lilladher Pvt. Ltd. Mumbai, India (PL) and is meant for use by the recipient only as information and is not for circulation. This document is not to be reported or copied or made available to others without prior permission of PL. It should not be considered or taken as an offer to sell or a solicitation to buy or sell any security. The information contained in this report has been obtained from sources that are considered to be reliable. However, PL has not independently verified the accuracy or completeness of the same. Neither PL nor any of its affiliates, its directors or its employees accept any responsibility of whatsoever nature for the information, statements and opinion given, made available or expressed herein or for any omission therein. Recipients of this report should be aware that past performance is not necessarily a guide to future performance and value of investments can go down as well. The suitability or otherwise of any investments will depend upon the recipient's particular circumstances and, in case of doubt, advice should be sought from an independent expert/advisor. Either PL or its affiliates or its directors or its employees or its representatives or its clients or their relatives may have position(s), make market, act as principal or engage in transactions of securities of companies referred to in this report and they may have used the research material prior to publication. We may from time to time solicit or perform investment banking or other services for any company mentioned in this document. October 27, 2014 4