9711147426✨Call In girls Gurgaon Sector 31. SCO 25 escort service
Anand Rathi Research Report Highlights Strong FCF Generation and Robust Balance Sheet for Hinduja Global Solutions
1. Anand Rathi Share and Stock Brokers Limited (hereinafter “ARSSBL”) is a full-service brokerage and equities-research firm and the views expressed therein are solely of
ARSSBL and not of the companies which have been covered in the Research Report. This report is intended for the sole use of the Recipient. Disclosures and analyst
certifications are present in the Appendix.
Anand Rathi Research India Equities
Technology
Company Update
India I Equities
Key financials (YE Mar) FY15 FY16 FY17 FY18e FY19e
Sales (` m) 28,076 33,247 37,110 38,336 40,498
Net profit (` m) 1,651 1,010 1,792 1,932 1,921
EPS (`) 79.7 48.7 86.5 93.2 92.7
Growth (%) -2.8 -38.8 77.4 7.8 -0.6
PE (x) 6.4 10.4 5.9 5.4 5.5
PBV (x) 1.0 0.9 0.8 0.7 0.6
RoE (%) 13.1 9.0 14.2 13.6 12.1
RoCE (%) 12.3 10.9 15.6 16.7 16.5
Dividend yield (%) 4.0 3.0 2.0 2.0 2.0
Net debt/equity (x) 0.2 0.3 0.2 0.1 0.0
Source: Company, Anand Rathi Research
Mohit Jain
Research Analyst
+9122 6626 6531
mohitjain@rathi.com
Shobit Singhal
Research Associate
+9122 6626 6511
shobitsinghal@rathi.com
1,58,329.51 1,58,329.51
`
Rating: Buy
Target Price: `700
Share Price: `508
Key data HGSL IN / HGSL.BO
52-week high / low `638 / `461
Sensex / Nifty 31449 / 9794
3-m average volume $0.1m
Market cap `11bn / $164.5m
Shares outstanding 21m
Shareholding pattern (%) June'17 Mar'17 Dec'16
Promoters 67.5 67.6 67.6
- of which, Pledged - - -
Free float 32.5 32.4 32.4
- Foreign institutions 7.9 7.4 7.6
- Domestic institutions 2.0 3.0 3.4
- Public 22.6 21.9 21.4
Change in Estimates Target Reco
14 August 2017
Hinduja Global Solutions
On strong FCF generation, robust balance sheet; Buy
Boosted by growth in BFSI (19% y/y) surpassing that in its healthcare
vertical (14% y/y) for the first time since Q1 FY14, Hinduja Global
Solutions reported a steady quarter, with revenue of $144m, up 1.9%
q/q, 5.7% yoy (CC growth was 6.4% y/y). On adjusting for forex
accounting, the EBITDA margin was 10.8%, down 256bps qoq, 92bps
y/y. Positive for the quarter were debt reduction of `586m and capex
down 25% y/y to 4.3% of revenue. No major change in estimates or
target of `700 (7.5x FY19e EPS).
Steady quarter but weak client metrics. Revenue growth in Q1 was
supported by BFSI (8% of revenue) and Healthcare (47%). Telecoms (22% of
revenue, down 6% y/y) continues to be faced with growth challenge. The
top-20 clients (71% of revenue) grew just 4.3% y/y in dollar terms (down
0.9% q/q), slower than the company. Further, clients in higher revenue
buckets fell during the quarter, indicating deterioration in client metrics and
some currency impact (HGS measures it in rupee terms).
Lower capex equals high FCF generation. On adjusting for a forex loss,
the operating margin was down 256bps q/q, 92bps y/y, to 10.8%, hit by
currency movements and a rise in headcount (a net 1.4% increase). Lower
capex (down 25% y/y) led to a significant rise in FCF generation (`784m),
utilised to repay debt of `586m and helping strengthen the balance sheet. In
the last 12 months, debt has come down by `2.032m, an achievement for the
company; net debt now stands at `1,187m. There is a strong case for an
increase in dividend payout (13% in Q1 pre-tax).
Valuations. We largely retain our FY18e and FY19e earnings and the target
price. The stock now trades at 5.5x FY19e PE and 2.6x EBITDA, making it
an attractive Buy. Our `700 target implies 38% potential. Risks: Currency
movements, reversion to a high-capex model, and automation technologies.
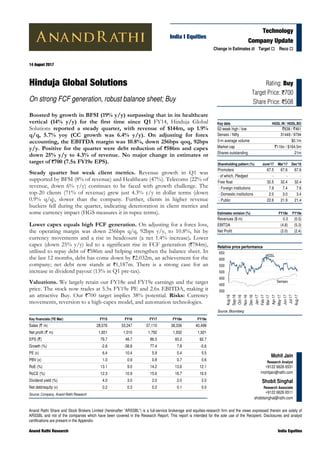
Relative price performance
Source: Bloomberg
HGSL
Sensex
350
400
450
500
550
600
650
Aug-16
Sep-16
Oct-16
Nov-16
Dec-16
Jan-17
Feb-17
Mar-17
Apr-17
May-17
Jun-17
Jul-17
Aug-17
Estimates revision (%) FY18e FY19e
Revenues ($ m) 0.3 (0.5)
EBITDA (4.8) (5.3)
Net Profit (2.0) (2.4)
4. 14 August 2017 Hinduja Global Solutions – On strong FCF generation, robust balance sheet; Buy
Anand Rathi Research 4
Conference Call Takeaways
Company
The focus on FCF and operational efficiencies would continue for the
rest of FY18. However, margins may be affected by currency
movements, minimum wage increases in some states in India (making
tier-2 call centres less viable) and weakness in India’s telecoms sector
(HGS’ India business brings 16% to its revenue). Management would
try to soften the impact by transferring the workforce to states where
minimum wages are not applicable.
Minimum wages in Canada could also come by Q4 FY18. The impact
of this could not be directly transferred to customers by an increase in
pricing but various offset levers are available like higher offshoring,
some price increases, and government subsidies.
Capex is expected to hold in the range of `1.6bn-1.8bn, of which
`395m has already been expensed in Q1 FY18.
Debt now stands at `6.0bn (term loans: 33%,) rest is working capital
loan. The requirements of working capital could increase in response
to growth in revenues
New centres opened in Indore with 700 seats. Two Durgapur centres
will be consolidated into one.
Business outlook
H2 FY18 would be better than H1. Cost pressures in Indian telecoms
would be seen due to consolidation in the telecoms industry generally.
The company is positive on the Healthcare sector and believes that it
would continue to grow at a healthy rate in FY18.
Notes from the last two quarters’ conference calls
From Q4 FY17
Q1 FY18 revenue growth would exhibit the usual seasonality (weak
H1, strong H2). Margins would be similar to Q1 FY17 as currency
headwinds are likely.
Higher dividend/buy-back to be considered later as cash generation is
expected to be strong. The first priority currently is to repay debt,
followed by some capital allocation ($10m-15m) towards M&A.
Forex loss for the quarter was `230m.
From Q3 FY17
Q4 is expected to be little softer than the very strong Q3.
HGS expects to maintain its margins in the current environment than
attempt expanding them through higher offshoring.
5. 14 August 2017 Hinduja Global Solutions – On strong FCF generation, robust balance sheet; Buy
Anand Rathi Research 5
Factsheet
Fig 9 – Revenue
Q1 FY17 Q2 FY17 Q3 FY17 Q4 FY17 Q1 FY18
Revenues ($ m) 136 135 142 141 144
Source: Company Anand Rathi Research
Fig 10 – Revenue by area
(%) Q1 FY17 Q2 FY17 Q3 FY17 Q4 FY17 Q1 FY18
North America 28 28 29 29 28
Canada 12 10 10 10 10
Continental Europe 10 10 7 7 7
India 32 34 35 35 36
Philippine 18 18 19 19 19
Source: Company Anand Rathi Research
Fig 11 – Revenue by vertical
(%) Q1 FY17 Q2 FY17 Q3 FY17 Q4 FY17 Q1 FY18
BFSI 7 7 7 7 8
Telecoms 25 24 22 22 22
Hi-tech / PES (cons. elec) 14 14 13 13 13
Life Sciences (chem, biotech & ins) 43 46 49 48 47
Media and Entertainment 3 3 2 0 4
Others 7 7 6 9 6
Source: Company Anand Rathi Research, * Clubbed in “others”
Fig 12 – Client concentration
(%) Q1 FY17 Q2 FY17 Q3 FY17 Q4 FY17 Q1 FY18
Top client 17 18 18 18 19
Top-5 clients 47 49 50 52 52
Top-10 clients 60 61 61 63 62
Top-20 clients 72 73 72 73 71
Source: Company Anand Rathi Research
Fig 13 – Revenue by currency exposure
(%) Q1 FY17 Q2 FY17 Q3 FY17 Q4 FY17 Q1 FY18
North America 65 66 68 68 65
Canada 12 11 10 10 11
Continental Europe 10 10 7 7 8
India 13 14 14 15 16
Source: Company Anand Rathi Research
Fig 14 – Workforce spread
(%) Q1 FY17 Q2 FY17 Q3 FY17 Q4 FY17 Q1 FY18
North America 5 8 9 9 9
Canada 6 5 5 5 5
Continental Europe 4 4 3 3 3
India 68 66 65 67 67
Philippine 17 17 18 16 16
Total 40,938 43,793 43,750 44,237 44,877
Source: Company Anand Rathi Research
Fig 15 – Seats
(%) Q1 FY17 Q2 FY17 Q3 FY17 Q4 FY17 Q1 FY18
Active clients 189 185 185 183 187
Revenue per active client ($ m) 0.7 0.7 0.8 0.8 0.8
Source: Company, Anand Rathi Research
6. 14 August 2017 Hinduja Global Solutions – On strong FCF generation, robust balance sheet; Buy
Anand Rathi Research 6
Valuations
The stock trades at 5.5x FY19e PE and 2.6x EV/EBITDA, attractive
considering the capex reduction (in Q1 FY18 down 25% yoy, dipping
below 5% of revenue) and consequent greater free-cash-flow generation
(much higher EBITDA and discipline in working capital). Therefore, we
maintain our target multiple at 7.5x (reflecting slower revenue growth,
dependence on one vertical and our view of BPO being at higher risk than
IT due to new technologies). We maintain our Buy rating with an
unchanged target price (`700, at 7.5x FY19e PE).
Firstsource and HGS are experiencing slow organic growth at the industry
level, and growth seems to be concentrated in a few verticals. Of the two,
though, HGS is growing more rapidly organically, but heavily depends on
one vertical: Healthcare. The US is currently traversing a phase of
regulatory uncertainty and that includes healthcare (The Affordable Care
Act). This also constrains our target multiple for HGS.
At the industry level, we are setting a discount to BPO companies
compared to IT-services companies since the latter are higher up the value
chain than the former. We believe that, at this stage, automation threats
may be greater for BPO companies than for IT-services companies.
Therefore, on being exposed to these counters, one needs to build in a
margin of safety in terms of valuations.
Consequently, we believe that HGS is quite close to its peak growth and
margin profile. But valuations have potential if the company can
consistently deliver on free cash-flows and dividends.
Fig 16 – Change in estimates
FY18 FY19
(` m) New Old Chg % New Old Chg %
Revenues ($ m) 594 592 0.3 628 631 (0.5)
Revenues 38,336 39,476 (2.9) 40,498 42,047 (3.7)
EBITDA 4,397 4,619 (4.8) 4,472 4,723 (5.3)
EBITDA margin % 11 12 -23 bps 11 11 -19 bps
EBIT 2,896 3,087 (6.2) 2,843 3,060 (7.1)
EBIT margin % 8 8 -26 bps 7 7 -26 bps
PAT 1,932 1,971 (2.0) 1,921 1,969 (2.4)
Source: Company, Anand Rathi Research
Fig 17 – PE band (one-year forward)
Source : Bloomberg, Anand Rathi Research
0
2
4
6
8
10
12
14
Sep-11
Feb-12
Jul-12
Dec-12
May-13
Oct-13
Mar-14
Aug-14
Jan-15
Jun-15
Nov-15
Apr-16
Sep-16
Feb-17
Jul-17
HGSL
7. 14 August 2017 Hinduja Global Solutions – On strong FCF generation, robust balance sheet; Buy
Anand Rathi Research 7
Risks
Capital allocation: HGS is shifting from a capital-intensive business
model to a low-capex one, and is expected to take up additional areas
on rent to the extent possible. This, if sustained, has the potential to
improve its balance sheet and cash-flows. However, any reversion to
the capex-heavy model would be a huge negative.
Long-term risks due to automation: We reckon that the BPO sector
could see slower-than-industry revenue growth on account of the
impact of automation on the industry.
8. Appendix
Analyst Certification
The views expressed in this Research Report accurately reflect the personal views of the analyst(s) about the subject securities or issuers and no part of the
compensation of the research analyst(s) was, is, or will be directly or indirectly related to the specific recommendations or views expressed by the research
analyst(s) in this report. The research analysts are bound by stringent internal regulations and also legal and statutory requirements of the Securities and Exchange
Board of India (hereinafter “SEBI”) and the analysts’ compensation are completely delinked from all the other companies and/or entities of Anand Rathi, and have
no bearing whatsoever on any recommendation that they have given in the Research Report.
Important Disclosures on subject companies
Rating and Target Price History (as of 14 August 2017)
Date Rating
TP
(`)
Share
Price (`)
1 28-Oct-14 Buy 980 651
2 09-Apr-15 Buy 940 574
3 09-Nov-15 Buy 670 471
4 13-Dec-16 Buy 650 533
5 10-Feb-17 Hold 700 605
6 23-May-17 Buy 700 528
Anand Rathi Ratings Definitions
Analysts’ ratings and the corresponding expected returns take into account our definitions of Large Caps (>US$1bn) and Mid/Small Caps (<US$1bn) as described
in the Ratings Table below:
Ratings Guide (12 months)
Buy Hold Sell
Large Caps (>US$1bn) >15% 5-15% <5%
Mid/Small Caps (<US$1bn) >25% 5-25% <5%
Research Disclaimer and Disclosure inter-alia as required under Securities and Exchange Board of India (Research Analysts) Regulations, 2014
Anand Rathi Share and Stock Brokers Ltd. (hereinafter refer as ARSSBL) (Research Entity) is a subsidiary of Anand Rathi Financial Services Ltd. ARSSBL is a
corporate trading and clearing member of Bombay Stock Exchange Ltd, National Stock Exchange of India Ltd. (NSEIL), Multi Stock Exchange of India Ltd (MCX-
SX), United Stock Exchange and also depository participant with National Securities Depository Ltd (NSDL) and Central Depository Services Ltd. ARSSBL is
engaged in the business of Stock Broking, Depository Participant and Mutual Fund distributor.
The research analysts, strategists, or research associates principally responsible for the preparation of Anand Rathi research have received compensation based
upon various factors, including quality of research, investor client feedback, stock picking, competitive factors and firm revenues.
General Disclaimer: This Research Report (hereinafter called “Report”) is meant solely for use by the recipient and is not for circulation. This Report does not
constitute a personal recommendation or take into account the particular investment objectives, financial situations, or needs of individual clients. The
recommendations, if any, made herein are expression of views and/or opinions and should not be deemed or construed to be neither advice for the purpose of
purchase or sale of any security, derivatives or any other security through ARSSBL nor any solicitation or offering of any investment /trading opportunity on behalf
of the issuer(s) of the respective security (ies) referred to herein. These information / opinions / views are not meant to serve as a professional investment guide for
the readers.No action is solicited based upon the information provided herein. Recipients of this Report should rely on information/data arising out of their own
investigations. Readers are advised to seek independent professional advice and arrive at an informed trading/investment decision before executing any trades or
making any investments. This Report has been prepared on the basis of publicly available information, internally developed data and other sources believed by
ARSSBL to be reliable. ARSSBL or its directors, employees, affiliates or representatives do not assume any responsibility for, or warrant the accuracy,
completeness, adequacy and reliability of such information / opinions / views. While due care has been taken to ensure that the disclosures and opinions given are
fair and reasonable, none of the directors, employees, affiliates or representatives of ARSSBL shall be liable for any direct, indirect, special, incidental,
consequential, punitive or exemplary damages, including lost profits arising in any way whatsoever from the information / opinions / views contained in this Report.
The price and value of the investments referred to in this Report and the income from them may go down as well as up, and investors may realize losses on any
investments. Past performance is not a guide for future performance. ARSSBL does not provide tax advice to its clients, and all investors are strongly advised to
consult with their tax advisers regarding taxation aspects of any potential investment.
Opinions expressed are our current opinions as of the date appearing on this Research only. We do not undertake to advise you as to any change of our views
expressed in this Report. Research Report may differ between ARSSBL’s RAs and/ or ARSSBL’s associate companies on account of differences in research
methodology, personal judgment and difference in time horizons for which recommendations are made. User should keep this risk in mind and not hold ARSSBL,
its employees and associates responsible for any losses, damages of any type whatsoever.
HGSL
6
1
2
3
4
5
350
400
450
500
550
600
650
Jan-14
Apr-14
Jul-14
Oct-14
Jan-15
Apr-15
Jul-15
Oct-15
Jan-16
Apr-16
Jul-16
Oct-16
Jan-17
Apr-17
Jul-17