꧁❤ Greater Noida Call Girls Delhi ❤꧂ 9711199171 ☎️ Hard And Sexy Vip Call
Majesco 1QFY18
1. Anand Rathi Share and Stock Brokers Limited (hereinafter “ARSSBL”) is a full-service brokerage and equities-research firm and the views expressed therein are solely of
ARSSBL and not of the companies which have been covered in the Research Report. This report is intended for the sole use of the Recipient. Disclosures and analyst
certifications are present in the Appendix.
Anand Rathi Research India Equities
Technology
Company Update
India I Equities
Key financials (YE Mar) FY15 FY16 FY17 FY18e FY19e
Sales (` m) - 7,571 8,275 8,300 9,391
Net profit (` m) - 69 143 325 392
EPS (`) - 2.8 5.8 13.2 15.9
Growth (%) - NM 106.4 127.7 20.5
PE (x) - 129.6 62.8 27.6 22.9
PBV (x) - 3.2 3.1 2.8 2.5
RoE (%) - 5.0 5.1 10.7 11.5
RoCE (%) - -1.7 6.3 12.9 16.7
Dividend yield (%) - - - - -
Net debt / equity (x) - -0.1 -0.3 -0.4 -0.4
Source: Company, Anand Rathi Research
Mohit Jain
Research Analyst
+9122 6626 6531
mohitjain@rathi.com
Shobit Singhal
Research Associate
+9122 6626 6511
shobitsinghal@rathi.com
`
Rating: Buy
Target Price: `540
Share Price: `363
Key data MJCO IN / MAJC.BO
52-week high / low `569 / `300
Sensex / Nifty 32383 / 10021
3-m average volume $1.1m
Market cap `9bn / $132.9m
Shares outstanding 23m
Shareholding pattern (%) June'17 Mar'17 Dec'16
Promoters 48.0 48.3 48.4
- of which, Pledged - - -
Free float 52.0 51.7 51.6
- Foreign institutions 2.6 2.4 2.7
- Domestic institutions 10.3 10.6 10.8
- Public 39.1 38.7 38.1
27 July 2017
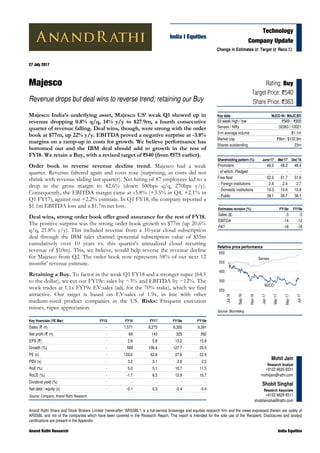
Majesco
Revenue drops but deal wins to reverse trend; retaining our Buy
Majesco India’s underlying asset, Majesco US’ weak Q1 showed up in
revenue dropping 0.8% q/q, 14% y/y to $27.9m, a fourth consecutive
quarter of revenue falling. Deal wins, though, were strong with the order
book at $77m, up 22% y/y. EBITDA proved a negative surprise at -3.8%
margins on a ramp-up in costs for growth. We believe performance has
bottomed out and the IBM deal should add to growth in the rest of
FY18. We retain a Buy, with a revised target of `540 (from `575 earlier).
Order book to reverse revenue decline trend. Majesco had a weak
quarter. Revenue faltered again and costs rose (surprising, as costs did not
shrink with revenue sliding last quarter). Net hiring of 87 employees led to a
drop in the gross margin to 42.6% (down 500bps q/q, 270bps y/y).
Consequently, the EBITDA margin came at -3.8% (+3.5% in Q4, +2.1% in
Q1 FY17), against our +2.2% estimate. In Q1 FY18, the company reported a
$1.1m EBITDA loss and a $1.7m net loss.
Deal wins, strong order book offer good assurance for the rest of FY18.
The positive surprise was the strong order-book growth to $77m (up 20.6%
q/q, 21.8% y/y). This included revenue from a 10-year cloud subscription
deal through the IBM sales channel (potential subscription value of $35m
cumulatively over 10 years vs. this quarter’s annualized cloud recurring
revenue of $10m). This, we believe, would help reverse the revenue decline
for Majesco from Q2. The order book now represents 58% of our next 12
months’ revenue estimate.
Retaining a Buy. To factor in the weak Q1 FY18 and a stronger rupee (64.5
to the dollar), we cut our FY19e: sales by ~3% and EBITDA by ~12%. The
stock trades at 1.1x FY19e EV:sales (adj. for the 70% stake), which we find
attractive. Our target is based on EV:sales of 1.9x, in line with other
medium-sized product companies in the US. Risks: Frequent execution
misses, rupee appreciation.
Relative price performance
Source: Bloomberg
MJCO
Sensex
250
350
450
550
650
Jul-16
Sep-16
Nov-16
Jan-17
Mar-17
May-17
Jul-17
Estimates revision (%) FY18e FY19e
Sales ($) -3 -3
EBITDA -14 -12
PAT -18 -18
Change in Estimates Target Reco
3. 27 July 2017 Majesco – Revenue drops but deal wins to reverse trend; retaining our Buy
Anand Rathi Research 3
Majesco US: Result highlights
Q1 FY18 Results at a glance
Fig 8 – Quarterly result (Majesco US)
Year-end: Mar Q1 FY18 % q/q % y/y FY17 FY16 % y/y
Sales ($ m) 28 (0.8) (14.2) 122 113 7.5
Sales (` m) 1,801 (4.6) (17.3) 8,167 7,443 9.7
EBITDA (` m) (69) NA NA 301 (13) NA
EBITDA margin (%) (3.8) -733 bps -591 bps 3.7 (0.2) 385 bps
EBIT (` m) (151) 739.3 418.0 (16) (265) (94.0)
EBIT margin (%) (8.4) -742 bps -703 bps (0.2) (3.6) 336 bps
PBT (` m) (161) NA NA (55) (314) (82.4)
Tax (` m) 54 NA NA (7) 77 NA
Tax rate (%) (33.8) NA NA 11.8 (24.6) NA
Net Income (` m) (106) NA NA (62) (237) NA
Source: Company, Anand Rathi Research
Fig 7 – Majesco US segment-wise results
Q1 FY17 Q2 FY17 Q3 FY17 Q4 FY17 Q1 FY18 Q/Q % Y/Y %
Revenues ($ m) 32.6 31.0 30.0 28.2 27.9 -0.8 -14
Revenues (` m) 2,178 2,077 2,026 1,887 1,801 -4.6 -17
Eff. exchange rate 66.9 66.9 67.5 67.0 64.5 -3.8 -4
Order backlog 63.4 65.1 62.1 64.0 77.2 20.6 22
QoQ growth % -12 3 -5 3 21
Cost of revenues (excl. D&A) (21.4) (19.2) (18.3) (18.0) (18.9) 5.3 -12
As % of revenue -66 -62 -61 -64 -68 -394bps -194bps
Employee cost (18) (16) (15) (15) (16)
Utilization % 45 50 49 48 42.64 -494bps -268bps
-R&D costs (4.5) (4.5) (4.0) (4.2) (3.9) -7.0 -13
As % of revenue -14 -15 -13 -15 -14 93bps -17bps
SG&A(excl D&A) (10) (10) (10) (9) (10) 9.5 -4
As % of revenues -32 -34 -34 -33 -36 -339bps -397bps
EBITDA 0.7 1.4 1.4 1.0 (1.1) NA NA
EBITDA margins % 2.1 4.5 4.7 3.5 -4 -733bps -591bps
D&A (1.1) (1.1) (1.2) (1.3) (1.3) 0.0 14.0
EBIT -0.43 0.27 0.19 -0.27 -2.34 NA NA
EBIT margins % -1.3 0.9 0.6 -1.0 -8.4 -742bps -703bps
Other income (0.2) (0.1) 0.1 (0.4) (0.04) -89.5 -81.7
PBT -0.64 0.16 0.27 -0.62 -2.50 NA NA
PBT margins % -2.0 0.5 0.9 -2.2 -8.9 -674bps -698bps
Taxes 0.1 0.1 (0.1) (0.2) 0.8 NA NA
ETR % -14 33 -21 29 -34 NA NA
Net profit ($ m) (0.5) 0.2 0.2 (0.8) (1.7) NA NA
Net profit (` m) (37) 15 14 (54) (106) NA NA
Source: Company, Anand Rathi Research
4. 27 July 2017 Majesco – Revenue drops but deal wins to reverse trend; retaining our Buy
Anand Rathi Research 4
Factsheet (Majesco US)
Fig 9 – Revenue-split, by LOB
(%) Q1 FY17 Q2 FY17 Q3 FY17 Q4 FY17 Q1 FY18
P&C 80 81 83 85 81
L&A 18 18 15 14 18
Non-insurance 2 1 2 2 2
Total 100.0 100.0 100.0 100.0 100.0
Source: Company, Anand Rathi Research
Fig 10 – Revenue growth, by LOB (Q/Q)
(%) Q1 FY17 Q2 FY17 Q3 FY17 Q4 FY17 Q1 FY18
P&C 4 -3 0 -4 -6
L&A -10 -9 -18 -15 29
Non-insurance -24 -26 17 -12 24
Total 1 -5 -3 -6 -1
Source: Company, Anand Rathi Research
Fig 11 – Revenue-split, by region
(%) Q1 FY17 Q2 FY17 Q3 FY17 Q4 FY17 Q1 FY18
North America 89 89 90 90 90
UK 7 8 6 6 5
APAC 3 3 4 5 5
Total 100.0 100.0 100.0 100.0 100.0
Source: Company, Anand Rathi Research
Fig 12 – Region-wise growth (Q/Q)
(%) Q1 FY17 Q2 FY17 Q3 FY17 Q4 FY17 Q1 FY18
North America 0 -5 -3 -6 -1
UK -1 -2 -18 -19 -4
APAC 18 -5 8 14 8
Total 1 -5 -3 -6 -1
Source: Company, Anand Rathi Research
Fig 13 – Client Contribution
(%) Q1 FY17 Q2 FY17 Q3 FY17 Q4 FY17 Q1 FY18
Top 1 11.4 8.4 7.1 6.2 6.1
Top 5 28.5 28.6 28.1 24.2 24
Top 10 42.5 42.5 42.7 38.2 40.4
Source: Company, Anand Rathi Research
Fig 14 – Client Contribution
($ m) Q1 FY17 Q2 FY17 Q3 FY17 Q4 FY17 Q1 FY18
Top 1 3.7 2.6 2.1 1.7 1.7
Next 2-5 5.6 6.3 6.3 5.1 5.0
Next 6-10 4.6 4.3 4.4 3.9 4.6
Revenues from Top 10 13.8 13.2 12.8 10.8 11.3
Source: Company, Anand Rathi Research
5. 27 July 2017 Majesco – Revenue drops but deal wins to reverse trend; retaining our Buy
Anand Rathi Research 5
Valuations
We value Majesco at 1.9x FY19e EV:sales (the same as earlier) to reflect
the greater dependence on revenue growth for the company’s financial
success at this stage. Our target multiple for Majesco (adj. for profitability)
is also similar to our target multiple for Intellect Design, given the similarity
in size, cost pools, industry and stage of the two companies.
For Majesco, margins are expected to be volatile given that the company is
still operating close to break-even. Since Majesco India has a 70% stake in
Majesco US, the target multiple of 1.9x translates to 1.4x FY19e EV:sales
(reported basis). This is because the Indian entity fully consolidates
Majesco US’s earnings while owning only 70%; the balance 30% is shown
in the accounts as minority interest.
We reckon good scope exists for Majesco to catch up on valuations if it
delivers on its revenue and margin goals. It is struggling on the revenue
growth side (the most critical factor for its success) but is on a good
trajectory regarding margins (excluding Q1 FY18). If execution progresses
well (or recover on the revenue growth side given the strong order book in
Q1 FY18) without losing market share, the underlying asset could trade at
1.9x FY19e EV/sales by next financial year-end (Mar’18).
We are not applying any holding-company discount or premium to
Majesco India as we do not believe there is a case of either premium or
discount (Majesco India operates in only one segment, insurance
technology). The stock trades on par with the US entity.
Fig 15 – Change in estimates
FY18 FY19
New Old Chg % New Old Chg %
Revenues ($ m) 129 132 -3 146 150 -3
Revenues (` m) 8,300 8,869 -6 9,391 10,036 -6
EBITDA (` m) 679 794 -14 926 1,053 -12
EBITDA margin % 8.2 9.0 -77 bps 9.9 10.5 -62 bps
EBIT (` m) 427 537 -20 652 774 -16
EBIT margin % 5.1 6.1 -91 bps 6.9 7.7 -76 bps
PBT 491 597 -18 656 789 -17
Net profit 325 396 -18 392 477 -18
Source: Anand Rathi Research
Fig 16 – EV/EBITDA (one- year forward)
Source: Bloomberg, Anand Rathi Research
0.0
0.5
1.0
1.5
2.0
2.5
3.0
3.5
Aug-15
Oct-15
Dec-15
Feb-16
Apr-16
May-16
Jul-16
Sep-16
Nov-16
Jan-17
Mar-17
May-17
Jul-17
6. 27 July 2017 Majesco – Revenue drops but deal wins to reverse trend; retaining our Buy
Anand Rathi Research 6
Risks
Execution miss: The company has, in the past, shown more volatility
than a typical IT-services company as it is on the discretionary side of
the business (software purchases or upgrades). Also, it operates in a
highly competitive arena and competes with larger entities. Therefore,
execution needs to be flawless.
Vigorous M&A strategy: Majesco has relied on its M&A strategy to
gain scale fast. This inherently gives rise to risks (cultural and technical
integration) as well as to the balance sheet (due to upfront payments).
The balance sheet, at present doesn’t leave any scope for Majesco to go
wrong on this front.
Sharp rupee appreciation
7. Appendix
Analyst Certification
The views expressed in this Research Report accurately reflect the personal views of the analyst(s) about the subject securities or issuers and no part of the
compensation of the research analyst(s) was, is, or will be directly or indirectly related to the specific recommendations or views expressed by the research
analyst(s) in this report. The research analysts are bound by stringent internal regulations and also legal and statutory requirements of the Securities and Exchange
Board of India (hereinafter “SEBI”) and the analysts’ compensation are completely delinked from all the other companies and/or entities of Anand Rathi, and have
no bearing whatsoever on any recommendation that they have given in the Research Report.
Important Disclosures on subject companies
Rating and Target Price History (as of 27 July 2017)
MJCO
5
1
2
3 4
0
100
200
300
400
500
600
700
800
Aug-15
Sep-15
Oct-15
Nov-15
Dec-15
Jan-16
Feb-16
Mar-16
Apr-16
May-16
Jun-16
Jul-16
Aug-16
Sep-16
Oct-16
Nov-16
Dec-16
Jan-17
Feb-17
Mar-17
Apr-17
May-17
Jun-17
Jul-17
Date Rating
TP
(`)
Share
Price (`)
1 25-May-16 Buy 750 556
2 12-Oct-16 Buy 710 462
3 06-Jan-17 Buy 670 405
4 25-Jan-17 Buy 620 388
5 04-May-17 Buy 575 360
Anand Rathi Ratings Definitions
Analysts’ ratings and the corresponding expected returns take into account our definitions of Large Caps (>US$1bn) and Mid/Small Caps (<US$1bn) as described
in the Ratings Table below:
Ratings Guide (12 months)
Buy Hold Sell
Large Caps (>US$1bn) >15% 5-15% <5%
Mid/Small Caps (<US$1bn) >25% 5-25% <5%
Research Disclaimer and Disclosure inter-alia as required under Securities and Exchange Board of India (Research Analysts) Regulations, 2014
Anand Rathi Share and Stock Brokers Ltd. (hereinafter refer as ARSSBL) (Research Entity) is a subsidiary of Anand Rathi Financial Services Ltd. ARSSBL is a
corporate trading and clearing member of Bombay Stock Exchange Ltd, National Stock Exchange of India Ltd. (NSEIL), Multi Stock Exchange of India Ltd (MCX-
SX), United Stock Exchange and also depository participant with National Securities Depository Ltd (NSDL) and Central Depository Services Ltd. ARSSBL is
engaged in the business of Stock Broking, Depository Participant and Mutual Fund distributor.
The research analysts, strategists, or research associates principally responsible for the preparation of Anand Rathi research have received compensation based
upon various factors, including quality of research, investor client feedback, stock picking, competitive factors and firm revenues.
General Disclaimer: This Research Report (hereinafter called “Report”) is meant solely for use by the recipient and is not for circulation. This Report does not
constitute a personal recommendation or take into account the particular investment objectives, financial situations, or needs of individual clients. The
recommendations, if any, made herein are expression of views and/or opinions and should not be deemed or construed to be neither advice for the purpose of
purchase or sale of any security, derivatives or any other security through ARSSBL nor any solicitation or offering of any investment /trading opportunity on behalf
of the issuer(s) of the respective security (ies) referred to herein. These information / opinions / views are not meant to serve as a professional investment guide for
the readers. No action is solicited based upon the information provided herein. Recipients of this Report should rely on information/data arising out of their own
investigations. Readers are advised to seek independent professional advice and arrive at an informed trading/investment decision before executing any trades or
making any investments. This Report has been prepared on the basis of publicly available information, internally developed data and other sources believed by
ARSSBL to be reliable. ARSSBL or its directors, employees, affiliates or representatives do not assume any responsibility for, or warrant the accuracy,
completeness, adequacy and reliability of such information / opinions / views. While due care has been taken to ensure that the disclosures and opinions given are
fair and reasonable, none of the directors, employees, affiliates or representatives of ARSSBL shall be liable for any direct, indirect, special, incidental,
consequential, punitive or exemplary damages, including lost profits arising in any way whatsoever from the information / opinions / views contained in this Report.
The price and value of the investments referred to in this Report and the income from them may go down as well as up, and investors may realize losses on any
investments. Past performance is not a guide for future performance. ARSSBL does not provide tax advice to its clients, and all investors are strongly advised to
consult with their tax advisers regarding taxation aspects of any potential investment.
Opinions expressed are our current opinions as of the date appearing on this Research only. We do not undertake to advise you as to any change of our views
expressed in this Report. Research Report may differ between ARSSBL’s RAs and/ or ARSSBL’s associate companies on account of differences in research
methodology, personal judgment and difference in time horizons for which recommendations are made. User should keep this risk in mind and not hold ARSSBL,
its employees and associates responsible for any losses, damages of any type whatsoever.