Buy Makers Laboratories, company growing rapidly with strong thrust on branded generics
•
1 like•375 views

Buy Makers Laboratories, company growing with strong thrust on branded generics #BrokerAdvice http://goo.gl/5xzfQ1

Recommended
Recommended
More Related Content
What's hot
What's hot (19)
Similar to Buy Makers Laboratories, company growing rapidly with strong thrust on branded generics
Similar to Buy Makers Laboratories, company growing rapidly with strong thrust on branded generics (20)
More from IndiaNotes.com
More from IndiaNotes.com (20)
Recently uploaded
Recently uploaded (20)
Buy Makers Laboratories, company growing rapidly with strong thrust on branded generics
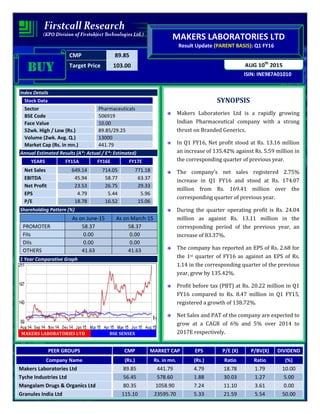
- 1. CMP 89.85 Target Price 103.00 ISIN: INE987A01010 AUG 10th 2015 MAKERS LABORATORIES LTD Result Update (PARENT BASIS): Q1 FY16 BUYBUYBUYBUY Index Details Stock Data Sector Pharmaceuticals BSE Code 506919 Face Value 10.00 52wk. High / Low (Rs.) 89.85/29.25 Volume (2wk. Avg. Q.) 13000 Market Cap (Rs. in mn.) 441.79 Annual Estimated Results (A*: Actual / E*: Estimated) YEARS FY15A FY16E FY17E Net Sales 649.14 714.05 771.18 EBITDA 45.94 58.77 63.37 Net Profit 23.53 26.75 29.33 EPS 4.79 5.44 5.96 P/E 18.78 16.52 15.06 Shareholding Pattern (%) As on June-15 As on March-15 PROMOTER 58.37 58.37 FIIs 0.00 0.00 DIIs 0.00 0.00 OTHERS 41.63 41.63 1 Year Comparative Graph MAKERS LABORATORIES LTD BSE SENSEX SYNOPSIS Makers Laboratories Ltd is a rapidly growing Indian Pharmaceutical company with a strong thrust on Branded Generics. In Q1 FY16, Net profit stood at Rs. 13.16 million an increase of 135.42% against Rs. 5.59 million in the corresponding quarter of previous year. The company’s net sales registered 2.75% increase in Q1 FY16 and stood at Rs. 174.07 million from Rs. 169.41 million over the corresponding quarter of previous year. During the quarter operating profit is Rs. 24.04 million as against Rs. 13.11 million in the corresponding period of the previous year, an increase of 83.37%. The company has reported an EPS of Rs. 2.68 for the 1st quarter of FY16 as against an EPS of Rs. 1.14 in the corresponding quarter of the previous year, grew by 135.42%. Profit before tax (PBT) at Rs. 20.22 million in Q1 FY16 compared to Rs. 8.47 million in Q1 FY15, registered a growth of 138.72%. Net Sales and PAT of the company are expected to grow at a CAGR of 6% and 5% over 2014 to 2017E respectively. PEER GROUPS CMP MARKET CAP EPS P/E (X) P/BV(X) DIVIDEND Company Name (Rs.) Rs. in mn. (Rs.) Ratio Ratio (%) Makers Laboratories Ltd 89.85 441.79 4.79 18.78 1.79 10.00 Tyche Industries Ltd 56.45 578.60 1.88 30.03 1.27 5.00 Mangalam Drugs & Organics Ltd 80.35 1058.90 7.24 11.10 3.61 0.00 Granules India Ltd 115.10 23595.70 5.33 21.59 5.54 50.00
- 2. QUARTERLY HIGHLIGHTS (PARENT BASIS) Results updates- Q1 FY16, Makers Laboratories Limited is a rapidly growing Indian Pharmaceutical company with a strong thrust on Branded Generics, has reported its financial results for the quarter ended 30th June, 2015. The company has achieved a turnover of Rs. 174.07 million for the 1st quarter of the current year 2015-16 as against Rs. 169.41 million in the corresponding quarter of the previous year. EBITDA of Rs. 24.04 million in Q1 FY16, an increase of 83.37% against the corresponding period of last year. In Q1 FY16, net profit of Rs. 13.16 million against Rs. 5.59 million in the corresponding quarter of the previous year. The company has reported an EPS of Rs. 2.68 for the 1st quarter as against an EPS of Rs. 1.14 in the corresponding quarter of the previous year. Break up of Expenditure Rs. In million June-15 June-14 % CHNG Net Sales 174.07 169.41 2.75 PAT 13.16 5.59 135.42 EPS 2.68 1.14 135.42 EBITDA 24.04 13.11 83.37 Break up of Expenditure (Rs in millions) Q1 FY16 Q1 FY15 % CHNG Cost of materials consumed 53.25 65.70 -19% Purchases of stock-in-trade 69.40 75.68 -8% Employee benefit expense 19.26 16.90 14% Depreciation/Amortization Expense 3.06 3.74 -18% Other expenses 33.39 35.48 -6%
- 3. COMPANY PROFILE Makers Laboratories Limited is a rapidly growing Indian Pharmaceutical company with a strong thrust on Branded Generics. The company’s product portfolio covers a wide range of General Health Therapeutic segments. The company’s top formulation brands are Duramol (Paracetamol), Artemak-AB (α-β Arteether), Loroquin (Chloroquine), Nimuwin (Nimuselide), Coffwin (Anti cough Range) and Exylin (Amoxycillin range). Makers Laboratories Limited operate on a PAN India basis with strong distribution network of 20 Consignment Agents, catering to more than 1500 Stockist, 1,00,000 Doctors and 2,00,000 Retailers. Each of company’s Consignment Agent has their own stockist network, which expand the reach of company’s products to the common man. This network of Stockist is enhanced further by strong field staff. Makers Laboratories Limited fulfills an important Corporate Social Responsibility by offering business opportunities to young Indian. Makers Laboratories train them to become Business Associates. The company’s products are propagated in both the urban and rural areas of India by such trained Business Associates.. Makers Laboratories Limited believes in Quality & ensure that all requisite quality norms are adhered to. Makers Laboratories Limited makes life easier by offering high quality products at affordable prices.
- 4. FINANCIAL HIGHLIGHT (PARENT BASIS) (A*- Actual, E* -Estimations & Rs. In Millions) Balance Sheet as at March 31, 2014 -2017E FY14A FY15A FY16E FY17E I. EQUITY AND LIABILITIES: A. Shareholders’ Funds a) Share Capital 49.17 49.17 49.17 49.17 b) Reserves and Surplus 179.86 197.08 223.83 253.16 Sub-Total-Net worth 229.03 246.25 273.00 302.33 B. Non-Current Liabilities: a) Deferred Tax Liabilities [Net] 7.52 6.54 6.15 5.84 b) Other Long Term Liabilities 40.03 37.74 39.25 40.43 c) Long Term Provisions 1.28 1.81 2.06 2.27 Sub-Total-Long term liabilities 48.83 46.09 47.46 48.54 C. Current Liabilities: a) Short-term borrowings 21.19 7.97 7.17 6.60 b) Trade Payables 104.61 75.49 79.26 82.44 c) Other Current Liabilities 3.72 3.79 4.02 4.18 d) Short Term Provisions 2.82 11.37 13.42 15.29 Sub-Total-Current Liabilities 132.34 98.62 103.87 108.51 TOTAL-EQUITY AND LIABILITIES (A+B+C) 410.20 390.96 424.33 459.37 II. ASSETS: D. Non-Current Assets: Fixed Assets i. Tangible Assets 118.37 113.97 125.37 137.81 ii. Intangible Assets 0.98 0.69 0.90 1.08 iii. Capital work-in-progress 19.15 27.10 31.17 34.28 a) Sub-Total Fixed Assets 138.50 141.76 157.43 173.17 b) Non Current Investments 24.97 23.52 24.46 25.93 c) Long Term Loans and Advances 8.15 3.12 3.40 3.67 d) Other non-current assets 2.65 4.06 4.63 5.14 Sub-Total-Non-Current Assets 174.27 172.46 189.92 207.91 E. Current Assets: a) Inventories 99.19 92.49 100.81 109.28 b) Trade Receivables 125.33 118.35 125.14 132.65 c) Cash and Bank Balances 1.39 0.75 0.90 1.06 d) Short Term Loans and Advances 5.67 4.31 5.11 5.88 e) Other Current Assets 4.35 2.60 2.44 2.59 Sub-Total-Current Assets 235.93 218.50 234.41 251.46 TOTAL-ASSETS (D+E) 410.20 390.96 424.33 459.37
- 5. Annual Profit & Loss Statement for the period of 2014 to 2017E Value(Rs.in.mn) FY14A FY15A FY16E FY17E Description 12m 12m 12m 12m Net Sales 683.73 649.14 714.05 771.18 Other Income 5.47 4.66 5.22 5.53 Total Income 689.20 653.80 719.27 776.71 Expenditure -663.30 -607.86 -660.50 -713.34 Operating Profit 25.90 45.94 58.77 63.37 Interest -4.29 -3.82 -3.51 -3.69 Gross profit 21.61 42.12 55.26 59.68 Depreciation -9.74 -15.27 -16.49 -17.48 Exceptoional Items 0.00 7.16 0.00 0.00 Profit Before Tax 11.87 34.01 38.77 42.20 Tax -5.92 -10.48 -12.02 -12.87 Net Profit 5.95 23.53 26.75 29.33 Equity capital 49.17 49.17 49.17 49.17 Reserves 179.86 197.08 223.83 253.16 Face value 10.00 10.00 10.00 10.00 EPS 1.21 4.79 5.44 5.96 Quarterly Profit & Loss Statement for the period of 31st Dec, 2014 to 30 Sep, 2015E Value(Rs.in.mn) 31-Dec-14 31-Mar-15 30-Jun-15 30-Sep-15E Description 3m 3m 3m 3m Net sales 151.32 139.05 174.07 193.22 Other income 1.08 1.29 1.46 1.53 Total Income 152.40 140.34 175.53 194.75 Expenditure -145.98 -132.07 -151.49 -178.53 Operating profit 6.42 8.27 24.04 16.22 Interest -0.95 -0.67 -0.76 -0.65 Gross profit 5.47 7.60 23.28 15.57 Depreciation -3.98 -3.65 -3.06 -3.55 Exceptional Items 7.16 0.00 0.00 0.00 Profit Before Tax 8.65 3.95 20.22 12.02 Tax -2.00 -0.97 -7.06 -3.44 Net Profit 6.65 2.98 13.16 8.58 Equity capital 49.17 49.17 49.17 49.17 Face value 10.00 10.00 10.00 10.00 EPS 1.35 0.61 2.68 1.75
- 6. Ratio Analysis Particulars FY14A FY15A FY16E FY17E EPS (Rs.) 1.21 4.79 5.44 5.96 EBITDA Margin (%) 3.79 7.08 8.23 8.22 PBT Margin (%) 1.74 5.24 5.43 5.47 PAT Margin (%) 0.87 3.62 3.75 3.80 P/E Ratio (x) 74.25 18.78 16.52 15.06 ROE (%) 2.60 9.56 9.80 9.70 ROCE (%) 14.24 24.08 26.86 26.17 Debt Equity Ratio 0.09 0.03 0.03 0.02 EV/EBITDA (x) 17.82 9.77 7.62 7.06 Book Value (Rs.) 46.58 50.08 55.52 61.49 P/BV 1.93 1.79 1.62 1.46 Charts
- 7. OUTLOOK AND CONCLUSION At the current market price of Rs. 89.85, the stock P/E ratio is at 16.52 x FY16E and 15.06 x FY17E respectively. Earning per share (EPS) of the company for the earnings for FY16E and FY17E is seen at Rs.5.44 and Rs.5.96 respectively. Net Sales and PAT of the company are expected to grow at a CAGR of 6% and 5% over 2014 to 2017E respectively. On the basis of EV/EBITDA, the stock trades at 7.62 x for FY16E and 7.06 x for FY17E. Price to Book Value of the stock is expected to be at 1.62 x and 1.46 x for FY16E and FY17E respectively. We expect that the company surplus scenario is likely to continue for the next three years, will keep its growth story in the coming quarters also. We recommend ‘BUY’ in this particular scrip with a target price of Rs.103.00 for Medium to Long term investment. INDUSTRY OVERVIEW The Indian pharmaceuticals market is third largest in terms of volume and thirteen largest in terms of value, as per a pharmaceuticals sector analysis report by equity master. The market is dominated majorly by branded generics which constitute nearly 70 to 80 per cent of the market. Considered to be a highly fragmented industry,consolidation has increasingly become an important feature of the Indian pharmaceutical market. India has achieved an eminent global position in pharma sector. The country also has a huge pool of scientists and engineers who have the potential to take the industry to a very high level. The UN-backed Medicines Patents
- 8. Pool has signed six sub-licences with Aurobindo, Cipla, Desano, Emcure, Hetero Labs and Laurus Labs, allowing them to make generic anti-AIDS medicine Tenofovir Alafenamide (TAF) for 112 developing countries. The Indian pharmaceutical industry is estimated to grow at 20 per cent compound annual growth rate (CAGR) over the next five years, as per India Ratings, a Fitch Group company. Indian pharmaceutical manufacturing facilities registered with US Food and Drug Administration (FDA) as on March 2014 was the highest at 523 for any country outside the US. The Union Cabinet has given its approval to amend the existing FDI policy in the pharmaceutical sector in order to cover medical devices. The Cabinet has allowed FDI up to 100 per cent under the automatic route for manufacturing of medical devices subject to specified conditions. The drugs and pharmaceuticals sector attracted cumulative foreign direct investment (FDI) inflows worth US$ 12,813.02 million between April 2000 and December 2014, according to data released by the Department of Industrial Policy and Promotion (DIPP). Outlook The Indian pharma market size is expected to grow to US$ 85 billion by 2020. The growth in Indian domestic market will be on back of increasing consumer spending, rapid urbanisation, raising healthcare insurance and so on. Going forward, better growth in domestic sales will depend on the ability of companies to align their product portfolio towards chronic therapies for diseases such as such as cardiovascular, anti-diabetes, anti-depressants and anti-cancers are on the rise. Moreover, the government has been taking several cost effective measures in order to bring down healthcare expenses. Thus, governments are focusing on speedy introduction of generic drugs into the market. This too will benefit Indian pharma companies. In addition, the thrust on rural health programmes, life saving drugs and preventive vaccines also augurs well for the pharma companies. Disclaimer: This document is prepared by our research analysts and it does not constitute an offer or solicitation for the purchase or sale of any financial instrument or as an official confirmation of any transaction. The information contained herein is from publicly available data or other sources believed to be reliable but we do not represent that it is accurate or complete and it should not be relied on as such. Firstcall Research or any of its affiliates shall not be in any way responsible for any loss or damage that may arise to any person from any inadvertent error in the information contained in this report. Firstcall Research and/ or its affiliates and/or employees will not be liable for the recipients’ investment decision based on this document.
- 9. Firstcall India Equity Research: Email – info@firstobjectindia.com C.V.S.L.Kameswari Pharma & Diversified U. Janaki Rao Capital Goods B. Anil Kumar Auto, IT & FMCG M. Vinayak Rao Diversified G. Amarender Diversified Firstcall Research Provides Industry Research on all the Sectors and Equity Research on Major Companies forming part of Listed and Unlisted Segments For Further Details Contact: Tel.: 022-2527 2510/2527 6077 / 25276089 Telefax: 022-25276089 040-20000235 /20000233 E-mail: info@firstobjectindia.com www.firstcallresearch.com