1. Anand Rathi Share and Stock Brokers Limited (hereinafter “ARSSBL”) is a full-service brokerage and equities-research firm and the views expressed therein are solely of
ARSSBL and not of the companies which have been covered in the Research Report. This report is intended for the sole use of the Recipient. Disclosures and analyst
certifications are present in the Appendix.
Anand Rathi Research India Equities
Technology
Company Update
India I Equities
Mohit Jain
Research Analyst
+9122 6626 6531
mohitjain@rathi.com
Shobit Singhal
Research Associate
+9122 6626 6511
shobitsinghal@rathi.com
Key financials (YE Mar) FY15 FY16 FY17 FY18e FY19e
Sales (` m) 27,359 30,956 36,066 37,944 41,384
Net profit (` m) 3,533 3,262 3,699 3,805 4,231
EPS (`) 31.5 29.1 32.9 33.9 37.7
Growth (%) 32.8 -7.7 13.4 2.9 11.2
PE (x) 16.6 18.0 15.9 15.4 13.9
PBV (x) 3.2 3.1 2.8 2.5 2.2
RoE (%) 20.6 17.4 18.4 16.9 16.7
RoCE (%) 25.2 21.0 21.4 21.2 21.4
Dividend yield (%) 1.5 1.3 1.5 1.6 1.8
Net debt / equity (x) -0.3 -0.3 -0.4 -0.5 -0.5
Source: Company, Anand Rathi Research Note: FY15 figures are based on IND GAAP, hence not comparable
`
,
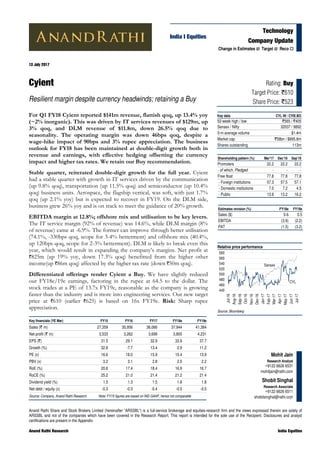
Rating: Buy
Target Price: `610
Share Price: `523
Key data CYL IN / CYIE.BO
52-week high / low `565 / `405
Sensex / Nifty 32037 / 9892
3-m average volume $1.4m
Market cap `58bn / $895.8m
Shares outstanding 113m
Shareholding pattern (%) Mar'17 Dec'16 Sep'16
Promoters 22.2 22.2 22.2
- of which, Pledged - - -
Free float 77.8 77.8 77.8
- Foreign institutions 57.3 57.5 57.1
- Domestic institutions 7.0 7.2 4.5
- Public 13.6 13.2 16.2
13 July 2017
Cyient
Resilient margin despite currency headwinds; retaining a Buy
For Q1 FY18 Cyient reported $141m revenue, flattish qoq, up 13.4% yoy
(~2% inorganic). This was driven by IT services revenues of $129m, up
3% qoq, and DLM revenue of $11.8m, down 26.5% qoq due to
seasonality. The operating margin was down 46bps qoq, despite a
wage-hike impact of 90bps and 3% rupee appreciation. The business
outlook for FY18 has been maintained at double-digit growth both in
revenue and earnings, with effective hedging offsetting the currency
impact and higher tax rates. We retain our Buy recommendation.
Stable quarter, reiterated double-digit growth for the full year. Cyient
had a stable quarter with growth in IT services driven by the communication
(up 9.8% qoq), transportation (up 11.5% qoq) and semiconductor (up 10.4%
qoq) business units. Aerospace, the flagship vertical, was soft, with just 1.7%
qoq (up 2.1% yoy) but is expected to recover in FY19. On the DLM side,
business grew 26% yoy and is on track to meet the guidance of 20% growth.
EBITDA margin at 12.8%; offshore mix and utilisation to be key levers.
The IT service margin (92% of revenue) was 14.6%, while DLM margin (8%
of revenue) came at -6.9%. The former can improve through better utilisation
(74.1%, -330bps qoq, scope for 3-4% betterment) and offshore mix (40.4%,
up 120bps qoq, scope for 2-3% betterment). DLM is likely to break even this
year, which would result in expanding the company’s margins. Net profit at
`825m (up 19% yoy, down 17.3% qoq) benefitted from the higher other
income(up `86m qoq) affected by the higher tax rate (down `50m qoq).
Differentiated offerings render Cyient a Buy. We have slightly reduced
our FY18e/19e earnings, factoring in the rupee at 64.5 to the dollar. The
stock trades at a PE of 13.7x FY19e, reasonable as the company is growing
faster than the industry and is more into engineering services. Our new target
price at `610 (earlier `625) is based on 16x FY19e. Risk: Sharp rupee
appreciation.
Relative price performance
Source: Bloomberg
CYL
Sensex
440
460
480
500
520
540
560
580
Jul-16
Aug-16
Sep-16
Oct-16
Nov-16
Dec-16
Jan-17
Feb-17
Mar-17
Apr-17
May-17
Jun-17
Jul-17
Estimates revision (%) FY18e FY19e
Sales ($) 0.6 0.5
EBITDA (3.9) (2.2)
PAT (1.5) (3.2)
Change in Estimates Target Reco
4. 13 July 2017 Cyient – Resilient margin despite currency headwinds; retaining a Buy
Anand Rathi Research 4
Fig 9 – Change in estimates
FY18 FY19
New Old Chg % New Old Chg %
Revenues ($ m) 588 584 0.6 642 639 0.5
Revenues (` m) 37,944 39,004 (2.7) 41,384 42,620 (2.9)
EBITDA (` m) 5,143 5,351 (3.9) 6,050 6,188 (2.2)
EBITDA margin % 13.6% 13.7% -16 bps 14.6% 14.5% 10 bps
EBIT (` m) 4,069 4,276 (4.8) 4,883 5,016 (2.7)
EBIT margin % 11% 11% -24 bps 12% 12% 3 bps
PAT (` m) 3,805 3,861 (1.5) 4,231 4,369 (3.2)
Source: Anand Rathi Research
5. 13 July 2017 Cyient – Resilient margin despite currency headwinds; retaining a Buy
Anand Rathi Research 5
Concall highlights
Cyient’s order intake was lower in Q1 FY18 due to the cyclicality of its
business and is likely to improve from Q2 FY18.
Half of the wage hike (90bps) and currency impact has come in Q1 FY18;
the other half will come in Q2.
DLM performance was in line with the seasonality and the guidance.
ETR for Q1 FY18 was 31%; on a recurring basis, it is is expected to be in
the range of ~26-28% from the earlier ~24% guidance, due to the slower-
than-anticipated ramp-up of people in SEZ.
The yoy increase in the tax rate was mainly due to SEZ units moving from
the 100% tax-exemption bracket to 50% tax exemption.
Other income gains will continue for most of FY18 as hedges are effective
($6.2m to be booked in FY18 at current rates).
Operating parameters
Growth was not broad-based. Within regions, the US grew 0.7% qoq,
APAC 1.9% qoq. Europe delivered 9% qoq growth.
Within verticals, Communications grew on the back of the strong
broadband plans rolled out in various regions (including the Liberty
Global deal ramp-ups).
The company benefited from the one-month additional consolidation
(~$0.5m monthly rate) of Certon.
Two verticals which stand out in growth outlook were Transportation
(Bombardier is doing very well for the company) and Semiconductors.
Both are seeing greater traction in FY18 and Cyient is poised to benefit
from the increased spending.
Outlook
The outlook for FY18 is unchanged. Management expects ~10% growth
in services in FY18, and 20%+ in DLM.
The operating margin in FY18 is expected to improve by 50 basis points,
driven by further improvements in operational efficiencies (utilisation and
offshore mix).
Earnings growth is expected to come in double digits.
8. 13 July 2017 Cyient – Resilient margin despite currency headwinds; retaining a Buy
Anand Rathi Research 8
Valuations
The stock trades at 13.7x FY19e EPS of `37.7. This, we think, is attractive,
given that Cyient is a uniquely-positioned engineering business with
considerable potential (the fastest-growing service line according to Nasscom
estimates). The company exhibits cyclicality but that can work upward as well.
After a year of specific headwinds it is poised for a upward trajectory.
With several issues now behind, we expect revenue growth to clock a 9%
CAGR in FY17-19.
Margins were flattish for FY17, despite headwinds such as cross-currency and,
toward the year-end, an appreciating rupee, which is commendable. The
company is now looking to expand its margin further in FY18.
With it set to benefit from opportunities in engineering and Defence (offset),
we value Cyient based on a target PE of 16x FY19e EPS.
Fig 18 – PE band
Source: Bloomberg, Anand Rathi Research
Risks
Sharp rupee appreciation.
12.0
13.0
14.0
15.0
16.0
17.0
18.0
19.0
20.0
Jan-15
Apr-15
Jul-15
Oct-15
Jan-16
Apr-16
Jul-16
Oct-16
Jan-17
Apr-17
Jul-17
9. Appendix
Analyst Certification
The views expressed in this Research Report accurately reflect the personal views of the analyst(s) about the subject securities or issuers and no part of the
compensation of the research analyst(s) was, is, or will be directly or indirectly related to the specific recommendations or views expressed by the research
analyst(s) in this report. The research analysts are bound by stringent internal regulations and also legal and statutory requirements of the Securities and Exchange
Board of India (hereinafter “SEBI”) and the analysts’ compensation are completely delinked from all the other companies and/or entities of Anand Rathi, and have
no bearing whatsoever on any recommendation that they have given in the Research Report.
Important Disclosures on subject companies
Rating and Target Price History (as of 13 July 2017)
Date Rating
TP
(`)
Share
Price (`)
1 30-Sep-14 Buy 520 450
2 05-Jan-15 Buy 575 512
3 07-Jan-15 Buy 600 575
4 16-Jan-15 Buy 660 575
5 09-Apr-15 Buy 650 506
6 24-Jun-15 Hold 650 606
7 17-Jul-15 Hold 600 534
8 19-Jan-16 Hold 520 432
9 22-Apr-16 Buy 570 482
10 14-Oct-16 Buy 625 539
Anand Rathi Ratings Definitions
Analysts’ ratings and the corresponding expected returns take into account our definitions of Large Caps (>US$1bn) and Mid/Small Caps (<US$1bn) as described
in the Ratings Table below:
Ratings Guide (12 months)
Buy Hold Sell
Large Caps (>US$1bn) >15% 5-15% <5%
Mid/Small Caps (<US$1bn) >25% 5-25% <5%
Research Disclaimer and Disclosure inter-alia as required under Securities and Exchange Board of India (Research Analysts) Regulations, 2014
Anand Rathi Share and Stock Brokers Ltd. (hereinafter refer as ARSSBL) (Research Entity) is a subsidiary of Anand Rathi Financial Services Ltd. ARSSBL is a
corporate trading and clearing member of Bombay Stock Exchange Ltd, National Stock Exchange of India Ltd. (NSEIL), Multi Stock Exchange of India Ltd (MCX-
SX), United Stock Exchange and also depository participant with National Securities Depository Ltd (NSDL) and Central Depository Services Ltd. ARSSBL is
engaged in the business of Stock Broking, Depository Participant and Mutual Fund distributor.
The research analysts, strategists, or research associates principally responsible for the preparation of Anand Rathi research have received compensation based
upon various factors, including quality of research, investor client feedback, stock picking, competitive factors and firm revenues.
General Disclaimer: This Research Report (hereinafter called “Report”) is meant solely for use by the recipient and is not for circulation. This Report does not
constitute a personal recommendation or take into account the particular investment objectives, financial situations, or needs of individual clients. The
recommendations, if any, made herein are expression of views and/or opinions and should not be deemed or construed to be neither advice for the purpose of
purchase or sale of any security, derivatives or any other security through ARSSBL nor any solicitation or offering of any investment /trading opportunity on behalf
of the issuer(s) of the respective security (ies) referred to herein. These information / opinions / views are not meant to serve as a professional investment guide for
the readers. No action is solicited based upon the information provided herein. Recipients of this Report should rely on information/data arising out of their own
investigations. Readers are advised to seek independent professional advice and arrive at an informed trading/investment decision before executing any trades or
making any investments. This Report has been prepared on the basis of publicly available information, internally developed data and other sources believed by
ARSSBL to be reliable. ARSSBL or its directors, employees, affiliates or representatives do not assume any responsibility for, or warrant the accuracy,
completeness, adequacy and reliability of such information / opinions / views. While due care has been taken to ensure that the disclosures and opinions given are
fair and reasonable, none of the directors, employees, affiliates or representatives of ARSSBL shall be liable for any direct, indirect, special, incidental,
consequential, punitive or exemplary damages, including lost profits arising in any way whatsoever from the information / opinions / views contained in this Report.
The price and value of the investments referred to in this Report and the income from them may go down as well as up, and investors may realize losses on any
investments. Past performance is not a guide for future performance. ARSSBL does not provide tax advice to its clients, and all investors are strongly advised to
consult with their tax advisers regarding taxation aspects of any potential investment.
Opinions expressed are our current opinions as of the date appearing on this Research only. We do not undertake to advise you as to any change of our views
expressed in this Report. Research Report may differ between ARSSBL’s RAs and/ or ARSSBL’s associate companies on account of differences in research
methodology, personal judgment and difference in time horizons for which recommendations are made. User should keep this risk in mind and not hold ARSSBL,
its employees and associates responsible for any losses, damages of any type whatsoever.
Cyient
1
23
4
5
6
7
8
9
10
250
300
350
400
450
500
550
600
650
Jan-14
Mar-14
May-14
Jul-14
Sep-14
Nov-14
Jan-15
Mar-15
May-15
Jul-15
Sep-15
Nov-15
Jan-16
Mar-16
May-16
Jul-16
Sep-16
Nov-16
Jan-17
Mar-17
May-17
Jul-17