Voltas Visit Update: Muted near-term outlook - Prabhudas Lilladher
•
1 like•224 views

We met the management of Voltas. The key takeaways from the meet are 1) Management expects ordering in the MEP segment to pick up in FY16 2) Legacy orders in the MEP segment might continue till Q3/Q4FY15 3) EMP segment may see a meaningful dip in revenues in FY15

Recommended
Recommended
More Related Content
What's hot
What's hot (20)
Similar to Voltas Visit Update: Muted near-term outlook - Prabhudas Lilladher
Similar to Voltas Visit Update: Muted near-term outlook - Prabhudas Lilladher (20)
More from IndiaNotes.com
More from IndiaNotes.com (20)
Recently uploaded
Recently uploaded (20)
Voltas Visit Update: Muted near-term outlook - Prabhudas Lilladher
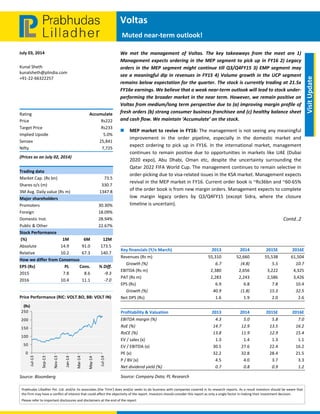
- 1. Voltas Muted near‐term outlook! July 03, 2014 Prabhudas Lilladher Pvt. Ltd. and/or its associates (the 'Firm') does and/or seeks to do business with companies covered in its research reports. As a result investors should be aware that the Firm may have a conflict of interest that could affect the objectivity of the report. Investors should consider this report as only a single factor in making their investment decision. Please refer to important disclosures and disclaimers at the end of the report Visit Update Kunal Sheth kunalsheth@plindia.com +91‐22‐66322257 Rating Accumulate Price Rs222 Target Price Rs233 Implied Upside 5.0% Sensex 25,841 Nifty 7,725 (Prices as on July 02, 2014) Trading data Market Cap. (Rs bn) 73.5 Shares o/s (m) 330.7 3M Avg. Daily value (Rs m) 1347.8 Major shareholders Promoters 30.30% Foreign 18.09% Domestic Inst. 28.94% Public & Other 22.67% Stock Performance (%) 1M 6M 12M Absolute 14.9 91.0 173.5 Relative 10.2 67.3 140.7 How we differ from Consensus EPS (Rs) PL Cons. % Diff. 2015 7.8 8.6 ‐9.3 2016 10.4 11.1 ‐7.0 Price Performance (RIC: VOLT.BO, BB: VOLT IN) Source: Bloomberg 0 50 100 150 200 250 Jul‐13 Sep‐13 Nov‐13 Jan‐14 Mar‐14 May‐14 Jul‐14 (Rs) We met the management of Voltas. The key takeaways from the meet are 1) Management expects ordering in the MEP segment to pick up in FY16 2) Legacy orders in the MEP segment might continue till Q3/Q4FY15 3) EMP segment may see a meaningful dip in revenues in FY15 4) Volume growth in the UCP segment remains below expectation for the quarter. The stock is currently trading at 21.5x FY16e earnings. We believe that a weak near‐term outlook will lead to stock under‐ performing the broader market in the near term. However, we remain positive on Voltas from medium/long term perspective due to (a) improving margin profile of fresh orders (b) strong consumer business franchisee and (c) healthy balance sheet and cash flow. We maintain ‘Accumulate’ on the stock. MEP market to revive in FY16: The management is not seeing any meaningful improvement in the order pipeline, especially in the domestic market and expect ordering to pick up in FY16. In the international market, management continues to remain positive due to opportunities in markets like UAE (Dubai 2020 expo), Abu Dhabi, Oman etc, despite the uncertainty surrounding the Qatar 2022 FIFA World Cup. The management continues to remain selective in order‐picking due to visa‐related issues in the KSA market. Management expects revival in the MEP market in FY16. Current order book is ~Rs36bn and ~60‐65% of the order book is from new margin orders. Management expects to complete low margin legacy orders by Q3/Q4FY15 (except Sidra, where the closure timeline is uncertain). Contd..2 Key financials (Y/e March) 2013 2014 2015E 2016E Revenues (Rs m) 55,310 52,660 55,538 61,504 Growth (%) 6.7 (4.8) 5.5 10.7 EBITDA (Rs m) 2,380 2,656 3,222 4,325 PAT (Rs m) 2,283 2,243 2,586 3,426 EPS (Rs) 6.9 6.8 7.8 10.4 Growth (%) 40.9 (1.8) 15.3 32.5 Net DPS (Rs) 1.6 1.9 2.0 2.6 Profitability & Valuation 2013 2014 2015E 2016E EBITDA margin (%) 4.3 5.0 5.8 7.0 RoE (%) 14.7 12.9 13.5 16.2 RoCE (%) 13.8 11.9 12.9 15.4 EV / sales (x) 1.3 1.4 1.3 1.1 EV / EBITDA (x) 30.5 27.6 22.4 16.2 PE (x) 32.2 32.8 28.4 21.5 P / BV (x) 4.5 4.0 3.7 3.3 Net dividend yield (%) 0.7 0.8 0.9 1.2 Source: Company Data; PL Research
- 2. July 03, 2014 2 Voltas Volume growth in UCP segment likely to be muted, EMP segment to see meaningful de‐growth in FY15: AC segment’s volume growth for April and May was lower than expectation due to erratic climatic conditions. Though June has been better than April/May, overall volumes are still below company expectations. Voltas reported a margin of 12.9% in the UCP segment due to few one‐offs and a better product mix (in favour of Split ACs). The company expects to report margins in the range of 10‐11% for FY15 in the UCP segment, while in the EMP segment, the company expects revenues to de‐grow meaningfully due to discontinuation of few principals (Bucyrus, LeTourneau). Outlook and Valuation: Voltas is currently trading at 21.5x FY16e earnings. We have downgraded our earnings by ~10% for FY15 to factor in lower revenues in the EMP segment and slower‐than‐expected ramp‐up in MEP margins. We believe weak near‐term outlook will lead to stock under‐performing the broader market in the near term. We remain positive on Voltas from medium/long term perspective due to (a) improving margin profile of fresh orders (b) strong consumer business franchisee (c) healthy balance sheet and cash flow. We maintain ‘Accumulate’ on the stock. Exhibit 1: One year forward Price/Earnings 38.1 18.5 16.4 3.5 26.0 0.0 5.0 10.0 15.0 20.0 25.0 30.0 35.0 40.0 45.0 Mar‐05 Sep‐05 Feb‐06 Jul‐06 Dec‐06 Jun‐07 Nov‐07 Apr‐08 Oct‐08 Mar‐09 Aug‐09 Jan‐10 Jul‐10 Dec‐10 May‐11 Oct‐11 Apr‐12 Sep‐12 Feb‐13 Jul‐13 Jan‐14 Jun‐14 P/E (x) Peak(x) Avg(x) Median(x) Min(x) Source: Company Data, Bloomberg, PL Research
- 3. July 03, 2014 3 Voltas Income Statement (Rs m) Y/e March 2013 2014 2015E 2016E Net Revenue 55,310 52,660 55,538 61,504 Raw Material Expenses 41,670 38,543 39,987 44,283 Gross Profit 13,639 14,118 15,551 17,221 Employee Cost 6,325 5,947 7,387 8,180 Other Expenses 4,934 5,515 4,942 4,716 EBITDA 2,380 2,656 3,222 4,325 Depr. & Amortization 278 248 418 442 Net Interest 326 226 361 361 Other Income 974 1,002 1,149 1,236 Profit before Tax 2,751 3,184 3,592 4,758 Total Tax 728 941 1,006 1,332 Profit after Tax 2,023 2,243 2,586 3,426 Ex‐Od items / Min. Int. — — — — Adj. PAT 2,283 2,243 2,586 3,426 Avg. Shares O/S (m) 330.7 330.7 330.7 330.7 EPS (Rs.) 6.9 6.8 7.8 10.4 Cash Flow Abstract (Rs m) Y/e March 2013 2014 2015E 2016E C/F from Operations 2,534 3,230 2,760 3,763 C/F from Investing (841) (3,547) (300) (300) C/F from Financing (570) (928) (1,171) (1,363) Inc. / Dec. in Cash 1,122 (1,245) 1,290 2,100 Opening Cash 2,710 3,832 2,588 3,877 Closing Cash 3,832 2,588 3,877 5,978 FCFF 2,111 2,705 2,100 3,102 FCFE 2,472 2,721 2,046 3,102 Key Financial Metrics Y/e March 2013 2014 2015E 2016E Growth Revenue (%) 6.7 (4.8) 5.5 10.7 EBITDA (%) (29.3) 11.6 21.3 34.2 PAT (%) 40.9 (1.8) 15.3 32.5 EPS (%) 40.9 (1.8) 15.3 32.5 Profitability EBITDA Margin (%) 4.3 5.0 5.8 7.0 PAT Margin (%) 4.1 4.3 4.7 5.6 RoCE (%) 13.8 11.9 12.9 15.4 RoE (%) 14.7 12.9 13.5 16.2 Balance Sheet Net Debt : Equity (0.1) — (0.1) (0.2) Net Wrkng Cap. (days) 26 24 (6) (6) Valuation PER (x) 32.2 32.8 28.4 21.5 P / B (x) 4.5 4.0 3.7 3.3 EV / EBITDA (x) 30.5 27.6 22.4 16.2 EV / Sales (x) 1.3 1.4 1.3 1.1 Earnings Quality Eff. Tax Rate 24.2 29.6 28.0 28.0 Other Inc / PBT 33.7 31.5 32.0 26.0 Eff. Depr. Rate (%) 6.0 5.0 8.0 8.0 FCFE / PAT 108.3 121.3 79.1 90.6 Source: Company Data, PL Research. Balance Sheet Abstract (Rs m) Y/e March 2013 2014 2015E 2016E Shareholder's Funds 16,325 18,317 19,930 22,338 Total Debt 2,612 2,629 2,575 2,575 Other Liabilities 118 138 152 167 Total Liabilities 19,056 21,084 22,657 25,081 Net Fixed Assets 2,156 2,208 2,089 1,947 Goodwill 888 799 826 826 Investments 4,074 7,320 7,320 7,320 Net Current Assets 11,693 10,499 12,163 14,729 Cash & Equivalents 3,498 2,818 3,877 5,978 Other Current Assets 34,852 34,157 32,172 35,483 Current Liabilities 26,657 26,476 23,887 26,732 Other Assets 245 259 259 259 Total Assets 19,055 21,084 22,657 25,081 Quarterly Financials (Rs m) Y/e March Q2FY14 Q3FY14 Q4FY14 Q1FY15E Net Revenue 10,805 11,194 14,628 15,366 EBITDA 432 675 1,054 1,076 % of revenue 4.0 6.0 7.2 7.0 Depr. & Amortization 60 60 69 70 Net Interest 55 46 65 85 Other Income 303 170 308 250 Profit before Tax 620 740 1,228 1,171 Total Tax 196 164 392 375 Profit after Tax 424 577 1,010 796 Adj. PAT 424 577 836 796 Source: Company Data, PL Research.
- 4. July 03, 2014 4 Voltas Prabhudas Lilladher Pvt. Ltd. 3rd Floor, Sadhana House, 570, P. B. Marg, Worli, Mumbai‐400 018, India Tel: (91 22) 6632 2222 Fax: (91 22) 6632 2209 Rating Distribution of Research Coverage 28.4% 53.2% 18.3% 0.0% 0% 10% 20% 30% 40% 50% 60% BUY Accumulate Reduce Sell % of Total Coverage PL’s Recommendation Nomenclature BUY : Over 15% Outperformance to Sensex over 12‐months Accumulate : Outperformance to Sensex over 12‐months Reduce : Underperformance to Sensex over 12‐months Sell : Over 15% underperformance to Sensex over 12‐months Trading Buy : Over 10% absolute upside in 1‐month Trading Sell : Over 10% absolute decline in 1‐month Not Rated (NR) : No specific call on the stock Under Review (UR) : Rating likely to change shortly This document has been prepared by the Research Division of Prabhudas Lilladher Pvt. Ltd. Mumbai, India (PL) and is meant for use by the recipient only as information and is not for circulation. This document is not to be reported or copied or made available to others without prior permission of PL. It should not be considered or taken as an offer to sell or a solicitation to buy or sell any security. The information contained in this report has been obtained from sources that are considered to be reliable. However, PL has not independently verified the accuracy or completeness of the same. Neither PL nor any of its affiliates, its directors or its employees accept any responsibility of whatsoever nature for the information, statements and opinion given, made available or expressed herein or for any omission therein. Recipients of this report should be aware that past performance is not necessarily a guide to future performance and value of investments can go down as well. The suitability or otherwise of any investments will depend upon the recipient's particular circumstances and, in case of doubt, advice should be sought from an independent expert/advisor. Either PL or its affiliates or its directors or its employees or its representatives or its clients or their relatives may have position(s), make market, act as principal or engage in transactions of securities of companies referred to in this report and they may have used the research material prior to publication. We may from time to time solicit or perform investment banking or other services for any company mentioned in this document.