Vidhi Dyestuffs: To keep its growth story in the coming quarters also
•
0 likes•643 views

Vidhi Dyestuffs: To keep its growth story in the coming quarters also; Buy #BrokerAdvice http://goo.gl/xe2tZp

Recommended
Recommended
More Related Content
What's hot
What's hot (19)
Similar to Vidhi Dyestuffs: To keep its growth story in the coming quarters also
Similar to Vidhi Dyestuffs: To keep its growth story in the coming quarters also (20)
More from IndiaNotes.com
More from IndiaNotes.com (19)
Recently uploaded
Recently uploaded (20)
Vidhi Dyestuffs: To keep its growth story in the coming quarters also
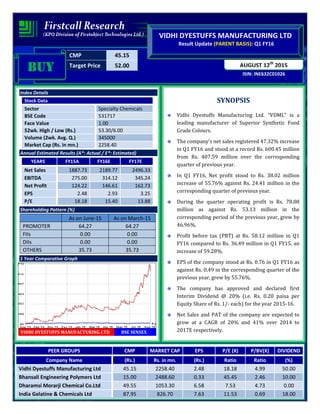
- 1. CMP 45.15 Target Price 52.00 ISIN: INE632C01026 AUGUST 12th 2015 VIDHI DYESTUFFS MANUFACTURING LTD Result Update (PARENT BASIS): Q1 FY16 BUYBUYBUYBUY Index Details Stock Data Sector Specialty Chemicals BSE Code 531717 Face Value 1.00 52wk. High / Low (Rs.) 53.30/6.00 Volume (2wk. Avg. Q.) 345000 Market Cap (Rs. in mn.) 2258.40 Annual Estimated Results (A*: Actual / E*: Estimated) YEARS FY15A FY16E FY17E Net Sales 1887.73 2189.77 2496.33 EBITDA 275.00 314.12 345.24 Net Profit 124.22 146.61 162.73 EPS 2.48 2.93 3.25 P/E 18.18 15.40 13.88 Shareholding Pattern (%) As on June-15 As on March-15 PROMOTER 64.27 64.27 FIIs 0.00 0.00 DIIs 0.00 0.00 OTHERS 35.73 35.73 1 Year Comparative Graph VIDHI DYESTUFFS MANUFACTURING LTD BSE SENSEX SYNOPSIS Vidhi Dyestuffs Manufacturing Ltd. “VDML” is a leading manufacturer of Superior Synthetic Food Grade Colours. The company’s net sales registered 47.32% increase in Q1 FY16 and stood at a record Rs. 600.45 million from Rs. 407.59 million over the corresponding quarter of previous year. In Q1 FY16, Net profit stood to Rs. 38.02 million increase of 55.76% against Rs. 24.41 million in the corresponding quarter of previous year. During the quarter operating profit is Rs. 78.08 million as against Rs. 53.13 million in the corresponding period of the previous year, grew by 46.96%. Profit before tax (PBT) at Rs. 58.12 million in Q1 FY16 compared to Rs. 36.49 million in Q1 FY15, an increase of 59.28%. EPS of the company stood at Rs. 0.76 in Q1 FY16 as against Rs. 0.49 in the corresponding quarter of the previous year, grew by 55.76%. The company has approved and declared first Interim Dividend @ 20% (i.e. Rs. 0.20 paisa per Equity Share of Rs. 1/- each) for the year 2015-16. Net Sales and PAT of the company are expected to grow at a CAGR of 20% and 41% over 2014 to 2017E respectively. PEER GROUPS CMP MARKET CAP EPS P/E (X) P/BV(X) DIVIDEND Company Name (Rs.) Rs. in mn. (Rs.) Ratio Ratio (%) Vidhi Dyestuffs Manufacturing Ltd 45.15 2258.40 2.48 18.18 4.99 50.00 Bhansali Engineering Polymers Ltd 15.00 2488.60 0.33 45.45 2.46 10.00 Dharamsi Morarji Chemical Co.Ltd 49.55 1053.30 6.58 7.53 4.73 0.00 India Gelatine & Chemicals Ltd 87.95 826.70 7.63 11.53 0.69 18.00
- 2. QUARTERLY HIGHLIGHTS (PARENT BASIS) Results updates- Q1 FY16, The company has achieved a turnover of Rs. 600.45 million for the 1st quarter of the financial year 2015-16 as against Rs. 407.59 million in the corresponding quarter of the previous year. EBITDA of Rs. 78.08 million in Q1 FY16, an increase of 46.96% against the corresponding period of last year. In Q1 FY16, net profit of Rs. 38.02 million against Rs. 24.41 million in the corresponding quarter of the previous year. The company has reported an EPS of Rs. 0.76 for the 1st quarter as against an EPS of Rs. 0.49 in the corresponding quarter of the previous year. Break up of Expenditure Rs. In million June-15 June-14 % Change Net Sales 600.45 407.59 47.32 PAT 38.02 24.41 55.76 EPS 0.76 0.49 55.76 EBITDA 78.08 53.13 46.96 Break up of Expenditure (Rs in millions) Q1 FY16 Q1 FY15 % Chng Cost of materials consumed 159.56 146.16 9% Purchase of traded goods 275.02 117.60 134% Employees Benefit Expense 7.23 6.82 6% Depreciation 4.64 3.48 33% Other Expenses 72.61 63.73 14%
- 3. COMPANY PROFILE Vidhi Dyestuffs Manufacturing Ltd. “VDML” is a leading manufacturer of Superior Synthetic Food Grade Colours. “VDML” provides customers superior colour solutions in applications for various industries such as Food & Beverage, Confectionary, Pharmaceuticals, Feeds, Cosmetics, Confectionary, Dairy etc. the company’s colours are being distributed and consumed in over 80 countries across 6 continents to some of the largest Consumer / Healthcare / Food & Feed companies in the world. “VDML” is an ISO 9001:2008, ISO 22000:2005 and HACCP certified company. The Manufacturing facilities have been audited and found satisfactory by the U.S. FDA. “VDML” via its vast network of actual users, distributors & re‐sellers made a very strong progress in establishing its presence in over 80 countries worldwide and is presently one of the top 4 globally recognized players in the synthetic food colour market. VDML’s Vision for 2020: 1. To be a global player of repute on the lines of Sensient, US. 2. To focus on 3Cs – Capacities, Capabilities and Customers. To be 20% of global capacities. 3. To broad base categories and deepen presence in Colors. 4. To increase margins by moving into value add segments; target EBITDA margins of 20%. 5. To be cognizant of all stakeholders and be counted as amongst the most transparent, shareholder friendly company.
- 4. FINANCIAL HIGHLIGHT (PARENT BASIS) (A*- Actual, E* -Estimations & Rs. In Millions) Balance Sheet as at March 31, 2014 -2017E FY14A FY15A FY16E FY17E I. EQUITY AND LIABILITIES: A. Shareholders’ Funds a) Share Capital 50.02 50.02 50.02 50.02 b) Reserves and Surplus 309.17 402.18 502.73 603.27 Sub-Total-Net worth 359.19 452.20 552.75 653.29 B. Non-Current Liabilities: a) Long-term borrowings 21.93 19.82 17.96 16.52 b) Deferred Tax Liabilities [Net] 11.76 12.06 12.54 12.92 Sub-Total-Long term liabilities 33.69 31.88 30.50 29.44 C. Current Liabilities: a) Short-term borrowings 402.44 441.63 476.96 505.58 b) Trade Payables 170.75 286.20 343.44 398.39 c) Other Current Liabilities 29.53 53.57 65.36 76.47 d) Short Term Provisions 7.12 43.32 53.72 63.39 Sub-Total-Current Liabilities 609.84 824.72 939.47 1043.82 TOTAL-EQUITY AND LIABILITIES (A+B+C) 1002.72 1308.80 1522.72 1726.55 II. ASSETS: D. Non-Current Assets: Fixed Assets i. Tangible Assets 179.43 170.04 173.44 176.91 ii. Capital work-in-progress 0.00 87.03 95.73 103.39 a) Sub-Total-Fixed Assets 179.43 257.07 269.17 280.30 b) Non Current Investments 1.26 1.26 1.31 1.38 c) Long Term Loans and Advances 9.34 11.68 13.78 15.44 Sub-Total-Non-Current Assets 190.03 270.01 284.27 297.11 E. Current Assets: a) Inventories 263.80 384.01 499.21 609.04 b) Trade Receivables 435.48 470.07 507.68 543.21 c) Cash and Bank Balances 34.22 68.09 85.11 102.14 d) Short Term Loans and Advances 66.99 104.02 133.09 161.04 e) Other Current Assets 12.20 12.60 13.36 14.00 Sub-Total-Current Assets 812.69 1038.79 1238.45 1429.44 TOTAL-ASSETS (D+E) 1002.72 1308.80 1522.72 1726.55
- 5. Annual Profit & Loss Statement for the period of 2014 to 2017E Value(Rs.in.mn) FY14A FY15A FY16E FY17E Description 12m 12m 12m 12m Net Sales 1427.65 1887.73 2189.77 2496.33 Other Income 3.81 8.01 18.50 20.72 Total Income 1431.46 1895.74 2208.27 2517.05 Expenditure -1267.09 -1620.74 -1894.15 -2171.81 Operating Profit 164.37 275.00 314.12 345.24 Interest -53.37 -61.08 -67.80 -73.90 Gross profit 111.00 213.92 246.32 271.34 Depreciation -19.75 -16.30 -17.60 -18.66 Exceptional Items 0.00 -4.89 0.00 0.00 Profit Before Tax 91.25 192.73 228.72 252.68 Tax -31.50 -68.51 -82.11 -89.95 Net Profit 59.75 124.22 146.61 162.73 Equity capital 50.02 50.02 50.02 50.02 Reserves 309.17 402.18 502.73 603.27 Face value 1.00 1.00 1.00 1.00 EPS 1.19 2.48 2.93 3.25 Quarterly Profit & Loss Statement for the period of 31st Dec, 2014 to 30th Sep, 2015E Value(Rs.in.mn) 31-Dec-14 31-Mar-15 30-Jun-15 30-Sep-15E Description 3m 3m 3m 3m Net sales 487.71 502.04 600.45 672.50 Other income 0.59 1.43 7.14 5.36 Total Income 488.30 503.47 607.59 677.86 Expenditure -412.31 -417.40 -529.51 -592.48 Operating profit 75.99 86.07 78.08 85.38 Interest -14.48 -18.03 -15.32 -17.16 Gross profit 61.51 68.04 62.76 68.22 Depreciation -4.81 -4.43 -4.64 -4.83 Exceptional Items -4.14 0.00 0.00 0.00 Profit Before Tax 52.56 63.61 58.12 63.40 Tax -17.02 -26.39 -20.10 -22.24 Net Profit 35.54 37.22 38.02 41.16 Equity capital 50.02 50.02 50.02 50.02 Face value 1.00 1.00 1.00 1.00 EPS 0.71 0.74 0.76 0.82
- 6. Ratio Analysis Particulars FY14A FY15A FY16E FY17E EPS (Rs.) 1.19 2.48 2.93 3.25 EBITDA Margin (%) 11.51 14.57 14.34 13.83 PBT Margin (%) 6.39 10.21 10.44 10.12 PAT Margin (%) 4.19 6.58 6.70 6.52 P/E Ratio (x) 37.80 18.18 15.40 13.88 ROE (%) 16.63 27.47 26.52 24.91 ROCE (%) 23.50 31.88 31.66 30.96 Debt Equity Ratio 1.18 1.02 0.90 0.80 EV/EBITDA (x) 16.11 9.64 8.49 7.76 Book Value (Rs.) 7.18 9.04 11.05 13.06 P/BV 6.29 4.99 4.09 3.46 Charts
- 7. OUTLOOK AND CONCLUSION At the current market price of Rs. 45.15, the stock P/E ratio is at 15.40 x FY16E and 13.88 x FY17E respectively. Earning per share (EPS) of the company for the earnings for FY16E and FY17E is seen at Rs.2.93 and Rs.3.25 respectively. Net Sales and PAT of the company are expected to grow at a CAGR of 20% and 41% over 2014 to 2017E respectively. On the basis of EV/EBITDA, the stock trades at 8.49 x for FY16E and 7.76 x for FY17E. Price to Book Value of the stock is expected to be at 4.09 x and 3.46 x for FY16E and FY17E respectively. We expect that the company surplus scenario is likely to continue for the next three years, will keep its growth story in the coming quarters also. We recommend ‘BUY’ in this particular scrip with a target price of Rs.52.00 for Medium to Long term investment.
- 8. INDUSTRY OVERVIEW The Indian chemical industry stands as the third largest producer in Asia and 12th in world, in terms of volume. This industry could grow at 14 per cent per annum to reach a size of US$ 350 billion by 2021. India accounts for approximately 7 per cent of the world production of dyestuff and dye intermediates and is currently the world's third largest consumer of polymers and fourth largest producer of agrochemicals. The market size of the chemical industry is expected to grow to US$ 350 billion by 2021. With 71 per cent of the total production share, alkali chemicals form the largest segment in the Indian chemical industry. During FY14, the production of alkali chemicals stood at 6,265 million tonnes (MT). Total exports of chemicals grew from US$ 3.5 billion in FY03 to US$19.2 billion in FY14, a compound annual growth rate (CAGR) of 16.9 per cent. The Government of India has approved 100 per cent foreign direct investment (FDI) in the chemicals sector and reduced excise duty from 14 per cent to 10 per cent. Policies have been initiated to set up integrated Petroleum, Chemicals and Petrochemicals Investment Regions (PCPIR). PCPIR will be an investment region spread across 250 square kilometres for manufacturing of domestic and export-related products of petroleum, chemicals and petrochemicals. Disclaimer: This document is prepared by our research analysts and it does not constitute an offer or solicitation for the purchase or sale of any financial instrument or as an official confirmation of any transaction. The information contained herein is from publicly available data or other sources believed to be reliable but we do not represent that it is accurate or complete and it should not be relied on as such. Firstcall Research or any of its affiliates shall not be in any way responsible for any loss or damage that may arise to any person from any inadvertent error in the information contained in this report. Firstcall Research and/ or its affiliates and/or employees will not be liable for the recipients’ investment decision based on this document.
- 9. Firstcall India Equity Research: Email – info@firstobjectindia.com C.V.S.L.Kameswari Pharma & Diversified U. Janaki Rao Capital Goods B. Anil Kumar Auto, IT & FMCG M. Vinayak Rao Diversified G. Amarender Diversified Firstcall Research Provides Industry Research on all the Sectors and Equity Research on Major Companies forming part of Listed and Unlisted Segments For Further Details Contact: Tel.: 022-2527 2510/2527 6077 / 25276089 Telefax: 022-25276089 040-20000235 /20000233 E-mail: info@firstobjectindia.com www.firstcallresearch.com