PI Industries: Custom synthesis exports deliver growth of ~26% in Q1FY16; Buy
•
1 like•357 views

PI Industries clocks 26% upsurge in custom synthesis exports in Q1FY16; Buy #BrokerAdvice http://goo.gl/6hGXlL

Recommended
Recommended
More Related Content
What's hot
What's hot (20)
Similar to PI Industries: Custom synthesis exports deliver growth of ~26% in Q1FY16; Buy
Similar to PI Industries: Custom synthesis exports deliver growth of ~26% in Q1FY16; Buy (20)
More from IndiaNotes.com
More from IndiaNotes.com (20)
Recently uploaded
Recently uploaded (20)
PI Industries: Custom synthesis exports deliver growth of ~26% in Q1FY16; Buy
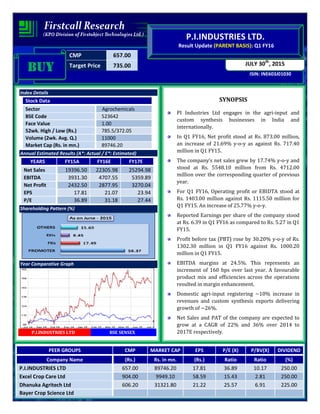
- 1. CMP 657.00 Target Price 735.00 ISIN: INE603J01030 JULY 30th , 2015 P.I.INDUSTRIES LTD. Result Update (PARENT BASIS): Q1 FY16 BUYBUYBUYBUY Index Details Stock Data Sector Agrochemicals BSE Code 523642 Face Value 1.00 52wk. High / Low (Rs.) 785.5/372.05 Volume (2wk. Avg. Q.) 11000 Market Cap (Rs. in mn.) 89746.20 Annual Estimated Results (A*: Actual / E*: Estimated) YEARS FY15A FY16E FY17E Net Sales 19396.50 22305.98 25294.98 EBITDA 3931.30 4707.55 5359.89 Net Profit 2432.50 2877.95 3270.04 EPS 17.81 21.07 23.94 P/E 36.89 31.18 27.44 Shareholding Pattern (%) Year Comparative Graph P.I.INDUSTRIES LTD BSE SENSEX SYNOPSIS PI Industries Ltd engages in the agri-input and custom synthesis businesses in India and internationally. In Q1 FY16, Net profit stood at Rs. 873.00 million, an increase of 21.69% y-o-y as against Rs. 717.40 million in Q1 FY15. The company’s net sales grew by 17.74% y-o-y and stood at Rs. 5548.10 million from Rs. 4712.00 million over the corresponding quarter of previous year. For Q1 FY16, Operating profit or EBIDTA stood at Rs. 1403.00 million against Rs. 1115.50 million for Q1 FY15. An increase of 25.77% y-o-y. Reported Earnings per share of the company stood at Rs. 6.39 in Q1 FY16 as compared to Rs. 5.27 in Q1 FY15. Profit before tax (PBT) rose by 30.20% y-o-y of Rs. 1302.30 million in Q1 FY16 against Rs. 1000.20 million in Q1 FY15. EBITDA margins at 24.5%. This represents an increment of 160 bps over last year. A favourable product mix and efficiencies across the operations resulted in margin enhancement. Domestic agri-input registering ~10% increase in revenues and custom synthesis exports delivering growth of ~26%. Net Sales and PAT of the company are expected to grow at a CAGR of 22% and 36% over 2014 to 2017E respectively. PEER GROUPS CMP MARKET CAP EPS P/E (X) P/BV(X) DIVIDEND Company Name (Rs.) Rs. in mn. (Rs.) Ratio Ratio (%) P.I.INDUSTRIES LTD 657.00 89746.20 17.81 36.89 10.17 250.00 Excel Crop Care Ltd 904.00 9949.10 58.59 15.43 2.81 250.00 Dhanuka Agritech Ltd 606.20 31321.80 21.22 25.57 6.91 225.00 Bayer Crop Science Ltd 3956.00 144864.80 104.15 37.98 6.82 210.00
- 2. QUARTERLY HIGHLIGHTS (PARENT BASIS) Results updates- Q1 FY16, PI Industries Ltd engages in the agri-input and custom synthesis businesses in India and internationally, reported its financial results for the quarter ended 30th June, 2015. The company has achieved a turnover of Rs. 5548.10 million as against Rs. 4712.00 million in the corresponding quarter of the previous year. Growth during Q1 FY16 stood at 17.74% in Net Sales, with domestic agri-input registering ~10% increase in revenues and custom synthesis exports delivering growth of ~26%. EBITDA was at Rs. 1403.00 million in Q1 FY16 as against Rs. 1115.50 million in the corresponding period of last year. In Q1 FY16, net profit increased by 21.69% to Rs. 873.00 million against Rs. 717.40 million in the corresponding quarter of the previous year. The company has reported an EPS of Rs. 6.39 as against an EPS of Rs. 5.27 in the corresponding quarter of the previous year. Break up of Expenditure Break up of Expenditure (Rs in millions) Q1 FY16 Q1 FY15 Chg % Cost of Material Consumed 2963.40 2510.00 18% Purchase of Stock in Trade 70.00 208.00 -66% Employee Benefit Expenses 401.80 317.00 27% Depreciation & Amortization Expense 114.50 97.70 17% Other Expenses 658.20 634.60 4% Months June-15 June-14 % Change Net Sales 5548.10 4712.00 17.74 PAT 873.00 717.40 21.69 EPS 6.39 5.27 21.25 EBITDA 1403.00 1115.50 25.77
- 3. Result Updates; • Growth during Q1 FY16 stood at 18% in Net Sales, with domestic agri-input registering ~10% increase in revenues and custom synthesis exports delivering growth of ~26%. • EBITDA margins at 24.5%. This represents an increment of 160 bps over last year. A favourable product mix and efficiencies across the operations resulted in margin enhancement. • Sustained positive cash flows continue to strengthen the Balance Sheet. Working capital cycle improved compared to March, 15 position. The Debt-Equity ratio stood at 0.04. COMPANY PROFILE Incorporated in 1947, PI Industries focuses on Agri-Input and Custom Synthesis with strength of over 1,500 employees, PI Industries currently operates three formulation and two manufacturing facilities as well as five multi-product plants under its three manufacturing locations across Jammu and Gujarat. These state-of-art facilities have integrated process development teams with in-house engineering capabilities. PI Industries is into the following segments: Domestic Agri-Input PI is one of India’s leading players in the Agri-Input industry, primarily dealing in agro-chemicals, specialty fertilizers, plant nutrients and seeds. This venture is the flagship business for which PI enjoys tremendous brand recognition across several industry leading products. The Company has exclusive rights with several global Corporations for distribution in India and is constantly evaluating prospects to further expand its product portfolio. Given the inevitable surge in demand for food grain production in the agriculture sector, the opportunities for Agro-Chem Companies are innumerable. PI Industries is favorably positioned to contribute to the growth in this space by leveraging its long-standing association with business partners and intensive network of distributors across India. Custom Synthesis Exports PI focuses on Custom Synthesis, which entails dealing in custom synthesis and contract manufacturing of chemicals including techno commercial evaluation of chemical processes, process development, lab & pilot scale up as well as commercial production. The Company has an impressive product portfolio as result of exclusive tie- ups with leading agro-chemical, pharmaceutical and fine chemical companies around the world. PI has made substantial investments in building state of art process research and manufacturing facilities of chemical intermediates and active ingredients with special focus on strong process R&D capabilities. Custom Synthesis is expected to be the primary growth driver with strong revenue visibility for P I as India continues to be a preferred destination for outsourcing Custom Synthesis and contract manufacturing related projects. With exceptional growth opportunities in the offing, this segment is poised for great success.
- 4. FINANCIAL HIGHLIGHT (PARENT BASIS) (A*- Actual, E* -Estimations & Rs. In Millions) Balance Sheet as at March 31, 2014 -2017E FY14A FY15A FY16E FY17E I. EQUITY AND LIABILITIES: A. Shareholders’ Funds a) Share Capital 136.11 136.60 136.60 136.60 b) Reserves and Surplus 6694.73 8688.70 11034.65 13793.31 Sub-Total-Net worth 6830.84 8825.30 11171.25 13929.91 B. Non-Current Liabilities: a) Long-term borrowings 501.26 166.70 57.68 25.38 b) Deferred Tax Liabilities [Net] 432.53 365.50 325.30 344.81 c) Other Long Term Liabilities 137.76 158.30 178.88 196.77 d) Long Term Provisions 59.93 79.40 96.07 111.45 Sub-Total-Long term liabilities 1131.48 769.90 657.93 678.40 C. Current Liabilities: a) Short-term borrowings 358.84 647.90 728.89 801.78 b) Trade Payables 2931.27 3539.90 4141.68 4700.81 c) Other Current Liabilities 1557.19 2072.70 2601.24 3043.45 d) Short Term Provisions 281.28 356.70 436.96 485.90 Sub-Total-Current Liabilities 5128.58 6617.20 7908.77 9031.93 TOTAL-EQUITY AND LIABILITIES (A+B+C) 13090.90 16212.40 19737.94 23640.25 II. ASSETS: D. Non-Current Assets: a) Fixed Assets 5661.28 6629.30 7623.70 8584.28 b) Non Current Investments 19.67 19.70 19.70 19.70 c) Long Term Loans and Advances 112.19 426.40 716.35 1110.35 d) Other non-current investments 19.15 20.80 22.36 23.48 Sub-Total-Non-Current Assets 5812.29 7096.20 8382.11 9737.81 E. Current Assets: a) Inventories 3187.58 3782.10 4380.11 4988.47 b) Trade Receivables 2564.71 3825.80 5279.60 7042.99 c) Cash and Bank Balances 371.03 239.30 307.26 379.16 d) Short Term Loans and Advances 1079.74 1201.30 1326.24 1432.33 e) Other Current Assets 75.55 67.70 62.62 59.49 Sub-Total-Current Assets 7278.61 9116.20 11355.83 13902.44 TOTAL-ASSETS (D+E) 13090.90 16212.40 19737.94 23640.25
- 5. Annual Profit & Loss Statement for the period of 2014A to 2017E Value(Rs.in.mn) FY14A FY15A FY16E FY17E Description 12m 12m 12m 12m Net Sales 15949.20 19396.50 22305.98 25294.98 Other Income 156.10 231.60 268.66 300.89 Total Income 16105.30 19628.10 22574.63 25595.87 Expenditure -13092.90 -15696.80 -17867.09 -20235.98 Operating Profit 3012.40 3931.30 4707.55 5359.89 Interest -118.20 86.30 60.41 43.50 Gross profit 2894.20 4017.60 4767.96 5403.39 Depreciation -313.70 -491.60 -560.42 -614.22 Profit Before Tax 2580.50 3526.00 4207.53 4789.16 Tax -742.70 -1093.50 -1329.58 -1519.12 Profit After Tax 1837.80 2432.50 2877.95 3270.04 Extraordinary Items -0.40 0.00 0.00 0.00 Net Profit 1837.40 2432.50 2877.95 3270.04 Equity capital 136.11 136.60 136.60 136.60 Reserves 6676.80 8688.70 11034.65 13793.31 Face value 1.00 1.00 1.00 1.00 EPS 13.50 17.81 21.07 23.94 Quarterly Profit & Loss Statement for the period of 31st Dec, 2014 to 30th Sept, 2015E Value(Rs.in.mn) 31-Dec-14 31-Mar-15 30-Jun-15 30-Sep-15E Description 3m 3m 3m 3m Net sales 5049.20 5369.80 5548.10 5148.64 Other income 59.30 81.00 45.00 63.90 Total Income 5108.50 5450.80 5593.10 5212.54 Expenditure -4108.00 -4417.10 -4190.10 -4118.91 Operating profit 1000.50 1033.70 1403.00 1093.63 Interest 10.20 22.60 13.80 11.73 Gross profit 1010.70 1056.30 1416.80 1105.36 Depreciation -96.90 -200.60 -114.50 -108.78 Profit Before Tax 913.80 855.70 1302.30 996.58 Tax -291.60 -252.50 -429.30 -311.93 Net Profit 622.20 603.20 873.00 684.65 Equity capital 136.60 136.60 136.60 136.60 Face value 1.00 1.00 1.00 1.00 EPS 4.55 4.42 6.39 5.01
- 6. Ratio Analysis Particulars FY14A FY15A FY16E FY17E EPS (Rs.) 13.50 17.81 21.07 23.94 EBITDA Margin (%) 18.89% 20.27% 21.10% 21.19% PBT Margin (%) 16.18% 18.18% 18.86% 18.93% PAT Margin (%) 11.52% 12.54% 12.90% 12.93% P/E Ratio (x) 48.67 36.89 31.18 27.44 ROE (%) 26.98% 27.56% 25.76% 23.47% ROCE (%) 43.35% 45.88% 44.05% 40.48% Debt Equity Ratio 0.13 0.09 0.07 0.06 EV/EBITDA (x) 29.85 22.97 19.17 16.83 Book Value (Rs.) 50.05 64.61 81.78 101.98 P/BV 13.13 10.17 8.03 6.44 Charts
- 7. OUTLOOK AND CONCLUSION At the current market price of Rs. 657.00 the stock P/E ratio is at 31.18 FY16E and 27.44 x FY17E respectively. Earnings per share (EPS) of the company for FY16E and FY17E are seen at Rs. 21.07 and Rs. 23.94 respectively. Net Sales and PAT of the company are expected to grow at a CAGR of 22% and 36% over 2014 to 2017E respectively. On the basis of EV/EBITDA, the stock trades at 19.17 x for FY16E and 16.83 x for FY17E. Price to Book Value of the stock is expected to be at 8.03 x and 6.44 x respectively for FY16E and FY17E. We recommend ‘BUY’ in this particular scrip with a target price of Rs. 735.00 for Medium to Long term investment.
- 8. INDUSTRY OVERVIEW India is the fourth largest producer of agrochemicals after the United States, Japan and China. “Available arable land per capita has been reducing globally and is expected to reduce further. India is no different. “The pressure is therefore to increase yield per hectare which can be achieved through increased usage of agrochemicals.” The agrochemicals industry is a significant industry for farmers of India and around the globe. Farmers spend money on seed, irrigation, fertilization, and it is pesticides that protect that entire investment. Crop protection accounts for about 2% of the total chemicals market in India. Agrochemicals are 3% of the total chemical export market. India’s pesticide market is about $3.8 billion, with exports accounting for about 50%. India comprises about more than 328 million hectares of which 46% (nearly 151 million) is cropped area. There are a lot of farmers on that land. About 67% of India’s farmers are considered marginal, farming on less than a single hectare. Another 18 percent farm between one and two hectares. Only 1% of India’s farmers work more than 10 hectares. Outlook PI Industries will continue to deliver sustained healthy performance on the back of: o Good growth in the domestic Agri Input owing to; • Higher Kharif sowing that is expected to drive better acreages given the onset of good monsoon • Healthy reservoir levels compared to year ago, that will also set the stage for the upcoming Rabi season • Periodic introductions of new products driving upsides along with products launched in the recent few years o Continued momentum in exports: • Progressive improvement in volume requirements for commercialised molecules • Trend of new commercialisations at the rate of 2-3 molecules per year • Jambusar facility scaling up with the addition of new phases
- 9. Disclaimer: This document is prepared by our research analysts and it does not constitute an offer or solicitation for the purchase or sale of any financial instrument or as an official confirmation of any transaction. The information contained herein is from publicly available data or other sources believed to be reliable but we do not represent that it is accurate or complete and it should not be relied on as such. Firstcall Research or any of its affiliates shall not be in any way responsible for any loss or damage that may arise to any person from any inadvertent error in the information contained in this report. Firstcall Research and/ or its affiliates and/or employees will not be liable for the recipients’ investment decision based on this document.
- 10. Firstcall India Equity Research: Email – info@firstobjectindia.com C.V.S.L.Kameswari Pharma & Diversified U. Janaki Rao Capital Goods B. Anil Kumar Auto, IT & FMCG M. Vinayak Rao Diversified G. Amarender Diversified Firstcall Research Provides Industry Research on all the Sectors and Equity Research on Major Companies forming part of Listed and Unlisted Segments For Further Details Contact: Tel.: 022-2527 2510/2527 6077 / 25276089 Telefax: 022-25276089 040-20000235 /20000233 E-mail: info@firstobjectindia.com www.firstcallresearch.com