SEO Case Study: How I Increased SEO Traffic & Ranking by 50-60% in 6 Months
Mercury athletic footwear
1. Northwood university 1
Denisa, PJ and Jiang
MERCURY ATHLETIC FOOTWEAR
Problem statement:
West Coast Fashions, Inc a large business of men’s and women’s apparel decided to
dispose of one of their segments; Mercury Athletic. John Liedtke, head of the business
development for Active Gear, Inc saw it has a possible opportunity for them to acquire it.
The footwear industry is very competitive, with low growth and stable profit margins.
AGI is very profitable but it is smaller than its competitors, which is becoming a
disadvantage. Therefore, Liedtke believes that if they takeover Mercury will double
AGI’s revenue, increase it’s leverage with contract manufactures and expand its presence
with key retailers and distributions. Liedtke is evaluating the company in order to find out
whether the future benefits justify or surpass the present value of the investment in
Mercury.
Analysis:
In order for Liedtke to get a broader picture on the acquisition of Mercury, he needs to
compare and analyze a list of financial data from 2006 to 2011; projected balance sheet
accounts, operating results and free cash flows, and cost of capital calculations. This data
will enable him to identify the strengths and weaknesses of this acquisition.
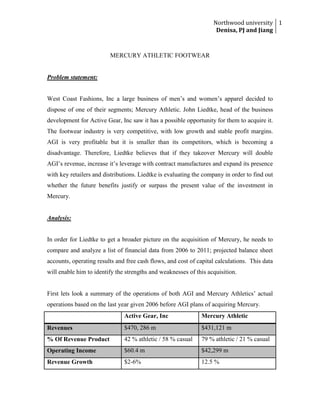
First lets look a summary of the operations of both AGI and Mercury Athletics’ actual
operations based on the last year given 2006 before AGI plans of acquiring Mercury.
Active Gear, Inc Mercury Athletic
Revenues $470, 286 m $431,121 m
% Of Revenue Product 42 % athletic / 58 % casual 79 % athletic / 21 % casual
Operating Income $60.4 m $42,299 m
Revenue Growth $2-6% 12.5 %
2. By looking at this table superficially and keeping in mind that Active Gear is one of the
most profitable firms in the footwear industry, Mercury seems to be an attractive
investment because they have almost the same revenues as AGI while being smaller in
the market. Then we can see that the % revenue product compensates for the lack in both
companies. The revenue for the athletic shoes in AGI is low therefore taking Mercury
under their wing would increase that revenue and vice versa for the casual shoes as well.
Finally when looking at revenue growth the industry average is 10 % and AGI is below
it putting the company at risk while Mercury is above it by 2.5 % more, it would be good
to acquire the company to stay on top of the market.
Free cash Flow of Mercury
2006 2007 2008 2009 2010 2011
Revenue 431,121.00 479,329.00 489,028.00 532,137.00 570,319.00 597,717.00
Less: divisional operating expenses 423,837.00 427,333.00 465,110.00 498,535.00 522,522.00
Less: corporate overhead 8,487.00 8,659.00 9,422.00 10,098.00 10,583.00
EBIT 42,299.00 47,005.00 53,036.00 57,605.00 61,686.00 64,612.00
Less: taxes 16,919.60 18,802.00 21,214.40 23,042.00 24,674.40 25,844.80
NOPAT (EBIT (1-t) 25,379.40 28,203.00 31,821.60 34,563.00 37,011.60 38,767.20
Plus: depreciation 9,506.00 9,587.00 9,781.00 10,643.00 11,406.00 11,954.00
Net working capital 104,116.00 108,685.00 111,333.00 121,138.00 129,825.00 136,059.00
Less: changes in working capital 4,569.00 2,648.00 9,805.00 8,687.00 6,234.00
Less: capital expenditures 11,983.00 12,226.00 13,303.00 14,258.00 14,943.00
Less: changes in other assets 0.00 0.00 0.00 0.00 0.00
Plus: changes in other liabilities 0.00 0.00 0.00 0.00 0.00
Free cash Flow 21,238.00 26,728.60 22,098.00 25,472.60 29,544.20
Terminal Value 522,906.19
Discount Rate 7.65%
Growth rate 2.00%
Discount cash flow 19,728.75 23,064.72 17,713.76 18,967.81 382,140.54
The total discount cash flow 461,615.58
Acquisition price 186,215.80
NPV 275,399.78
3. Northwood university 3
Denisa, PJ and Jiang
Quantitative valuation:
In the Mercury Segment Data 2004-2006 exhibit the EBIT margin is 9.8 % that means
knowing that the industry average is 10 % it shows us Mercury’s profitability after
removing all expenses but excluding taxes and interest. It is important to look at it
because it is a measure that investors can use to evaluate the financial health of the
company. However Liedkte being more conservative he says that the combined
businesses could achieve and EBIT of 9 % and when looking at the projections for
Mercury from 2007-2011 we can see a growth in earnings. So then what are the cash
flows if Liedtke thinks the combined businesses will have a revenue growth of 2% in
year 2011 considering we discounting back to 2006. We need to calculate the Free Cash
Flow (FCF) in order to determine if the Net profit Value is positive or negative. Knowing
that we will know if the acquisition should be undertaken. When looking at the excel
sheet we can see that the NVP using the discount rate given by the case 7.65 % with a
growth rate of 3 % gives us an NVP= $275,399.78. Therefore the NVP’s value compares
the value of the investment made today to the same value of the amount in the future. So
that is the amount AGI needs to pay up front. The free cash flows are made from the
financial statement given in the case and were determined using the FCF method; EBIT
(1-Tax Rate) + Depreciation & Amortization - Change in Net Working Capital - Capital
Expenditure. If AGI pays the acquisition price of $186,215.80, the will get in 5 years $
461,615.58 as a total discounted cash flow.
Taking the Total Discounted cash flow minus the acquisition price will gives us the NVP,
which as mentioned above will be the amount that needs to be paid up front.
The discount rate is an interest rate that is used for calculating the present value of future
cash flows. It shows us what our money is worth in the future. The importance of using
the discount rate is that it will show the risk that comes with future income. In this case
we are using three different discount rates, one as shown in the book, one with less risk,
and one with more risk. In the process of using discount rate we believe we utilize the
4. time value of money; this concept is used, when (for example) a company makes an
investment. The idea (and importance) of this concept is that your money is worth more
in the present than in the future, and allows you to see your income stream in the future.
The process that occurs is that the money you make now will earn you interest, the
interest earned on that money will also gain interest in the future, which is called
compounding interest. It can show you if an investment will gain you money or will lose
you money.
We have made two other scenarios one with a lower discount rate then the 7.65 % which
means that less risks and inflation has been taken into consideration. With a lower
discount rate has the NPV has increased however taking in less risk can actually be more
riskier because you plan on having that amount of money but if something happens in the
course of the future years that amount won’t be that exact amount set earlier therefore
that is why we have to increase the discount rate to 15 % to make sure that there are no
surprises, of course with increasing it, NPV goes down but its better to be safe than sorry.
Free cash flow with lower Discounted rate
2006 2007 2008 2009 2010 2011
Revenue 431,121.00 479,329.00 489,028.00 532,137.00 570,319.00 597,717.00
Less: divisional operating expenses 423,837.00 427,333.00 465,110.00 498,535.00 522,522.00
Less: corporate overhead 8,487.00 8,659.00 9,422.00 10,098.00 10,583.00
EBIT 42,299.00 47,005.00 53,036.00 57,605.00 61,686.00 64,612.00
Less: taxes 16,919.60 18,802.00 21,214.40 23,042.00 24,674.40 25,844.80
NOPAT (EBIT (1-t) 25,379.40 28,203.00 31,821.60 34,563.00 37,011.60 38,767.20
Plus: depreciation 9,506.00 9,587.00 9,781.00 10,643.00 11,406.00 11,954.00
Net working capital 104,116.00 108,685.00 111,333.00 121,138.00 129,825.00 136,059.00
Less: changes in working capital 4,569.00 2,648.00 9,805.00 8,687.00 6,234.00
Less: capital expenditures 11,983.00 12,226.00 13,303.00 14,258.00 14,943.00
Less: changes in other assets 0.00 0.00 0.00 0.00 0.00
Plus: changes in other liabilities 0.00 0.00 0.00 0.00 0.00
Free cash Flow 21,238.00 26,728.60 22,098.00 25,472.60 29,544.20
Terminal Value 687,074.42
Discount Rate 6.30%
Growth Rate 2.00%
Discount cash flow 19,979.30 23,654.28 18,397.26 19,949.88 527,985.22
The total discount cash flow 609,965.94
Acquisition price 186,215.80
5. Northwood university 5
Denisa, PJ and Jiang
NPV 423,750.14
Free cash flow of Mercury with Higher discounted rate
2006 2007 2008 2009 2010 2011
Revenue 431,121.00 479,329.00 489,028.00 532,137.00 570,319.00 597,717.00
Less: divisional operating expenses 423,837.00 427,333.00 465,110.00 498,535.00 522,522.00
Less: corporate overhead 8,487.00 8,659.00 9,422.00 10,098.00 10,583.00
EBIT 42,299.00 47,005.00 53,036.00 57,605.00 61,686.00 64,612.00
Less: taxes 16,919.60 18,802.00 21,214.40 23,042.00 24,674.40 25,844.80
NOPAT (EBIT (1-t) 25,379.40 28,203.00 31,821.60 34,563.00 37,011.60 38,767.20
Plus: depreciation 9,506.00 9,587.00 9,781.00 10,643.00 11,406.00 11,954.00
Net working capital 104,116.00 108,685.00 111,333.00 121,138.00 129,825.00 136,059.00
Less: changes in working capital 4,569.00 2,648.00 9,805.00 8,687.00 6,234.00
Less: capital expenditures 11,983.00 12,226.00 13,303.00 14,258.00 14,943.00
Less: changes in other assets 0.00 0.00 0.00 0.00 0.00
Plus: changes in other liabilities 0.00 0.00 0.00 0.00 0.00
Free cash Flow 21,238.00 26,728.60 22,098.00 25,472.60 29,544.20
Terminal Value 227,263.08
Discount Rate 15.00%
Growth rate 2.00%
Discount cash flow 18,467.83 20,210.66 14,529.79 14,564.04 127,678.60
The total discount cash flow 195,450.93
Acquisition price 186,215.80
NPV 9,235.13
Qualitative valuation:
Besides the numbers there are other methods to valuate the company and that it by
looking at the opportunities it has for the company. Even though this acquisition may not
generate any amount of money for example, which is not the case for AGI and Mercury.
Sometimes entering such an investment can get you to acquire a larger market share,
which later on will end up generating some sort of revenue. Other reasons for acquiring
would be to prevent competitors from taking over, diversify in products, gain more
technologies and distribution channels and finally to simply grow as a company which in
the case of AGI is important in order to stay at the top of the competition.
6. Other methods of valuating:
Besides the Free Cash Flow method there are two other ways that can value the company.
Terminal value is the expected selling price that a company values at some point in the
future, which means how much cash can the investor gather at that point. This value can
be estimated by five methods like liquidation value, book value or no-growth perpetuity.
In this case, it was assumed that the Mercury company could growth perpetuity and
stable in the future. Therefore, the terminal value of the company is $522,906.19 [made
from FCFT+1/ (Kw-g), where FCFT+1 is free cash flow in the first year beyond the forecast
horizon and Kw=discount rate=7.65%, g=growth rate=2%]. This is the value that is
estimated to see the value of the Mercury Corporation after 2011.
Following IRR, the internal rate of return is the discount rate when cash inflow equals to
cash outflow, which means the net present value (NPV) equals to zero. It is a standard
that evaluate the return on investment. Most of the time, the bigger the IRR, it is more
acceptable to invest. IRR is becoming more and more important that it is more scientific
to evaluate the investment than simply seeing how much in return. In this case, the cash
inflow is the acquisition price, which used to purchase the Mercury Corporation. The
price per earnings ratio comes from a comparable footwear company in Exhibit 3. This
price per earnings ratio is used because it is the closest number that can match the market
view of Mercury Athletic. Therefore the acquisition price is $186,615.80. When the
acquisition price equals to cash outflow, the IRR is 15.6%. Since the discount rate is
7.65%, this acquisition is technically acceptable. If the IRR changes to 2%, which is less
than the discount rate, this investment is probably going to loss in the future. However,
since the IRR comes from acquisition price, there could be certain inaccurate if the
acquisition price is not established correctly. For example, the revenue enhancement and
cost reduction could be overestimated. Other factors include underestimate cultural or
personnel issues because of too much emphasis on the numbers and not enough emphasis
on the people.
7. Northwood university 7
Denisa, PJ and Jiang
Further consideration to take note of when valuating:
It is important to mention how important it is to look at the working capital as a source of
funding. Working Capital is a way for a company to measure its financial efficiency, as
well as their ability to pay their short-term debt. When a company has a negative working
capital there are not able to pay-off their short-term debt, because their current liabilities
exceed their current assets, in that case the company has a working capital deficit. On the
other hand, when a company has a positive working capital, they are able to pay off their
short-term debt and continue with their operations. The formula to calculate a company’s
net working capital is, working capital= current assets – current liabilities. The
importance for a company to know their working capital is, because it shows them how
their generating cash, in other words if the company is being successful. It isn’t only
important for the company to know their net working capital, but also for outside
investors, this way they can see the company’s operational efficiency. In the case of AGI
their total current assets are $ 190,655, and their total current liabilities are $ 80,767,
which means their net working capital is $190,655-$80,767= $109,888. They have a
positive working capital, which could contribute for the acquisition. This amount could
be used for the payment for the acquisition.
To see if the investment should be pursued AGI can use WACC, in this case it was use
only in the determination of the discount rate. The purpose of the WACC measures the
cost of a company to borrow money to finance its assets (capital), which are financed
either through debt or equity. This method averages the cost of debt or equity by looking
at how it’s going to be used and so allows us to see how much the company has to pay in
interest for each amount of money it finances. For example lets say the WACC is said to
be 10 % then any returns under the same % or lower will not be considered. That 10 % is
8. the minimum rate of return which produces value for investors if the actual rate of return
is lets say 15 % then for each dollar the company makes 5 more dollar of value. In this
case however not being given where the financing is coming from; whether its equity,
debt or both; the investor has to know if it allows him to pay pack the interest rate of rate
of return.
The other method that could be use to utilized to define the company’s cost of equity
would be the Capital Asset Pricing Model which measures the relationship between risk
and expected returns of a security (bond, common stock, preferred stock, long- term debt)
or portfolio (risky stocks combined to lower the risk). CAPM is used to compensate
investors either through time value money; putting money into an investment over a
period of time) or through risk. If the expected value does not come to the require rate of
return (hurdle rate) or beat it shouldn’t be undertaken. This helps investors evaluate and
anticipate the risk and returns of their investments.
Recommendations:
Liedtke, we believe has sufficient financial data to decide whether to for go with the
acquisition or not. The project itself at a given rate or 7.65 % has a positive Net Present
Value and even when the discount rate is increased it remains positive, which is better for
him to take into consideration because it includes more risks taken into account. Many
other reasons mentioned earlier make it a good investment especially due to the fact that
they are at the top of the industry but are relatively small and risk of being overtaken by
others, acquiring Mercury would give them the opportunity to grow bigger. Besides that
it would increase revenue, boost the capacity utilization and expand itself to a bigger
numbers of retailers and distributors and increase the leverage with the manufacturers,
the more leverage AGI has the more likely it can make money.