Capital First: Long-term credit rating is rated highly at AA+ by CARE
•
1 like•396 views

Capital First: Long-term credit rating is rated highly at AA+ by CARE; Buy #BrokerAdvice http://goo.gl/6nXZHR

Recommended
Recommended
More Related Content
What's hot
What's hot (20)
Similar to Capital First: Long-term credit rating is rated highly at AA+ by CARE
Similar to Capital First: Long-term credit rating is rated highly at AA+ by CARE (20)
More from IndiaNotes.com
More from IndiaNotes.com (20)
Recently uploaded
Recently uploaded (20)
Capital First: Long-term credit rating is rated highly at AA+ by CARE
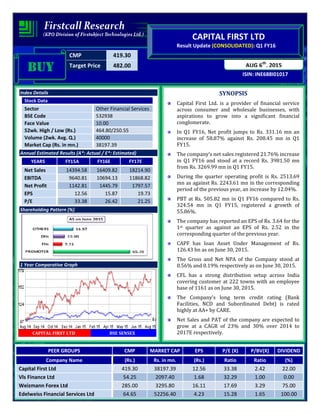
- 1. CMP 419.30 Target Price 482.00 ISIN: INE688I01017 AUG 6th , 2015 CAPITAL FIRST LTD Result Update (CONSOLIDATED): Q1 FY16 BUYBUYBUYBUY Index Details Stock Data Sector Other Financial Services BSE Code 532938 Face Value 10.00 52wk. High / Low (Rs.) 464.80/250.55 Volume (2wk. Avg. Q.) 40000 Market Cap (Rs. in mn.) 38197.39 Annual Estimated Results (A*: Actual / E*: Estimated) YEARS FY15A FY16E FY17E Net Sales 14394.58 16409.82 18214.90 EBITDA 9640.81 10694.13 11868.82 Net Profit 1142.81 1445.79 1797.57 EPS 12.56 15.87 19.73 P/E 33.38 26.42 21.25 Shareholding Pattern (%) 1 Year Comparative Graph CAPITAL FIRST LTD BSE SENSEX SYNOPSIS Capital First Ltd. is a provider of financial service across consumer and wholesale businesses, with aspirations to grow into a significant financial conglomerate. In Q1 FY16, Net profit jumps to Rs. 331.16 mn an increase of 58.87% against Rs. 208.45 mn in Q1 FY15. The company’s net sales registered 21.76% increase in Q1 FY16 and stood at a record Rs. 3981.50 mn from Rs. 3269.99 mn in Q1 FY15. During the quarter operating profit is Rs. 2513.69 mn as against Rs. 2243.61 mn in the corresponding period of the previous year, an increase by 12.04%. PBT at Rs. 505.82 mn in Q1 FY16 compared to Rs. 324.54 mn in Q1 FY15, registered a growth of 55.86%. The company has reported an EPS of Rs. 3.64 for the 1st quarter as against an EPS of Rs. 2.52 in the corresponding quarter of the previous year. CAPF has loan Asset Under Management of Rs. 126.43 bn as on June 30, 2015. The Gross and Net NPA of the Company stood at 0.56% and 0.19% respectively as on June 30, 2015. CFL has a strong distribution setup across India covering customer at 222 towns with an employee base of 1161 as on June 30, 2015. The Company’s long term credit rating (Bank Facilities, NCD and Subordinated Debt) is rated highly at AA+ by CARE. Net Sales and PAT of the company are expected to grow at a CAGR of 23% and 30% over 2014 to 2017E respectively. PEER GROUPS CMP MARKET CAP EPS P/E (X) P/BV(X) DIVIDEND Company Name (Rs.) Rs. in mn. (Rs.) Ratio Ratio (%) Capital First Ltd 419.30 38197.39 12.56 33.38 2.42 22.00 Vls Finance Ltd 54.25 2097.40 1.68 32.29 1.00 0.00 Weizmann Forex Ltd 285.00 3295.80 16.11 17.69 3.29 75.00 Edelweiss Financial Services Ltd 64.65 52256.40 4.23 15.28 1.65 100.00
- 2. QUARTERLY HIGHLIGHTS (CONSOLIDATED) Results updates- Q1 FY16, Capital First Ltd. is a provider of financial service across consumer and wholesale businesses, with aspirations to grow into a significant financial conglomerate has reported its financial results for the quarter ended 30th June, 2015. The company has achieved a turnover of Rs. 3981.50 million for the 1st quarter of the current year 2015-16 as against Rs. 3269.99 million in the corresponding quarter of the previous year. EBITDA of Rs. 2513.69 million in Q1 FY16, an increase of 12.04% against the corresponding period of last year. In Q1 FY16, net profit of Rs. 331.16 million against Rs. 208.45 million in the corresponding quarter of the previous year. The company has reported an EPS of Rs. 3.64 for the 1st quarter as against an EPS of Rs. 2.52 in the corresponding quarter of the previous year. Break up of Expenditure Rs. In million June-15 June-14 % Change Net Sales 3981.50 3269.99 21.76 PAT 331.16 208.45 58.87 EPS 3.64 2.52 44.42 EBITDA 2513.69 2243.61 12.04 Break up of Expenditure (Rs. In millions) Q1 FY16 Q1 FY15 % Change Employee benefits expenses 371.47 331.84 12% Depreciation & amortization expense 21.70 23.87 -9% Provision and write offs 508.30 212.39 139% Amortized loan origination cost 227.21 112.21 102% Legal and Professional charges 76.16 136.06 -44% Other expenses 286.66 236.10 21%
- 3. Latest Updates • The Company’s long term credit rating (Bank Facilities, NCD and Subordinated Debt) is rated highly at AA+ by CARE. • The company has consistently increased its MSME and Retail financing from 10% on March 31, 2010 to 85.15% as on June 30, 2015. • CFL has loan Asset Under Management of Rs. 126.43 bn as on June 30, 2015. • CFL has a strong distribution setup across India covering customer at 222 towns with an employee base of 1161 as on June 30, 2015. • The Capital Adequacy is 22.13% as on June 30, 2015. The Gross and Net NPA of the Company stood at 0.56% and 0.19% respectively as on June 30, 2015. COMPANY PROFILE Capital First is a provider of financial service across consumer and wholesale businesses, with aspirations to grow into a significant financial conglomerate. Capital First Ltd. is a Systemically important NBFC with record of consistent growth & profitability. Capital First has a comprehensive product suite to meet multiple financial needs of customers including Consumer Lending, Corporate Lending. Capital First is a Non-Banking Finance Company listed on NSE and BSE, with a record of consistent growth & profitability. Products Loan Against Property Two-Wheeler Loan Durable Loan Business Loan Insurance Corporate Loan
- 4. FINANCIAL HIGHLIGHT (CONSOLIDATED) (A*- Actual, E* -Estimations & Rs. In Millions) Balance Sheet as at March 31, 2014 -2017E FY14A FY15A FY16E FY17E I. EQUITY AND LIABILITIES: A. Shareholders’ Funds a) Share Capital 820.22 909.82 910.98 910.98 b) Reserves and Surplus 10889.95 14827.84 16273.63 18071.20 Sub-Total-Net worth 11710.17 15737.66 17184.61 18982.18 B. Share application money pending allotment 8.36 0.00 0.00 0.00 C. Non-Current Liabilities: a) Long-term borrowings 55700.92 47225.76 43919.96 41284.76 b) Other Long Term Liabilities 383.63 463.56 547.00 634.52 c) Long Term Provisions 952.58 968.04 1006.76 1047.03 Sub-Total-Long term liabilities 57037.13 48657.36 45473.72 42966.31 D. Current Liabilities: a) Short-term borrowings 14664.46 13878.48 13323.34 12923.64 b) Trade Payables 1396.73 816.87 898.56 970.44 c) Other Current Liabilities 16125.92 26846.90 34364.03 41924.12 d) Short Term Provisions 376.59 883.25 1130.56 1311.45 Sub-Total-Current Liabilities 32563.70 42425.50 49716.49 57129.65 TOTAL-EQUITY AND LIABILITIES (A+B+C+D) 101319.36 106820.52 112374.82 119078.15 II. ASSETS: E. Non-Current Assets: Fixed Assets i. Tangible assets 224.01 138.46 149.54 157.01 ii. Intangible assets 51.63 52.45 55.07 57.28 a) Sub Total Fixed Assets 275.64 190.91 204.61 214.29 b) Goodwill on consolidation 64.49 0.00 0.00 0.00 c) Non Current Investments 11.07 0.00 0.00 0.00 d) Deferred tax assets 170.80 421.28 488.68 557.10 e) Long Term Loans and Advances 50084.55 66386.20 71975.39 77226.80 f) Other non-current assets 2517.64 2626.90 2758.25 2868.57 Sub-Total-Non-Current Assets 53124.19 69625.29 75426.93 80866.76 F. Current Assets: a) Current Investment 3463.15 948.87 1043.76 1148.13 b) Trade Receivables 93.60 100.78 107.83 116.46 c) Cash and Bank Balances 20130.75 10570.58 9513.52 9989.20 d) Short Term Loans and Advances 23143.56 23939.41 24418.20 24906.56 e) Other Current Assets 1364.11 1635.59 1864.57 2051.03 Sub-Total-Current Assets 48195.17 37195.23 36947.88 38211.38 TOTAL-ASSETS (E+F) 101319.36 106820.52 112374.82 119078.15
- 5. Annual Profit & Loss Statement for the period of 2014 to 2017E Value(Rs.in.mn) FY14A FY15A FY16E FY17E Description 12m 12m 12m 12m Net Sales 10674.07 14394.58 16409.82 18214.90 Other Income 31.12 71.15 27.75 29.14 Total Income 10705.19 14465.73 16437.57 18244.04 Expenditure -3582.34 -4824.92 -5743.44 -6375.22 Operating Profit 7122.85 9640.81 10694.13 11868.82 Interest -6468.25 -7878.07 -8508.32 -9188.98 Gross profit 654.60 1762.74 2185.82 2679.84 Depreciation -64.32 -99.57 -105.54 -111.88 Profit Before Tax 590.28 1663.17 2080.27 2567.96 Tax -63.99 -520.36 -634.48 -770.39 Net Profit 526.29 1142.81 1445.79 1797.57 Equity capital 826.32 909.82 910.98 910.98 Reserves 10889.95 14827.84 16273.63 18071.20 Face value 10.00 10.00 10.00 10.00 EPS 6.37 12.56 15.87 19.73 Quarterly Profit & Loss Statement for the period of 31st Dec, 2014 to 30th Sep, 2015E Value(Rs.in.mn) 31-Dec-14 31-Mar-15 30-Jun-15 30-Sep-15E Description 3m 3m 3m 3m Net sales 3798.35 3850.42 3981.50 4220.39 Other income 3.09 0.81 1.99 2.23 Total Income 3801.44 3851.23 3983.49 4222.62 Expenditure -1276.75 -1347.27 -1469.80 -1481.36 Operating profit 2524.69 2503.96 2513.69 2741.26 Interest -2046.42 -2008.46 -1986.17 -2045.76 Gross profit 478.27 495.50 527.52 695.51 Depreciation -24.70 -27.42 -21.70 -22.57 Profit Before Tax 453.57 468.08 505.82 672.94 Tax -154.44 -103.35 -174.66 -211.64 Net Profit 299.13 364.73 331.16 461.30 Equity capital 831.31 909.82 910.98 910.98 Face value 10.00 10.00 10.00 10.00 EPS 3.60 4.01 3.64 5.06
- 6. Ratio Analysis Particulars FY14A FY15A FY16E FY17E EPS (Rs.) 6.37 12.56 15.87 19.73 EBITDA Margin (%) 66.73 66.98 65.17 65.16 PBT Margin (%) 5.53 11.55 12.68 14.10 PAT Margin (%) 4.93 7.94 8.81 9.87 P/E Ratio (x) 65.83 33.38 26.42 21.25 ROE (%) 4.49 7.26 8.41 9.47 ROCE (%) 8.76 12.68 14.51 16.37 Debt Equity Ratio 6.01 3.88 3.33 2.86 EV/EBITDA (x) 11.43 9.10 7.94 6.85 Book Value (Rs.) 141.79 172.98 188.64 208.37 P/BV 2.96 2.42 2.22 2.01 Charts
- 7. OUTLOOK AND CONCLUSION At the current market price of Rs. 419.30, the stock P/E ratio is at 26.42 x FY16E and 21.25 x FY17E respectively. Earning per share (EPS) of the company for the earnings for FY16E and FY17E is seen at Rs.15.87 and Rs.19.73 respectively. Net Sales and PAT of the company are expected to grow at a CAGR of 23% and 30% over 2014 to 2017E respectively. On the basis of EV/EBITDA, the stock trades at 7.94 x for FY16E and 6.85 x for FY17E. Price to Book Value of the stock is expected to be at 2.22 x and 2.01 x for FY16E and FY17E respectively. We expect that the company surplus scenario is likely to continue for the next three years, will keep its growth story in the coming quarters also. We recommend ‘BUY’ in this particular scrip with a target price of Rs.482.00 for Medium to Long term investment. INDUSTRY OVERVIEW Micro, Small and Medium enterprises form a large part of the Indian Economy. They generate employment and act as a catalyst for socio-economic transformation in India. There are more than 29 million MSME enterprises across India employing more than 69 million people. MSME sector, especially the unorganized micro and small enterprises, lack in support from the existing ecosystem, owing to their small scale which in turn is an impediment to their growth. India has a diversified financial sector, which is undergoing rapid expansion. The sector comprises commercial banks, insurance companies, non-banking financial companies, co-operatives, pension funds, mutual funds and other smaller financial entities. The financial sector in India is predominantly a
- 8. banking sector with commercial banks accounting for more than 60 per cent of the total assets held by the financial system. India's services sector has always served the country’s economy well, accounting for about 57 per cent of the gross domestic product (GDP). In this regard, the financial services sector has been an important contributor. India’s gross domestic savings (GDS) as a percentage of gross domestic product (GDP) has mostly remained above 30 per cent since 2004 and stood at 32.7 per cent in FY13. It is expected that the domestic savings in India will reach US$ 1,272 billion by 2019 from US$ 683 billion in 2013. The financial services sector consists of the capital markets, insurance sector and non-banking financial companies (NBFCs). The asset management industry in India is among the fastest growing in the world. Total asset under management (AUM) of the mutual fund industry clocked a compound annual growth rate (CAGR) of 15.9 per cent over FY07-14 to reach US$ 150 billion. Outlook India is today one of the most vibrant global economies, on the back of robust banking and insurance sectors. The country is projected to become the fifth largest banking sector globally by 2020, as per a joint report by KPMG- CII. The report also expects bank credit to grow at a compound annual growth rate (CAGR) of 17 per cent in the medium term leading to better credit penetration. Life Insurance Council, the industry body of life insurers in the country also projects a CAGR of 12–15 per cent over the next few years for the financial services segment. There is a lot of scope for growth in the financial services sector with the total wealth holdings by High Net worth Individuals (HNWI) in India, which is estimated at US$ 584.5 billion, projected to reach US$ 3 trillion by 2020. Also, there is potential in the rural credit sector which can be tapped by ensuring timely loans that are critical to the agricultural industry. Disclaimer: This document is prepared by our research analysts and it does not constitute an offer or solicitation for the purchase or sale of any financial instrument or as an official confirmation of any transaction. The information contained herein is from publicly available data or other sources believed to be reliable but we do not represent that it is accurate or complete and it should not be relied on as such. Firstcall Research or any of its affiliates shall not be in any way responsible for any loss or damage that may arise to any person from any inadvertent error in the information contained in this report. Firstcall Research and/ or its affiliates and/or employees will not be liable for the recipients’ investment decision based on this document.
- 9. Firstcall India Equity Research: Email – info@firstobjectindia.com C.V.S.L.Kameswari Pharma & Diversified U. Janaki Rao Capital Goods B. Anil Kumar Auto, IT & FMCG M. Vinayak Rao Diversified G. Amarender Diversified Firstcall Research Provides Industry Research on all the Sectors and Equity Research on Major Companies forming part of Listed and Unlisted Segments For Further Details Contact: Tel.: 022-2527 2510/2527 6077 / 25276089 Telefax: 022-25276089 040-20000235 /20000233 E-mail: info@firstobjectindia.com www.firstcallresearch.com