Analysis of Algorithm Company Performance and Stock Price Prediction Over 3 Months
•
0 likes•67 views

This document provides a performance analysis of Algorithm (consolidated) over several periods from 2017-2021. It includes key financial metrics such as sales, operating profit, net income, debt ratio, and earnings per share. It also evaluates the company's current stock price compared to different price ranges and provides a stock purchase recommendation based on the company's probability score.
![[Price for scheduled purchasing]
Arbitrarily made
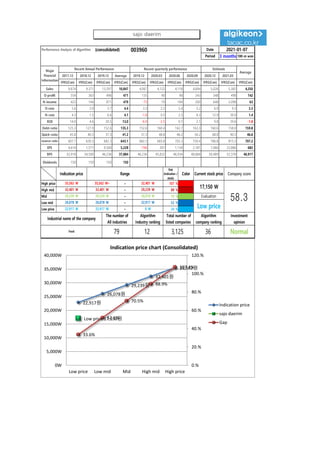
Algorithm stocks Trading Strategies (consolidated) 003960 Date
Period
Gap
(Indication /
stock)
Color
2021-01-07
3 months
Current stock price Evaluation
Stock price rise
probability score
Investment opinion Prospective purchase amount
17,150 W Low price 46.9 Normal 9,400,000 W
Suggested Purchase
Amount 4,678,362 W
Number of stocks
purchased 273
Indication price Range Buying / Selling Buying / Selling [Stocks]
High price 35,562 W 35,562 W~ ~ 32,401 W 107 % -5,022,575 W All selling
High mid 32,401 W 32,401 W ~ 29,239 W 89 % -4,160,215 W -128
Mid 29,239 W 29,239 W ~ 26,078 W 70 % -3,297,855 W -113
Low mid 26,078 W 26,078 W ~ 22,917 W 52 % -2,435,495 W -93
low price 22,917 W 22,917 W ~ 0 W 34 % -1,573,135 W -69
Stock price rise
probability score
A Sector 45.8 49.4 49.8 49.4 49.4 47.3
46.9B Sector 32.1 41.7 40.4 49.4 37.9 20.0
Total average
2020.08.07 2020.09.07 2020.10.08 2020.11.06 2020.12.04 2021.01.06
38.9 45.5 45.1 42.9 43.7 33.6
2 % -30 %
2020.09.07 2020.10.08 2020.11.06 2020.12.04 2021.01.06
Total of
increase rate
Total score
A Sector 7 % 1 % -1 % 0 % -4 %
-4 % 44.0B Sector 23 % -3 % 18 % -30 % -90 %
Total average 14 % -1 % -5 %
46
49 50 49 49 47
32
42 40
49
38
20
39
46 45 43 44
34
0
10
20
30
40
50
60
2020.08.07 2020.09.07 2020.10.08 2020.11.06 2020.12.04 2021.01.06
Stock price rise probability score
A sector
B sector
Total average
7%
1% -1% 0% -4%
23%
-3%
18%
-30%
-90%
14%
-1% -5%
2%
-30%
-100%
-80%
-60%
-40%
-20%
0%
20%
40%
2020.09.07 2020.10.08 2020.11.06 2020.12.04 2021.01.06
Increase rate of stock price rise
A sector
B sector
Total average
sajo daerim](data:image/gif;base64,R0lGODlhAQABAIAAAAAAAP///yH5BAEAAAAALAAAAAABAAEAAAIBRAA7)
Recommended
Recommended
More Related Content
What's hot
What's hot (20)
Similar to Analysis of Algorithm Company Performance and Stock Price Prediction Over 3 Months
Similar to Analysis of Algorithm Company Performance and Stock Price Prediction Over 3 Months (20)
More from 알고리즘 기업분석 컨설팅-알기컨,algikeon
More from 알고리즘 기업분석 컨설팅-알기컨,algikeon (20)
Recently uploaded
Recently uploaded (20)
Analysis of Algorithm Company Performance and Stock Price Prediction Over 3 Months
- 1. Performance Analysis of Algorithm (consolidated) 003960 Date Period 3 months 100-m won 2017.12 2018.12 2019.12 Average 2019.12 2020.03 2020.06 2020.09 2020.12 2021.03 IFRS(Con) IFRS(Con) IFRS(Con) IFRS(Con) IFRS(Con) IFRS(Con) IFRS(Con) IFRS(Con) IFRS(Con) IFRS(Con) IFRS(Con) Sales 9,874 9,371 13,297 10,847 4,067 4,122 4,118 4,694 5,026 5,382 4,250 O-profit 554 363 496 471 135 90 98 243 348 498 142 N-income 423 144 871 479 -73 19 104 200 648 2,098 63 O-rate 5.6 3.9 3.7 4.4 3.3 2.2 2.4 5.2 6.9 9.3 3.3 N-rate 4.3 1.5 6.6 4.1 -1.8 0.5 2.5 4.3 12.9 39.0 1.4 ROE 14.0 4.6 20.5 13.0 -6.9 -2.5 0.1 2.1 9.8 29.6 -1.8 Debt-ratio 125.3 127.9 152.6 135.3 152.6 160.4 162.7 163.3 160.6 158.0 159.8 Quick-ratio 45.8 40.3 37.3 41.2 37.3 48.8 46.2 54.2 68.8 90.3 46.6 reserve-ratio 607.7 639.3 682.3 643.1 682.3 683.8 703.3 759.4 786.8 815.3 707.2 EPS 4,614 1,571 9,500 5,228 -796 207 1,134 2,181 7,066 22,886 682 BPS 32,918 34,500 46,236 37,884 46,236 45,832 46,934 48,668 50,489 52,378 46,917 Dividends 150 150 150 150 2021-01-07 Major Financial Information Recent Annual Performance Recent quarterly performance Estimate Average Gap (Indication / stock) Color High price ~ 107 % High mid ~ 89 % Mid ~ 70 % Low mid ~ 52 % Low price ~ 34 % Indication price Range Current stock price Company score 32,401 W 32,401 W 29,239 W 29,239 W 29,239 W 26,078 W Evaluation 35,562 W 35,562 W~ 32,401 W 17,150 W 58.326,078 W 26,078 W 22,917 W Low price Normal 22,917 W 22,917 W 0 W Industrial name of the company The number of All industries Algorithm Industry ranking Total number of listed companies Algorithm company ranking Investment opinion Food 79 12 3,125 36 22,917원 26,078원 29,239원 32,401원 35,562원 Low price 17,150원 33.6% 52.1% 70.5% 88.9% 107.4% 0.% 20.% 40.% 60.% 80.% 100.% 120.% 0W 5,000W 10,000W 15,000W 20,000W 25,000W 30,000W 35,000W 40,000W Low price Low mid Mid High mid High price Indication price chart (Consolidated) Indication price sajo daerim Gap sajo daerim
- 2. [Price for scheduled purchasing] Arbitrarily made Algorithm stocks Trading Strategies (consolidated) 003960 Date Period Gap (Indication / stock) Color 2021-01-07 3 months Current stock price Evaluation Stock price rise probability score Investment opinion Prospective purchase amount 17,150 W Low price 46.9 Normal 9,400,000 W Suggested Purchase Amount 4,678,362 W Number of stocks purchased 273 Indication price Range Buying / Selling Buying / Selling [Stocks] High price 35,562 W 35,562 W~ ~ 32,401 W 107 % -5,022,575 W All selling High mid 32,401 W 32,401 W ~ 29,239 W 89 % -4,160,215 W -128 Mid 29,239 W 29,239 W ~ 26,078 W 70 % -3,297,855 W -113 Low mid 26,078 W 26,078 W ~ 22,917 W 52 % -2,435,495 W -93 low price 22,917 W 22,917 W ~ 0 W 34 % -1,573,135 W -69 Stock price rise probability score A Sector 45.8 49.4 49.8 49.4 49.4 47.3 46.9B Sector 32.1 41.7 40.4 49.4 37.9 20.0 Total average 2020.08.07 2020.09.07 2020.10.08 2020.11.06 2020.12.04 2021.01.06 38.9 45.5 45.1 42.9 43.7 33.6 2 % -30 % 2020.09.07 2020.10.08 2020.11.06 2020.12.04 2021.01.06 Total of increase rate Total score A Sector 7 % 1 % -1 % 0 % -4 % -4 % 44.0B Sector 23 % -3 % 18 % -30 % -90 % Total average 14 % -1 % -5 % 46 49 50 49 49 47 32 42 40 49 38 20 39 46 45 43 44 34 0 10 20 30 40 50 60 2020.08.07 2020.09.07 2020.10.08 2020.11.06 2020.12.04 2021.01.06 Stock price rise probability score A sector B sector Total average 7% 1% -1% 0% -4% 23% -3% 18% -30% -90% 14% -1% -5% 2% -30% -100% -80% -60% -40% -20% 0% 20% 40% 2020.09.07 2020.10.08 2020.11.06 2020.12.04 2021.01.06 Increase rate of stock price rise A sector B sector Total average sajo daerim
- 3. 정보와 완전 정보 결 투자판단 있습니 위배 무단으 숙지하 Compliance notice ① The information provided by The Algorithm Company Analysis Consulting is obtained through reliable data and information and The Algorithm Company Analysis Program (TACAP), but its accuracy or completeness are not guaranteed. Furthermore, it may change over time.Therefore, we are not legally responsible for the results of the data provided by The Algorithm Company Analysis Consulting because of information errors or omissions. ② The Algorithm Company Analysis Consulting and all the information provided on it site are reference materials for investment decisions and the final responsibility of investment is up to users utilizing this information. ③ The Algorithm Company Analysis Consulting and its site do not do anything that violates the related laws such as discretionary transaction. ④ Users can not reallocate and recycle the information provided by The Algorithm Company Analysis Consulting firm let alone the information provided by its Site. ⑤ Be sure to know about application period of this algorithm analysis report in order to improve its accuracy. Tel : 070 - 4667 - 5009 Email : tacac@tacac.co.kr Homepage : tacac.co.kr Blog : tacac.blog.me SERVICES M&A, IPO, RECOVER, CORPORATE RESTRUCTURING, MANAGEMENT OF TECHNOLOGY, BUSINESS STRATEGY, FAMILY BUSINESS Request : http://tacac.co.kr/?page_id=1374 ① Consulting is o The Algorithm accuracy or com change over tim results of the d Consulting bec ② information pr investment dec up ③ do anything th transaction. ④ The Algorithm information pr ⑤ analysis report