samsung sdi 006400 Algorithm Investment Report
•
0 likes•109 views

samsung sdi 006400 Algorithm Investment Report
![[Price for scheduled purchasing]
Arbitrarily made
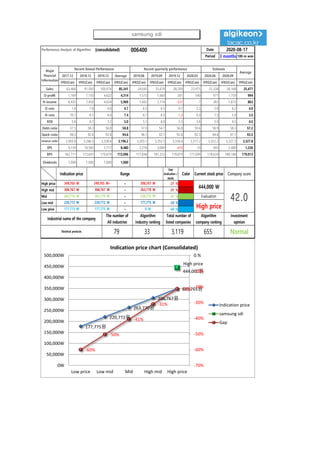
Algorithm stocks Trading Strategies (consolidated) 006400 Date
Period
Gap
(Indication /
stock)
Color
low price 177,775 W 177,775 W ~ 0 W -60 % 564,840 W 3
Low mid 220,772 W 220,772 W ~ 177,775 W -50 % 473,614 W 2
Mid 263,770 W 263,770 W ~ 220,772 W -41 % 382,387 W 1
High mid 306,767 W 306,767 W ~ 263,770 W -31 % 291,161 W 1
Suggested Purchase
Amount 942,018 W
Number of stocks
purchased 2
Indication price Range Buying / Selling Buying / Selling [Stocks]
High price 349,765 W 349,765 W~ ~ 306,767 W -21 % 199,935 W 1
2020-08-17
3 months
Current stock price Evaluation
Stock price rise
probability score
Investment opinion Prospective purchase amount
444,000 W High price 38.5 Normal 3,000,000 W
40.7 45.7 45.6 37.1 35.8 34.4
2020.03.23 2020.04.21 2020.05.22 2020.06.19 2020.07.17 2020.08.14
Stock price rise
probability score
A Sector 43.4 47.2 49.1 48.6 47.8 47.5
38.5B Sector 37.9 44.2 42.1 48.6 23.8 21.3
Total average
2020.05.22 2020.06.19 2020.07.17 2020.08.14
Total of
increase rate
Total score
A Sector 8 % 4 % -1 % -2 % -1 %
-4 % 44.0B Sector 14 % -5 % 13 % -105 % -12 %
Total average 11 % -0 % -23 % -4 % -4 %
2020.04.21
43
47 49 49 48 47
38
44 42
49
24 21
41
46 46
37 36 34
0
10
20
30
40
50
60
2020.03.23 2020.04.21 2020.05.22 2020.06.19 2020.07.17 2020.08.14
Stock price rise probability score
A sector
B sector
Total average
8% 4% -1% -2% -1%
14%
-5%
13%
-105%
-12%
11%
-0%
-23%
-4% -4%
-120%
-100%
-80%
-60%
-40%
-20%
0%
20%
40%
2020.04.21 2020.05.22 2020.06.19 2020.07.17 2020.08.14
Increase rate of stock price rise
A sector
B sector
Total average
samsung sdi](data:image/gif;base64,R0lGODlhAQABAIAAAAAAAP///yH5BAEAAAAALAAAAAABAAEAAAIBRAA7)
Recommended
Recommended
More Related Content
What's hot
What's hot (20)
Similar to samsung sdi 006400 Algorithm Investment Report
Similar to samsung sdi 006400 Algorithm Investment Report (20)
More from 알고리즘 기업분석 컨설팅-알기컨,algikeon
More from 알고리즘 기업분석 컨설팅-알기컨,algikeon (20)
Recently uploaded
Recently uploaded (20)
samsung sdi 006400 Algorithm Investment Report
- 1. Performance Analysis of Algorithm (consolidated) 006400 Date Period 3 months 100-m won 2017.12 2018.12 2019.12 Average 2019.06 2019.09 2019.12 2020.03 2020.06 2020.09 IFRS(Con) IFRS(Con) IFRS(Con) IFRS(Con) IFRS(Con) IFRS(Con) IFRS(Con) IFRS(Con) IFRS(Con) IFRS(Con) IFRS(Con) Sales 63,466 91,583 100,974 85,341 24,045 25,679 28,209 23,975 25,338 28,168 25,477 O-profit 1,169 7,150 4,622 4,314 1,573 1,660 201 540 971 1,759 994 N-income 6,432 7,450 4,024 5,969 1,602 2,174 -331 7 383 1,672 863 O-rate 1.8 7.8 4.6 4.7 6.5 6.5 0.7 2.3 3.8 6.2 4.0 N-rate 10.1 8.1 4.0 7.4 6.7 8.5 -1.2 0.0 1.5 5.9 3.5 ROE 5.6 6.1 3.2 5.0 5.1 6.0 3.3 3.6 3.9 4.5 4.5 Debt-ratio 37.5 58.3 56.8 50.8 57.9 54.7 56.8 59.6 58.9 58.3 57.2 Quick-ratio 98.3 92.6 92.8 94.6 96.1 92.7 92.8 92.3 94.6 97.1 93.5 reserve-ratio 2,983.8 3,266.2 3,338.6 3,196.2 3,303.1 3,352.5 3,338.6 3,317.2 3,322.2 3,327.3 3,327.8 EPS 9,139 10,585 5,717 8,480 2,276 3,089 -470 10 495 2,480 1,226 BPS 162,711 173,697 179,879 172,096 177,846 181,233 179,879 177,094 178,634 180,188 179,013 Dividends 1,000 1,000 1,000 1,000 Major Financial Information Recent Annual Performance Recent quarterly performance Estimate Average 2020-08-17 Gap (Indication / stock) Color High price ~ -21 % High mid ~ -31 % Mid ~ -41 % Low mid ~ -50 % Low price ~ -60 % Normal 177,775 W 177,775 W 0 W Industrial name of the company The number of All industries Algorithm Industry ranking Total number of listed companies Algorithm company ranking Investment opinion Electrical products 79 33 3,119 655 306,767 W 306,767 W 263,770 W 263,770 W 263,770 W 220,772 W Evaluation 349,765 W 349,765 W~ 306,767 W 444,000 W 42.0220,772 W 220,772 W 177,775 W High price Indication price Range Current stock price Company score 177,775원 220,772원 263,770원 306,767원 349,765원 High price 444,000원 -60% -50% -41% -31% -21% -70% -60% -50% -40% -30% -20% -10% 0.% 0W 50,000W 100,000W 150,000W 200,000W 250,000W 300,000W 350,000W 400,000W 450,000W 500,000W Low price Low mid Mid High mid High price Indication price chart (Consolidated) Indication price samsung sdi Gap samsung sdi
- 2. [Price for scheduled purchasing] Arbitrarily made Algorithm stocks Trading Strategies (consolidated) 006400 Date Period Gap (Indication / stock) Color low price 177,775 W 177,775 W ~ 0 W -60 % 564,840 W 3 Low mid 220,772 W 220,772 W ~ 177,775 W -50 % 473,614 W 2 Mid 263,770 W 263,770 W ~ 220,772 W -41 % 382,387 W 1 High mid 306,767 W 306,767 W ~ 263,770 W -31 % 291,161 W 1 Suggested Purchase Amount 942,018 W Number of stocks purchased 2 Indication price Range Buying / Selling Buying / Selling [Stocks] High price 349,765 W 349,765 W~ ~ 306,767 W -21 % 199,935 W 1 2020-08-17 3 months Current stock price Evaluation Stock price rise probability score Investment opinion Prospective purchase amount 444,000 W High price 38.5 Normal 3,000,000 W 40.7 45.7 45.6 37.1 35.8 34.4 2020.03.23 2020.04.21 2020.05.22 2020.06.19 2020.07.17 2020.08.14 Stock price rise probability score A Sector 43.4 47.2 49.1 48.6 47.8 47.5 38.5B Sector 37.9 44.2 42.1 48.6 23.8 21.3 Total average 2020.05.22 2020.06.19 2020.07.17 2020.08.14 Total of increase rate Total score A Sector 8 % 4 % -1 % -2 % -1 % -4 % 44.0B Sector 14 % -5 % 13 % -105 % -12 % Total average 11 % -0 % -23 % -4 % -4 % 2020.04.21 43 47 49 49 48 47 38 44 42 49 24 21 41 46 46 37 36 34 0 10 20 30 40 50 60 2020.03.23 2020.04.21 2020.05.22 2020.06.19 2020.07.17 2020.08.14 Stock price rise probability score A sector B sector Total average 8% 4% -1% -2% -1% 14% -5% 13% -105% -12% 11% -0% -23% -4% -4% -120% -100% -80% -60% -40% -20% 0% 20% 40% 2020.04.21 2020.05.22 2020.06.19 2020.07.17 2020.08.14 Increase rate of stock price rise A sector B sector Total average samsung sdi
- 3. 정보와 완전 정보 결 투자판단 있습니 위배 무단으 숙지하 Compliance notice ① The information provided by The Algorithm Company Analysis Consulting is obtained through reliable data and information and The Algorithm Company Analysis Program (TACAP), but its accuracy or completeness are not guaranteed. Furthermore, it may change over time.Therefore, we are not legally responsible for the results of the data provided by The Algorithm Company Analysis Consulting because of information errors or omissions. ② The Algorithm Company Analysis Consulting and all the information provided on it site are reference materials for investment decisions and the final responsibility of investment is up to users utilizing this information. ③ The Algorithm Company Analysis Consulting and its site do not do anything that violates the related laws such as discretionary transaction. ④ Users can not reallocate and recycle the information provided by The Algorithm Company Analysis Consulting firm let alone the information provided by its Site. ⑤ Be sure to know about application period of this algorithm analysis report in order to improve its accuracy. Tel : 070 - 4667 - 5009 Email : tacac@tacac.co.kr Homepage : tacac.co.kr Blog : tacac.blog.me SERVICES M&A, IPO, RECOVER, CORPORATE RESTRUCTURING, MANAGEMENT OF TECHNOLOGY, BUSINESS STRATEGY, FAMILY BUSINESS Request : http://tacac.co.kr/?page_id=1374 ① Consulting is o The Algorithm accuracy or com change over tim results of the d Consulting bec ② information pr investment dec up ③ do anything th transaction. ④ The Algorithm information pr ⑤ analysis report