lg electronics 066570 Algorithm Investment Report
•
0 likes•95 views

lg electronics 066570 Algorithm Investment Report
![[Price for scheduled purchasing]
Arbitrarily made
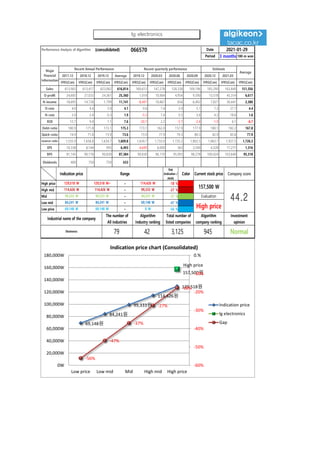
Algorithm stocks Trading Strategies (consolidated) 066570 Date
Period
Gap
(Indication /
stock)
Color
2021-01-29
3 months
Current stock price Evaluation
Stock price rise
probability score
Investment opinion Prospective purchase amount
157,500 W High price 52.2 Normal 3,500,000 W
Suggested Purchase
Amount 1,188,340 W
Number of stocks
purchased 8
Indication price Range Buying / Selling Buying / Selling [Stocks]
High price 129,518 W 129,518 W~ ~ 114,426 W -18 % 211,121 W 2
High mid 114,426 W 114,426 W ~ 99,333 W -27 % 324,994 W 3
Mid 99,333 W 99,333 W ~ 84,241 W -37 % 438,867 W 4
Low mid 84,241 W 84,241 W ~ 69,148 W -47 % 552,740 W 7
low price 69,148 W 69,148 W ~ 0 W -56 % 666,614 W 10
Stock price rise
probability score
A Sector 50.5 49.3 50.1 42.2 44.5 47.5
52.2
B Sector 36.3 20.8 33.8 42.2 44.2 31.3
Total average
2020.09.01 2020.09.29 2020.11.02 2020.11.30 2020.12.29 2021.01.28
43.4 35.1 41.9 43.3 44.3 39.4
2 % -13 %
2020.09.29 2020.11.02 2020.11.30 2020.12.29 2021.01.28
Total of
increase rate
Total score
A Sector -2 % 2 % -19 % 5 % 6 %
-3 % 45.0
B Sector -74 % 38 % 20 % 4 % -41 %
Total average -24 % 16 % 3 %
51 49 50
42 44
47
36
21
34
42 44
31
43
35
42 43 44
39
0
10
20
30
40
50
60
2020.09.01 2020.09.29 2020.11.02 2020.11.30 2020.12.29 2021.01.28
Stock price rise probability score
A sector
B sector
Total average
-2% 2%
-19%
5% 6%
-74%
38%
20%
4%
-41%
-24%
16%
3% 2%
-13%
-80%
-60%
-40%
-20%
0%
20%
40%
60%
2020.09.29 2020.11.02 2020.11.30 2020.12.29 2021.01.28
Increase rate of stock price rise
A sector
B sector
Total average
lg electronics](data:image/gif;base64,R0lGODlhAQABAIAAAAAAAP///yH5BAEAAAAALAAAAAABAAEAAAIBRAA7)
Recommended
Recommended
More Related Content
What's hot
What's hot (20)
Similar to lg electronics 066570 Algorithm Investment Report
Similar to lg electronics 066570 Algorithm Investment Report (20)
More from 알고리즘 기업분석 컨설팅-알기컨,algikeon
More from 알고리즘 기업분석 컨설팅-알기컨,algikeon (20)
Recently uploaded
Recently uploaded (20)
lg electronics 066570 Algorithm Investment Report
- 1. Performance Analysis of Algorithm (consolidated) 066570 Date Period 3 months 100-m won 2017.12 2018.12 2019.12 Average 2019.12 2020.03 2020.06 2020.09 2020.12 2021.03 IFRS(Con) IFRS(Con) IFRS(Con) IFRS(Con) IFRS(Con) IFRS(Con) IFRS(Con) IFRS(Con) IFRS(Con) IFRS(Con) IFRS(Con) Sales 613,963 613,417 623,062 616,814 160,612 147,278 128,338 169,196 185,290 163,840 151,356 O-profit 24,685 27,033 24,361 25,360 1,018 10,904 4,954 9,590 13,578 45,314 6,617 N-income 18,695 14,728 1,799 11,741 -8,497 10,867 656 6,492 7,827 30,441 2,380 O-rate 4.0 4.4 3.9 4.1 0.6 7.4 3.9 5.7 7.3 27.7 4.4 N-rate 3.0 2.4 0.3 1.9 -5.3 7.4 0.5 3.8 4.2 18.6 1.6 ROE 12.7 9.0 1.1 7.6 -20.7 2.2 -5.7 -2.4 -1.9 6.1 -6.7 Debt-ratio 180.9 171.8 173.1 175.3 173.1 162.0 157.9 177.9 180.1 182.2 167.8 Quick-ratio 74.9 71.8 73.9 73.6 73.9 77.9 79.3 80.3 82.9 85.6 77.9 reserve-ratio 1,535.9 1,658.8 1,634.7 1,609.8 1,634.7 1,733.0 1,735.2 1,802.5 1,863.7 1,927.5 1,726.3 EPS 10,338 8,144 995 6,493 -4,699 6,009 363 3,590 4,328 17,271 1,316 BPS 81,145 90,176 90,830 87,384 90,830 96,170 95,993 98,278 100,924 103,640 95,318 Dividends 400 750 750 633 2021-01-29 Major Financial Information Recent Annual Performance Recent quarterly performance Estimate Average Gap (Indication / stock) Color High price ~ -18 % High mid ~ -27 % Mid ~ -37 % Low mid ~ -47 % Low price ~ -56 % Indication price Range Current stock price Company score 114,426 W 114,426 W 99,333 W 99,333 W 99,333 W 84,241 W Evaluation 129,518 W 129,518 W~ 114,426 W 157,500 W 44.2 84,241 W 84,241 W 69,148 W High price Normal 69,148 W 69,148 W 0 W Industrial name of the company The number of All industries Algorithm Industry ranking Total number of listed companies Algorithm company ranking Investment opinion Electronics 79 42 3,125 945 69,148원 84,241원 99,333원 114,426원 129,518원 High price 157,500원 -56% -47% -37% -27% -18% -60% -50% -40% -30% -20% -10% 0.% 0W 20,000W 40,000W 60,000W 80,000W 100,000W 120,000W 140,000W 160,000W 180,000W Low price Low mid Mid High mid High price Indication price chart (Consolidated) Indication price lg electronics Gap lg electronics
- 2. [Price for scheduled purchasing] Arbitrarily made Algorithm stocks Trading Strategies (consolidated) 066570 Date Period Gap (Indication / stock) Color 2021-01-29 3 months Current stock price Evaluation Stock price rise probability score Investment opinion Prospective purchase amount 157,500 W High price 52.2 Normal 3,500,000 W Suggested Purchase Amount 1,188,340 W Number of stocks purchased 8 Indication price Range Buying / Selling Buying / Selling [Stocks] High price 129,518 W 129,518 W~ ~ 114,426 W -18 % 211,121 W 2 High mid 114,426 W 114,426 W ~ 99,333 W -27 % 324,994 W 3 Mid 99,333 W 99,333 W ~ 84,241 W -37 % 438,867 W 4 Low mid 84,241 W 84,241 W ~ 69,148 W -47 % 552,740 W 7 low price 69,148 W 69,148 W ~ 0 W -56 % 666,614 W 10 Stock price rise probability score A Sector 50.5 49.3 50.1 42.2 44.5 47.5 52.2 B Sector 36.3 20.8 33.8 42.2 44.2 31.3 Total average 2020.09.01 2020.09.29 2020.11.02 2020.11.30 2020.12.29 2021.01.28 43.4 35.1 41.9 43.3 44.3 39.4 2 % -13 % 2020.09.29 2020.11.02 2020.11.30 2020.12.29 2021.01.28 Total of increase rate Total score A Sector -2 % 2 % -19 % 5 % 6 % -3 % 45.0 B Sector -74 % 38 % 20 % 4 % -41 % Total average -24 % 16 % 3 % 51 49 50 42 44 47 36 21 34 42 44 31 43 35 42 43 44 39 0 10 20 30 40 50 60 2020.09.01 2020.09.29 2020.11.02 2020.11.30 2020.12.29 2021.01.28 Stock price rise probability score A sector B sector Total average -2% 2% -19% 5% 6% -74% 38% 20% 4% -41% -24% 16% 3% 2% -13% -80% -60% -40% -20% 0% 20% 40% 60% 2020.09.29 2020.11.02 2020.11.30 2020.12.29 2021.01.28 Increase rate of stock price rise A sector B sector Total average lg electronics
- 3. 정보와 완전 정보 결 투자판단 있습니 위배 무단으 숙지하 Compliance notice ① The information provided by The Algorithm Company Analysis Consulting is obtained through reliable data and information and The Algorithm Company Analysis Program (TACAP), but its accuracy or completeness are not guaranteed. Furthermore, it may change over time.Therefore, we are not legally responsible for the results of the data provided by The Algorithm Company Analysis Consulting because of information errors or omissions. ② The Algorithm Company Analysis Consulting and all the information provided on it site are reference materials for investment decisions and the final responsibility of investment is up to users utilizing this information. ③ The Algorithm Company Analysis Consulting and its site do not do anything that violates the related laws such as discretionary transaction. ④ Users can not reallocate and recycle the information provided by The Algorithm Company Analysis Consulting firm let alone the information provided by its Site. ⑤ Be sure to know about application period of this algorithm analysis report in order to improve its accuracy. Tel : 070 - 4667 - 5009 Email : tacac@tacac.co.kr Homepage : tacac.co.kr Blog : tacac.blog.me SERVICES M&A, IPO, RECOVER, CORPORATE RESTRUCTURING, MANAGEMENT OF TECHNOLOGY, BUSINESS STRATEGY, FAMILY BUSINESS Request : http://tacac.co.kr/?page_id=1374 ① Consulting is o The Algorithm accuracy or com change over tim results of the d Consulting bec ② information pr investment dec up ③ do anything th transaction. ④ The Algorithm information pr ⑤ analysis report