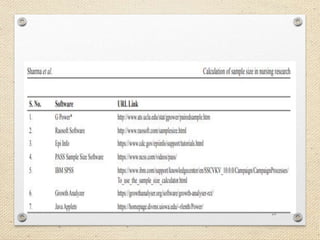
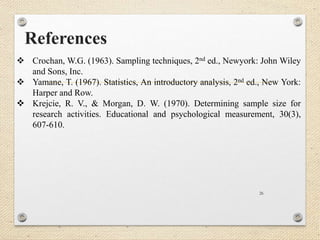
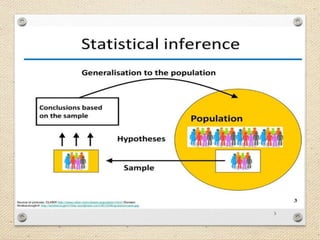
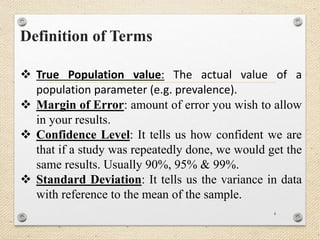
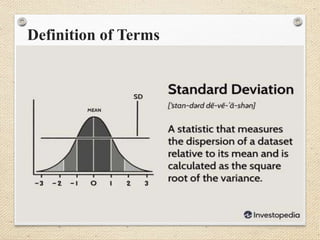
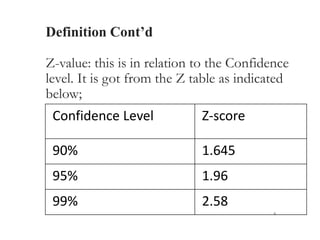
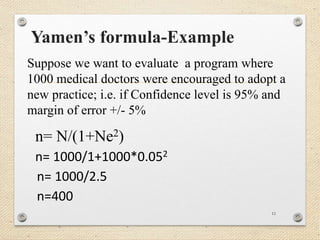
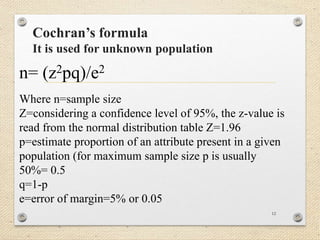
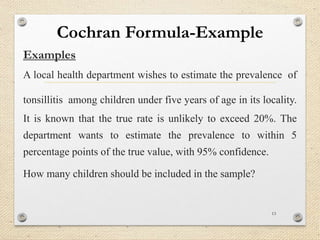
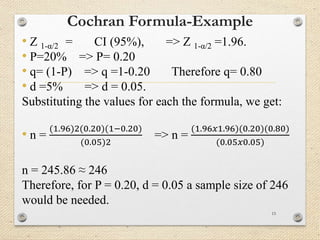
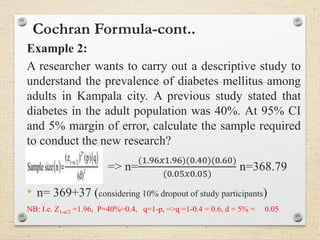
This document provides information on determining sample sizes for research studies. It defines key terms like population, sample size, margin of error, and confidence level. It presents different formulas for calculating sample sizes based on whether the population is known or unknown, such as Yamane's formula, Cochran's formula, and formulas for case-control and cohort study designs. Examples are provided to demonstrate how to use the formulas to determine required sample sizes for various study scenarios and levels of confidence. References for further information on sampling techniques are also included.


![Same Size Estimation for Cohort Studies
22
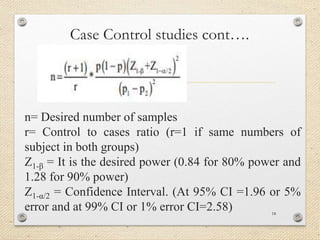
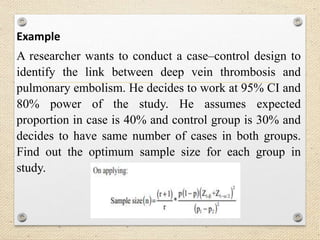
Sample Size estimation for a Cohort study
n =
[𝑍1
−
𝛼
/
2
√{
1+1
𝑚
𝑃 1−𝑃 }+𝑍1
−
𝛽√ {𝑃0∗
1−𝑃0
𝑚
𝑃1(1−𝑃1) ]2
(𝑃0−𝑃1)2
n = Total number of desired study subjects (cases)
m = Number of subjects (control)/experimental subject
Z 1-β = desired power (0.84 for 80% P & 1.28 for 90% P)
Z1-α/2 = Critical value for level of confidence. (At 95% CI
=1.96 and at 99% CI or 1% CI= 2.58)](https://image.slidesharecdn.com/1samplesizedetermination-230105130515-6f7d0a32/85/1_-Sample-size-determination-pptx-22-320.jpg)
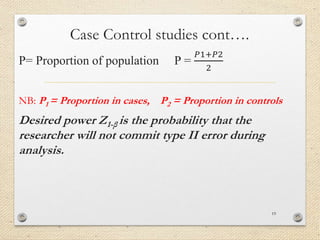
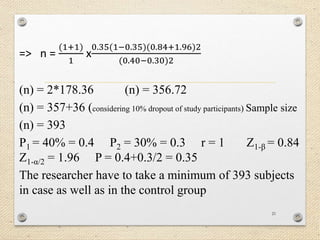
![n=
[1.96√{
1+1
1
0.25 1−0.25 }+0.84√ {0.2∗
1−0.2
1
0.3(1−0.3) ]2
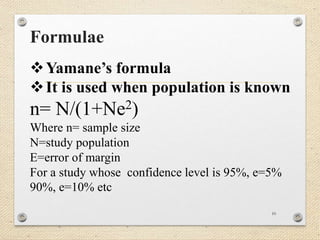
(0.2−0.3)2
n =
[1.96√{ 2 0.25 0.75 }+0.84√ {0.2∗ 0.8 0.3(0.7) ]2
(0.2−0.3)2
n =
[1.96𝑥0.612+0.84𝑥0.1833 ]2
(−0.1)2
n =
[1.19952+0.153972 ]2
(0.01)
n =
1.83194
(0.01)
(n) = 183.17
(n) = 183+18 = 201 (considering 10% dropout rate)](https://image.slidesharecdn.com/1samplesizedetermination-230105130515-6f7d0a32/85/1_-Sample-size-determination-pptx-24-320.jpg)