The document provides instructions for creating a value stream map during a Kaizen event to analyze and improve a process. The value stream map is built on a large paper by labeling stakeholders, timeframes, steps, decisions, and systems used. Opportunities for improvement are identified. Then the map is converted to a digital file and later transformed into a workflow diagram to create a user manual for training.
Digital Marketing Demystified: Expert Tips from Samantha Rae Coolbeth
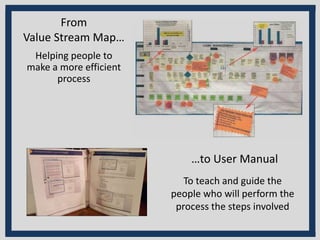
From Value Stream Map to User Manual
1. From
Value Stream Map…
…to User Manual
Helping people to
make a more efficient
process
To teach and guide the
people who will perform the
process the steps involved
2. During the Kaizen event, you will build a Value Stream Map
(VSM) for the process in question (Cash Management, here),
Take a long roll of paper and tape it to a wall of a large office or
conference room (see next slide)…
Build The Value Stream Map
3. On the VSM, you can label the rows down the left side with small
blue boxes (to denote Stakeholders) and place other boxes across
the top to mark timeframe (1st of month, 15th of month, etc.)…
Include Timeframe and Stakeholders
4. Place labels for the steps in the process (yellow Stickies for steps,
blue diamonds for decision). Having them flow through the rows
to show which steps are performed by which stakeholders and
line up with the top milestones (if any) to give a sense of timing
(i.e. 1st of month, 15th of month, of a process done monthly)…
Steps in the Process
5. Place labels for the IT systems (green stickies) that are used in
the process, along the bottom row, marked “Systems”. Have
them align, vertically, with the steps (yellow stickies) in the
process, to illustrate the role the systems play in the process.
Steps in the Process
6. If you feel charts and other visual aids will reveal waste and help
to devise metrics & KPI and, you can include them at this stage…
Include additional analysis, if needed
7. Engage the members of the Kaizen team to identify areas for improvement –
(orange stickies) sources of waste that can be eliminated. With proper analysis
(5 Whys) and prioritization, these opportunities will form the basis of the
process improvement projects that make up the overall Transformation.
Identify Waste, Improvement Opportunities…
8. Using a drafting program (in this case, MS Visio), copy all the
steps, decisions, systems, and Kaizen improvement bursts from
the original paper to a digital file. When done, it should look
like the chart below (note: the green “slices” attached to the
orange Kaizen bursts are “votes” – chosen by the process users
as those having the largest impact on the process.
Make Digital Value Stream Map from Paper
9. Once you’ve completed the projects that improve the process,
strip out the steps (yellow stickies) and build a “workflow”
diagram, staggering them in the order they take place. These
steps will become “chapters” in the user manual you will write for
training and consistency. Use a checklist (second row) to mark
your progress. Note the systems (green boxes) in the lower row.
Transform the VSM to a Workflow Diagram…