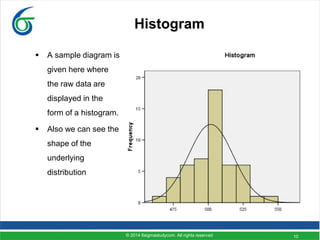
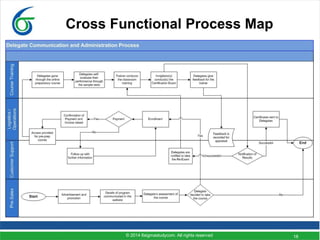
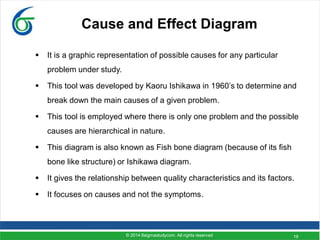
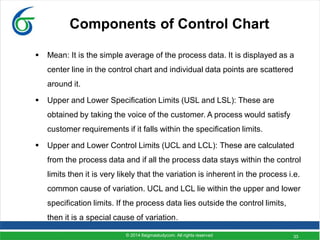
SlideShare a Scribd company logo
Six Sigma Yellow Belt – Part II
© 2014 6sigmastudycom. All rights reserved
© 2014 6sigmastudycom. All rights reserved 2
Six Sigma Yellow Belt – Part II
Index
 7 Basic Quality Tools
 Types of data
 DFSS
3
The 7 Basic Tools
 Check sheets
 Flow chart or Process map
 Histograms
 Cause and Effect diagram
 Pareto diagram
 Scatter diagram
 Control charts
© 2014 6sigmastudycom. All rights reserved
4
Types of Data
 Before we get into details of the 7 basic tools, let us familiarize with the
concept of data types.
 Data can be broadly categorized into two types: Continuous data and
Attribute (discrete) data.
 Continuous data is measurable by some physical instrument and the
value is continuous (i.e. it can be any number including decimals, need
not be only integers). Example: weight, height, length, density etc.
 Attribute data is countable and they can not be measured by any
physical instrument. They are also classified as good or bad, yes or No
etc. Example: Number of defects, defectives.
© 2014 6sigmastudycom. All rights reserved
5
Check sheets
 Check sheets are very important tool for data collection. Inputs gathered
from check sheets can be used for creation of Pareto diagrams,
Fishbone diagrams etc.
 The purpose of check sheets is to ease the compilation of the data in
such a manner that they may be used / analyzed comfortably.
 It is a simple and convenient recording technique for collecting and
determining the occurrence of events.
 It is constructed with each observation to give a clearer picture of the
facts.
© 2014 6sigmastudycom. All rights reserved
6
Creating Check sheets – steps involved
 Determine the objective by asking questions such as "What is the
problem?", "Why should data be collected?", "Who will use the
information being collected?", "Who will collect the data?“
 Decide the features/ characteristics and items are to be checked.
 Create a tabular form for collecting data. Traditionally the features/
characteristics, items, type of defects etc. are listed on the left side of
the check sheet.
 Collect the frequency of data for the items being measured. Record
each occurrence directly on the right side of the Check Sheet as it
happens.
© 2014 6sigmastudycom. All rights reserved
7
Creating Check sheets – steps involved
 Tally the data by totaling the number of occurrences for each category
being measured
Sample Check sheet
Defect Type Tally Total
Total
© 2014 6sigmastudycom. All rights reserved
8
Histogram
 It is a visual representation of variable data.
 It organizes data to describe process performance.
 It displays centering of the data and pattern of variation.
 It demonstrate the underlying distribution of the data. Histogram can be
used to check whether the data is Normally distributed or not.
 It provides valuable information for predicting future performance.
 It helps to identify whether the process is capable of meeting
requirements.
© 2014 6sigmastudycom. All rights reserved
9
Creating Histogram – steps involved
 Collect the variable data in a table.
 Ensure that all the measurements are in the same unit
 Arrange the data in ascending order such that the minimum and
maximum value can be identified
 Choose some suitable interval length of uniform size
 Use a check sheet to count the number of observations corresponding
to each interval
 The number of observations for a particular interval is said to be the
height of that interval and displayed as vertical bars.
© 2014 6sigmastudycom. All rights reserved
10
Histogram
 A sample diagram is
given here where
the raw data are
displayed in the
form of a histogram.
 Also we can see the
shape of the
underlying
distribution
© 2014 6sigmastudycom. All rights reserved
11
Study of Histogram
Important aspects to be considered when studying Histogram:
 Location of mean of the process
 Spread (variation) of the process
 Shape (pattern) of the process
© 2014 6sigmastudycom. All rights reserved
12
Flow chart/ Process Map
 It is a graphical representation of processes in an organization
displaying the sequence of tasks performed and their relationships.
 It is a prerequisite to obtain an in depth understanding of a process,
before application of quality management tools such as FMEA, SPC etc.
 Process maps are progressively elaborated: i.e. a high level process
map is defined early on in the six sigma project which shows major
processes and this will be made more explicit and detailed as project
team develops a better and more complete understanding of all the
processes.
 Standard symbols are used in creation of process maps.
© 2014 6sigmastudycom. All rights reserved
13
Benefits of Process Map
 Helps clarify several process steps and process flow which may not be
understood clearly before.
 Shows problem areas, unexpected complexity, redundancy, idle time,
unnecessary loops and where simplification may be incorporated.
 Visually shows the various alternatives possible and helps in selecting
an appropriate solution.
 Helps all members of the team gain appreciation for the work being
done by others in the team.
 Compares and contrasts actual versus the ideal flow of a process.
 Can be used as a training tool.
© 2014 6sigmastudycom. All rights reserved
14
Symbols used in Process Map
 Rectangle: represents a process step or action taken. Each process
step has one or more inputs, does some activity, and creates one or
more outputs.
 Diamond: represents a decision step i.e. different alternatives possible
depending on the input to this step.
 Oval: represents the start of stop of a process map, also used to depict
if the process map continues in another page.
 Arrow: represents the direction of flow in a process map.
© 2014 6sigmastudycom. All rights reserved
15
Creating Process Map – steps involved
 Put together a cross functional team who have knowledge of the
process and appropriate subject matter expertise to create the process
maps.
 Define the process and its boundaries, including the start and end
points.
 Describe the stages of the process in a sequential manner.
 Assess whether the stages are in correct sequence.
 Draw the process map using the conventional symbols
 Get it reviewed by the people involved in the process to check its
accuracy.
© 2014 6sigmastudycom. All rights reserved
16
“As-is” & “To-be” Process Map
 Try to find out existing process maps which may already be in existence
in the company.
 Map all the “As-is” high level processes i.e. processes as they exist now.
This will create an awareness within the team about the processes in
existence currently, and also let all team-members understand the
contribution from others. This is the “As-is” Process map.
 Ask the cross-functional team to study the process and identify
opportunities for improvement.
 Based on the inputs from cross functional team, map all the “To-be”
processes. This is the “To be” Process map.
© 2014 6sigmastudycom. All rights reserved
17
Cross Functional Process Map
 When more than one functions or departments of an organization are
involved in a process (which is very likely in general) then we need to
create cross functional process map instead of simple flow chart.
 It is the simple process map along with the various functions displayed
on the left side of the diagram.
 Sequence of tasks are mapped in such a way that they correspond to
the respective functions.
 It may be possible that some task(s) is performed by two functions.
Hence this activity to be displayed in such a manner that it falls in both
the functional zone. Lets take an example:
© 2014 6sigmastudycom. All rights reserved
18
Cross Functional Process Map
© 2014 6sigmastudycom. All rights reserved
19
Cause and Effect Diagram
 It is a graphic representation of possible causes for any particular
problem under study.
 This tool was developed by Kaoru Ishikawa in 1960’s to determine and
break down the main causes of a given problem.
 This tool is employed where there is only one problem and the possible
causes are hierarchical in nature.
 This diagram is also known as Fish bone diagram (because of its fish
bone like structure) or Ishikawa diagram.
 It gives the relationship between quality characteristics and its factors.
 It focuses on causes and not the symptoms.
© 2014 6sigmastudycom. All rights reserved
20
Cause and Effect Diagram
 Usually created by a group of people who have knowledge of the
process and understand the problems in the present system.
 It assist in helping to find the root causes of a problem and in generating
improvement ideas.
 It clarifies the understanding the team has regarding the process. If an
Ishikawa diagram does not show appropriate level of detail, it indicates
that the team has a superficial knowledge of the problem. Hence,
additional study of the system or involvement of Subject Matter Experts
is required.
© 2014 6sigmastudycom. All rights reserved
21
Cause and Effect Diagram – steps
involved
 The effect (a specific problem or a quality characteristics) is considered
to be the head, and the potential causes and sub-causes of the
problem, or quality characteristics to be the bone structure of the fish.
Hence write the key symptom or effect of the problem in a box to the
right-hand side.
 Draw a horizontal line from the left-hand side of the box.
 Identify the major categories for causes of the effect, which form the
main branches of the diagram.
© 2014 6sigmastudycom. All rights reserved
22
Cause and Effect Diagram – steps
involved
 Conventionally the main bone structure or branches are the 5Ms:
Machine, Manpower, Method, Materials, Maintenance (followed in
manufacturing industry) and the 4Ps: Policies, Procedure, people, Plant
(followed in non-manufacturing industry). The team may come out with
other relevant major categories according to the problem.
 Ensure that the team have a good knowledge of the process and
understand the problem under study.
 Conduct a brainstorming session with all the team members to generate
the possible causes of the problem.
© 2014 6sigmastudycom. All rights reserved
23
Cause and Effect Diagram – steps
involved
 Categorize the causes identified into groups and subgroups. A popular
way to do this is through using Affinity diagrams.
 Write the names of categories above and below the horizontal line. Start
with high level groups and expand each group (up to 3 or 4 levels).
Write down the detailed cause data for each category
Effect
Possible causes
© 2014 6sigmastudycom. All rights reserved
24
Pareto Analysis
 It is a ranked comparison of factors related to a quality problem.
 Pareto diagram displays the relative importance of problems is a simple
visual format.
 Since availability of money, time and other resources are restricted,
Pareto analysis helps the team to consider only vital few problematic
factors out of trivial many, which if addressed with due care, will bring
greatest rewards with minimum resources.
 Pareto diagram is based on the Pareto principle, also known as 80-20
rule, which states that a small number of causes (20%) is responsible
for a large percentage (80%) of the effect.
© 2014 6sigmastudycom. All rights reserved
25
Pareto Analysis
 The Pareto Diagram is named after Vilfredo Pareto, an economist from
Italy. Pareto studied distribution of wealth and found that the distribution
was not equal across the population. He found – majority of the wealth
is concentrated in relatively few.
 Pareto’s theory was popularized by Dr. Joseph M. Juran, who is
regarded as the father of quality control. It was Dr. Juran who called the
eighty-twenty ratio propounded by Pareto as the “Pareto principle”.
 Dr. Juran termed those few contributors which account for bulk of the
effect as ‘Vital few’.
 He termed other sources which do not contribute significantly to the
effect as ‘Trivial many’.
© 2014 6sigmastudycom. All rights reserved
26
Pareto Diagram – steps involved
 Put together a cross functional team who have knowledge of the
different opportunities or problems.
 Create different categories for the opportunities.
 Select a time interval for the analysis which is reasonable.
 Determine the total occurrences of events in each category.
 Rank the total occurrences in each category from maximum to
minimum.
 Compute the percentage for each category by dividing by the category
total and multiplying by 100.
 Create a graph of the opportunities – with the category names in the X
Axis and the % of opportunities in the Y Axis.
© 2014 6sigmastudycom. All rights reserved
27
Example: Pareto Diagram
0.0
10.0
20.0
30.0
40.0
50.0
60.0
70.0
80.0
90.0
100.0
0
20
40
60
80
100
120
140
160
180
200
Number of Complaints
Cumulative %
© 2014 6sigmastudycom. All rights reserved
28
Example: Pareto Diagram
 This is an example of a Pareto diagram of the complaints received in a
Hotel over a period of last three months. The Hotel management is
concerned about the increasing customer complaints.
 The horizontal axis represents various types of complaints and the
vertical axis displays the number of complaints in each category.
 The right-hand vertical axis displays the cumulative percentage of the
complaints. The blue curve represent this data.
 From this we can see that only the first four complaint category (Room
service, Housekeeping, Reservation, Food and Beverages) constitute
80% share of the total complaints. Hence these four areas need
immediate attention to improve the process performance.
© 2014 6sigmastudycom. All rights reserved
29
Scatter Diagram
 It is a graphical representation that depicts the possible relationship or
association between two variables, factors or characteristics.
 It provides both a visual and statistical means to test the strength of a
relationship.
Construction of a Scatter diagram:
 Collect the data on both variables, preferable sample size of 20 or more.
 Plot the data points on a XY plane where variable 1 is plotted along X
axis and variable 2 is plotted along Y axis.
 Identify the linear relationship between them if it exists.
 Identify the strength of the linear relationship as strong/ weak positive,
and strong/ weak negative.
© 2014 6sigmastudycom. All rights reserved
30
Example: Scatter Diagram
 From the above scatter diagram we can see that the factors X and Y are
having a negative liner relationship. Individual data points are plotted as
bullet points and the trend line indicates there is a linear relationship.
0
10
20
30
40
50
60
70
80
90
100
0 5 10 15 20 25 30 35 40 45
Y
X
© 2014 6sigmastudycom. All rights reserved
31
Control Chart
 It is a tool used in the control phase of the six sigma project.
 It distinguishes special from common causes of variation.
 Common causes of variation are natural in the process. They are small
in magnitude and difficult to identify / remove from the process.
 Special causes of variation occurs due to some special causes. They
are large in magnitude and easy to identify / remove from the process.
 There are three major components of a control chart: Upper Control
Limit (UCL), Lower Control Limit (LCL), and Center Line (Mean).
 Information required for a control chart is a count or measurement from
a process whenever an event occurs or at regular time intervals.
© 2014 6sigmastudycom. All rights reserved
32
Control Chart
Lets take a look at a sample control chart. Data obtained from the process
is plotted in a chart as shown below.
© 2014 6sigmastudycom. All rights reserved
33
Components of Control Chart
 Mean: It is the simple average of the process data. It is displayed as a
center line in the control chart and individual data points are scattered
around it.
 Upper and Lower Specification Limits (USL and LSL): These are
obtained by taking the voice of the customer. A process would satisfy
customer requirements if it falls within the specification limits.
 Upper and Lower Control Limits (UCL and LCL): These are calculated
from the process data and if all the process data stays within the control
limits then it is very likely that the variation is inherent in the process i.e.
common cause of variation. UCL and LCL lie within the upper and lower
specification limits. If the process data lies outside the control limits,
then it is a special cause of variation.
© 2014 6sigmastudycom. All rights reserved
34
DFSS
 Design for Six Sigma (DFSS) is an application of Six Sigma which
focuses on the design or redesign of the different processes used in
product manufacturing or service delivery by taking into account the
customer needs and expectations.
 DMADV is a common DFSS methodology used to develop a process or
product which does not exist in the company.
 DMADV is used when the existing product or process doesn't meet the
level of customer specification or six sigma level even after optimization
with or without using DMAIC.
 Companies using DFSS: GE, Motorola, Honeywell, etc.
© 2014 6sigmastudycom. All rights reserved
35
DFSS
DMADV (Define, Measure, Analyze, Design, and Validate)
 DEFINE the project goals and customer deliverables
 MEASURE the process to determine the current performance level
 ANALYZE and determine the root causes of the defects
 DESIGN the process in detail to meet customer needs
 VALIDATE the design performance and its ability to meet the customer
needs
© 2014 6sigmastudycom. All rights reserved
36
We have learned the following topics in this course:
 Evolution of Six Sigma
 What is Six Sigma?
 Goals of Six Sigma
 Six Sigma Approach
 Why do organizations adopt Six Sigma?
 Six Sigma –Mathematical Interpretation
 Roles in Six Sigma Organization
 Key Stakeholders
 DMAIC Methodology
 7 Basic Quality Tools
 Types of data
 DFSS
© 2014 6sigmastudycom. All rights reserved

More Related Content

Similar to Lean Six Sigma Yellow Belt Presentation Part 2.pdf

7QC Tools
7QC Tools7QC Tools
7QC Tools
Jitesh Gaurav
 
7 qc tools[1] to print
7 qc tools[1] to print7 qc tools[1] to print
7 qc tools[1] to print
Jitesh Gaurav
 
7 tools of quality
7 tools of quality7 tools of quality
7 tools of quality
Farah Amreen
 
7 QC Tools 7 Quality Tools Process Improvement Tools.pdf
7 QC Tools 7 Quality Tools Process Improvement Tools.pdf7 QC Tools 7 Quality Tools Process Improvement Tools.pdf
7 QC Tools 7 Quality Tools Process Improvement Tools.pdf
SRIKUMAR BIRADAR
 
old seven quality control tools
old seven quality control toolsold seven quality control tools
old seven quality control tools
Vivek Singh Chauhan
 
7 qc tools
7 qc tools7 qc tools
7 qc tools
Romelie Escano
 
ImportantSummary discussion of chapter not article or sectio.docx
ImportantSummary discussion of chapter not article or sectio.docxImportantSummary discussion of chapter not article or sectio.docx
ImportantSummary discussion of chapter not article or sectio.docx
bradburgess22840
 
Traditional Quality Tools.pptx
Traditional Quality Tools.pptxTraditional Quality Tools.pptx
Traditional Quality Tools.pptx
mayankdubey99
 
Quality software project management
Quality software project managementQuality software project management
Quality software project managementselinasimpson1601
 
K10765 Operation Planning Control
K10765 Operation Planning ControlK10765 Operation Planning Control
K10765 Operation Planning Control
Shraddhey Bhandari
 
Quality Tools
Quality ToolsQuality Tools
Quality Tools
Anand Subramaniam
 
Functions of quality management
Functions of quality managementFunctions of quality management
Functions of quality managementselinasimpson2901
 
Seven Statistical tools for Quality Management
Seven Statistical tools for Quality ManagementSeven Statistical tools for Quality Management
Seven Statistical tools for Quality Management
Shilpi Arora
 
Asian institute of quality management
Asian institute of quality managementAsian institute of quality management
Asian institute of quality managementselinasimpson1301
 
Six sigma tools an overview
Six sigma tools  an overviewSix sigma tools  an overview
Six sigma tools an overview
Komal Kamble
 
Quality management statement template
Quality management statement templateQuality management statement template
Quality management statement templateselinasimpson361
 
Seven Basic Tools of QC and their Applications
Seven Basic Tools of QC and their ApplicationsSeven Basic Tools of QC and their Applications
Seven Basic Tools of QC and their Applications
DrJayantaKumarMahato1
 
Six sigma fast track course
Six sigma fast track courseSix sigma fast track course
Six sigma fast track course
Muhammad Asim
 

Similar to Lean Six Sigma Yellow Belt Presentation Part 2.pdf (20)

7QC Tools
7QC Tools7QC Tools
7QC Tools
 
7 qc tools[1] to print
7 qc tools[1] to print7 qc tools[1] to print
7 qc tools[1] to print
 
7 tools of quality
7 tools of quality7 tools of quality
7 tools of quality
 
7 QC Tools 7 Quality Tools Process Improvement Tools.pdf
7 QC Tools 7 Quality Tools Process Improvement Tools.pdf7 QC Tools 7 Quality Tools Process Improvement Tools.pdf
7 QC Tools 7 Quality Tools Process Improvement Tools.pdf
 
old seven quality control tools
old seven quality control toolsold seven quality control tools
old seven quality control tools
 
7 qc tools
7 qc tools7 qc tools
7 qc tools
 
ImportantSummary discussion of chapter not article or sectio.docx
ImportantSummary discussion of chapter not article or sectio.docxImportantSummary discussion of chapter not article or sectio.docx
ImportantSummary discussion of chapter not article or sectio.docx
 
Traditional Quality Tools.pptx
Traditional Quality Tools.pptxTraditional Quality Tools.pptx
Traditional Quality Tools.pptx
 
Quality software project management
Quality software project managementQuality software project management
Quality software project management
 
K10765 Opc
K10765 OpcK10765 Opc
K10765 Opc
 
K10765 Operation Planning Control
K10765 Operation Planning ControlK10765 Operation Planning Control
K10765 Operation Planning Control
 
Quality Tools
Quality ToolsQuality Tools
Quality Tools
 
Functions of quality management
Functions of quality managementFunctions of quality management
Functions of quality management
 
Seven Statistical tools for Quality Management
Seven Statistical tools for Quality ManagementSeven Statistical tools for Quality Management
Seven Statistical tools for Quality Management
 
Quality management books
Quality management booksQuality management books
Quality management books
 
Asian institute of quality management
Asian institute of quality managementAsian institute of quality management
Asian institute of quality management
 
Six sigma tools an overview
Six sigma tools  an overviewSix sigma tools  an overview
Six sigma tools an overview
 
Quality management statement template
Quality management statement templateQuality management statement template
Quality management statement template
 
Seven Basic Tools of QC and their Applications
Seven Basic Tools of QC and their ApplicationsSeven Basic Tools of QC and their Applications
Seven Basic Tools of QC and their Applications
 
Six sigma fast track course
Six sigma fast track courseSix sigma fast track course
Six sigma fast track course
 

Recently uploaded

Evgen Osmak: Methods of key project parameters estimation: from the shaman-in...
Evgen Osmak: Methods of key project parameters estimation: from the shaman-in...Evgen Osmak: Methods of key project parameters estimation: from the shaman-in...
Evgen Osmak: Methods of key project parameters estimation: from the shaman-in...
Lviv Startup Club
 
ikea_woodgreen_petscharity_dog-alogue_digital.pdf
ikea_woodgreen_petscharity_dog-alogue_digital.pdfikea_woodgreen_petscharity_dog-alogue_digital.pdf
ikea_woodgreen_petscharity_dog-alogue_digital.pdf
agatadrynko
 
VAT Registration Outlined In UAE: Benefits and Requirements
VAT Registration Outlined In UAE: Benefits and RequirementsVAT Registration Outlined In UAE: Benefits and Requirements
VAT Registration Outlined In UAE: Benefits and Requirements
uae taxgpt
 
5 Things You Need To Know Before Hiring a Videographer
5 Things You Need To Know Before Hiring a Videographer5 Things You Need To Know Before Hiring a Videographer
5 Things You Need To Know Before Hiring a Videographer
ofm712785
 
Project File Report BBA 6th semester.pdf
Project File Report BBA 6th semester.pdfProject File Report BBA 6th semester.pdf
Project File Report BBA 6th semester.pdf
RajPriye
 
RMD24 | Retail media: hoe zet je dit in als je geen AH of Unilever bent? Heid...
RMD24 | Retail media: hoe zet je dit in als je geen AH of Unilever bent? Heid...RMD24 | Retail media: hoe zet je dit in als je geen AH of Unilever bent? Heid...
RMD24 | Retail media: hoe zet je dit in als je geen AH of Unilever bent? Heid...
BBPMedia1
 
amptalk_RecruitingDeck_english_2024.06.05
amptalk_RecruitingDeck_english_2024.06.05amptalk_RecruitingDeck_english_2024.06.05
amptalk_RecruitingDeck_english_2024.06.05
marketing317746
 
Bài tập - Tiếng anh 11 Global Success UNIT 1 - Bản HS.doc
Bài tập - Tiếng anh 11 Global Success UNIT 1 - Bản HS.docBài tập - Tiếng anh 11 Global Success UNIT 1 - Bản HS.doc
Bài tập - Tiếng anh 11 Global Success UNIT 1 - Bản HS.doc
daothibichhang1
 
Cracking the Workplace Discipline Code Main.pptx
Cracking the Workplace Discipline Code Main.pptxCracking the Workplace Discipline Code Main.pptx
Cracking the Workplace Discipline Code Main.pptx
Workforce Group
 
3.0 Project 2_ Developing My Brand Identity Kit.pptx
3.0 Project 2_ Developing My Brand Identity Kit.pptx3.0 Project 2_ Developing My Brand Identity Kit.pptx
3.0 Project 2_ Developing My Brand Identity Kit.pptx
tanyjahb
 
Introduction to Amazon company 111111111111
Introduction to Amazon company 111111111111Introduction to Amazon company 111111111111
Introduction to Amazon company 111111111111
zoyaansari11365
 
Premium MEAN Stack Development Solutions for Modern Businesses
Premium MEAN Stack Development Solutions for Modern BusinessesPremium MEAN Stack Development Solutions for Modern Businesses
Premium MEAN Stack Development Solutions for Modern Businesses
SynapseIndia
 
Improving profitability for small business
Improving profitability for small businessImproving profitability for small business
Improving profitability for small business
Ben Wann
 
Sustainability: Balancing the Environment, Equity & Economy
Sustainability: Balancing the Environment, Equity & EconomySustainability: Balancing the Environment, Equity & Economy
Sustainability: Balancing the Environment, Equity & Economy
Operational Excellence Consulting
 
LA HUG - Video Testimonials with Chynna Morgan - June 2024
LA HUG - Video Testimonials with Chynna Morgan - June 2024LA HUG - Video Testimonials with Chynna Morgan - June 2024
LA HUG - Video Testimonials with Chynna Morgan - June 2024
Lital Barkan
 
Search Disrupted Google’s Leaked Documents Rock the SEO World.pdf
Search Disrupted Google’s Leaked Documents Rock the SEO World.pdfSearch Disrupted Google’s Leaked Documents Rock the SEO World.pdf
Search Disrupted Google’s Leaked Documents Rock the SEO World.pdf
Arihant Webtech Pvt. Ltd
 
-- June 2024 is National Volunteer Month --
-- June 2024 is National Volunteer Month ---- June 2024 is National Volunteer Month --
-- June 2024 is National Volunteer Month --
NZSG
 
Business Valuation Principles for Entrepreneurs
Business Valuation Principles for EntrepreneursBusiness Valuation Principles for Entrepreneurs
Business Valuation Principles for Entrepreneurs
Ben Wann
 
What is the TDS Return Filing Due Date for FY 2024-25.pdf
What is the TDS Return Filing Due Date for FY 2024-25.pdfWhat is the TDS Return Filing Due Date for FY 2024-25.pdf
What is the TDS Return Filing Due Date for FY 2024-25.pdf
seoforlegalpillers
 
一比一原版加拿大渥太华大学毕业证(uottawa毕业证书)如何办理
一比一原版加拿大渥太华大学毕业证(uottawa毕业证书)如何办理一比一原版加拿大渥太华大学毕业证(uottawa毕业证书)如何办理
一比一原版加拿大渥太华大学毕业证(uottawa毕业证书)如何办理
taqyed
 

Recently uploaded (20)

Evgen Osmak: Methods of key project parameters estimation: from the shaman-in...
Evgen Osmak: Methods of key project parameters estimation: from the shaman-in...Evgen Osmak: Methods of key project parameters estimation: from the shaman-in...
Evgen Osmak: Methods of key project parameters estimation: from the shaman-in...
 
ikea_woodgreen_petscharity_dog-alogue_digital.pdf
ikea_woodgreen_petscharity_dog-alogue_digital.pdfikea_woodgreen_petscharity_dog-alogue_digital.pdf
ikea_woodgreen_petscharity_dog-alogue_digital.pdf
 
VAT Registration Outlined In UAE: Benefits and Requirements
VAT Registration Outlined In UAE: Benefits and RequirementsVAT Registration Outlined In UAE: Benefits and Requirements
VAT Registration Outlined In UAE: Benefits and Requirements
 
5 Things You Need To Know Before Hiring a Videographer
5 Things You Need To Know Before Hiring a Videographer5 Things You Need To Know Before Hiring a Videographer
5 Things You Need To Know Before Hiring a Videographer
 
Project File Report BBA 6th semester.pdf
Project File Report BBA 6th semester.pdfProject File Report BBA 6th semester.pdf
Project File Report BBA 6th semester.pdf
 
RMD24 | Retail media: hoe zet je dit in als je geen AH of Unilever bent? Heid...
RMD24 | Retail media: hoe zet je dit in als je geen AH of Unilever bent? Heid...RMD24 | Retail media: hoe zet je dit in als je geen AH of Unilever bent? Heid...
RMD24 | Retail media: hoe zet je dit in als je geen AH of Unilever bent? Heid...
 
amptalk_RecruitingDeck_english_2024.06.05
amptalk_RecruitingDeck_english_2024.06.05amptalk_RecruitingDeck_english_2024.06.05
amptalk_RecruitingDeck_english_2024.06.05
 
Bài tập - Tiếng anh 11 Global Success UNIT 1 - Bản HS.doc
Bài tập - Tiếng anh 11 Global Success UNIT 1 - Bản HS.docBài tập - Tiếng anh 11 Global Success UNIT 1 - Bản HS.doc
Bài tập - Tiếng anh 11 Global Success UNIT 1 - Bản HS.doc
 
Cracking the Workplace Discipline Code Main.pptx
Cracking the Workplace Discipline Code Main.pptxCracking the Workplace Discipline Code Main.pptx
Cracking the Workplace Discipline Code Main.pptx
 
3.0 Project 2_ Developing My Brand Identity Kit.pptx
3.0 Project 2_ Developing My Brand Identity Kit.pptx3.0 Project 2_ Developing My Brand Identity Kit.pptx
3.0 Project 2_ Developing My Brand Identity Kit.pptx
 
Introduction to Amazon company 111111111111
Introduction to Amazon company 111111111111Introduction to Amazon company 111111111111
Introduction to Amazon company 111111111111
 
Premium MEAN Stack Development Solutions for Modern Businesses
Premium MEAN Stack Development Solutions for Modern BusinessesPremium MEAN Stack Development Solutions for Modern Businesses
Premium MEAN Stack Development Solutions for Modern Businesses
 
Improving profitability for small business
Improving profitability for small businessImproving profitability for small business
Improving profitability for small business
 
Sustainability: Balancing the Environment, Equity & Economy
Sustainability: Balancing the Environment, Equity & EconomySustainability: Balancing the Environment, Equity & Economy
Sustainability: Balancing the Environment, Equity & Economy
 
LA HUG - Video Testimonials with Chynna Morgan - June 2024
LA HUG - Video Testimonials with Chynna Morgan - June 2024LA HUG - Video Testimonials with Chynna Morgan - June 2024
LA HUG - Video Testimonials with Chynna Morgan - June 2024
 
Search Disrupted Google’s Leaked Documents Rock the SEO World.pdf
Search Disrupted Google’s Leaked Documents Rock the SEO World.pdfSearch Disrupted Google’s Leaked Documents Rock the SEO World.pdf
Search Disrupted Google’s Leaked Documents Rock the SEO World.pdf
 
-- June 2024 is National Volunteer Month --
-- June 2024 is National Volunteer Month ---- June 2024 is National Volunteer Month --
-- June 2024 is National Volunteer Month --
 
Business Valuation Principles for Entrepreneurs
Business Valuation Principles for EntrepreneursBusiness Valuation Principles for Entrepreneurs
Business Valuation Principles for Entrepreneurs
 
What is the TDS Return Filing Due Date for FY 2024-25.pdf
What is the TDS Return Filing Due Date for FY 2024-25.pdfWhat is the TDS Return Filing Due Date for FY 2024-25.pdf
What is the TDS Return Filing Due Date for FY 2024-25.pdf
 
一比一原版加拿大渥太华大学毕业证(uottawa毕业证书)如何办理
一比一原版加拿大渥太华大学毕业证(uottawa毕业证书)如何办理一比一原版加拿大渥太华大学毕业证(uottawa毕业证书)如何办理
一比一原版加拿大渥太华大学毕业证(uottawa毕业证书)如何办理
 

Lean Six Sigma Yellow Belt Presentation Part 2.pdf

  • 1. Six Sigma Yellow Belt – Part II © 2014 6sigmastudycom. All rights reserved
  • 2. © 2014 6sigmastudycom. All rights reserved 2 Six Sigma Yellow Belt – Part II Index  7 Basic Quality Tools  Types of data  DFSS
  • 3. 3 The 7 Basic Tools  Check sheets  Flow chart or Process map  Histograms  Cause and Effect diagram  Pareto diagram  Scatter diagram  Control charts © 2014 6sigmastudycom. All rights reserved
  • 4. 4 Types of Data  Before we get into details of the 7 basic tools, let us familiarize with the concept of data types.  Data can be broadly categorized into two types: Continuous data and Attribute (discrete) data.  Continuous data is measurable by some physical instrument and the value is continuous (i.e. it can be any number including decimals, need not be only integers). Example: weight, height, length, density etc.  Attribute data is countable and they can not be measured by any physical instrument. They are also classified as good or bad, yes or No etc. Example: Number of defects, defectives. © 2014 6sigmastudycom. All rights reserved
  • 5. 5 Check sheets  Check sheets are very important tool for data collection. Inputs gathered from check sheets can be used for creation of Pareto diagrams, Fishbone diagrams etc.  The purpose of check sheets is to ease the compilation of the data in such a manner that they may be used / analyzed comfortably.  It is a simple and convenient recording technique for collecting and determining the occurrence of events.  It is constructed with each observation to give a clearer picture of the facts. © 2014 6sigmastudycom. All rights reserved
  • 6. 6 Creating Check sheets – steps involved  Determine the objective by asking questions such as "What is the problem?", "Why should data be collected?", "Who will use the information being collected?", "Who will collect the data?“  Decide the features/ characteristics and items are to be checked.  Create a tabular form for collecting data. Traditionally the features/ characteristics, items, type of defects etc. are listed on the left side of the check sheet.  Collect the frequency of data for the items being measured. Record each occurrence directly on the right side of the Check Sheet as it happens. © 2014 6sigmastudycom. All rights reserved
  • 7. 7 Creating Check sheets – steps involved  Tally the data by totaling the number of occurrences for each category being measured Sample Check sheet Defect Type Tally Total Total © 2014 6sigmastudycom. All rights reserved
  • 8. 8 Histogram  It is a visual representation of variable data.  It organizes data to describe process performance.  It displays centering of the data and pattern of variation.  It demonstrate the underlying distribution of the data. Histogram can be used to check whether the data is Normally distributed or not.  It provides valuable information for predicting future performance.  It helps to identify whether the process is capable of meeting requirements. © 2014 6sigmastudycom. All rights reserved
  • 9. 9 Creating Histogram – steps involved  Collect the variable data in a table.  Ensure that all the measurements are in the same unit  Arrange the data in ascending order such that the minimum and maximum value can be identified  Choose some suitable interval length of uniform size  Use a check sheet to count the number of observations corresponding to each interval  The number of observations for a particular interval is said to be the height of that interval and displayed as vertical bars. © 2014 6sigmastudycom. All rights reserved
  • 10. 10 Histogram  A sample diagram is given here where the raw data are displayed in the form of a histogram.  Also we can see the shape of the underlying distribution © 2014 6sigmastudycom. All rights reserved
  • 11. 11 Study of Histogram Important aspects to be considered when studying Histogram:  Location of mean of the process  Spread (variation) of the process  Shape (pattern) of the process © 2014 6sigmastudycom. All rights reserved
  • 12. 12 Flow chart/ Process Map  It is a graphical representation of processes in an organization displaying the sequence of tasks performed and their relationships.  It is a prerequisite to obtain an in depth understanding of a process, before application of quality management tools such as FMEA, SPC etc.  Process maps are progressively elaborated: i.e. a high level process map is defined early on in the six sigma project which shows major processes and this will be made more explicit and detailed as project team develops a better and more complete understanding of all the processes.  Standard symbols are used in creation of process maps. © 2014 6sigmastudycom. All rights reserved
  • 13. 13 Benefits of Process Map  Helps clarify several process steps and process flow which may not be understood clearly before.  Shows problem areas, unexpected complexity, redundancy, idle time, unnecessary loops and where simplification may be incorporated.  Visually shows the various alternatives possible and helps in selecting an appropriate solution.  Helps all members of the team gain appreciation for the work being done by others in the team.  Compares and contrasts actual versus the ideal flow of a process.  Can be used as a training tool. © 2014 6sigmastudycom. All rights reserved
  • 14. 14 Symbols used in Process Map  Rectangle: represents a process step or action taken. Each process step has one or more inputs, does some activity, and creates one or more outputs.  Diamond: represents a decision step i.e. different alternatives possible depending on the input to this step.  Oval: represents the start of stop of a process map, also used to depict if the process map continues in another page.  Arrow: represents the direction of flow in a process map. © 2014 6sigmastudycom. All rights reserved
  • 15. 15 Creating Process Map – steps involved  Put together a cross functional team who have knowledge of the process and appropriate subject matter expertise to create the process maps.  Define the process and its boundaries, including the start and end points.  Describe the stages of the process in a sequential manner.  Assess whether the stages are in correct sequence.  Draw the process map using the conventional symbols  Get it reviewed by the people involved in the process to check its accuracy. © 2014 6sigmastudycom. All rights reserved
  • 16. 16 “As-is” & “To-be” Process Map  Try to find out existing process maps which may already be in existence in the company.  Map all the “As-is” high level processes i.e. processes as they exist now. This will create an awareness within the team about the processes in existence currently, and also let all team-members understand the contribution from others. This is the “As-is” Process map.  Ask the cross-functional team to study the process and identify opportunities for improvement.  Based on the inputs from cross functional team, map all the “To-be” processes. This is the “To be” Process map. © 2014 6sigmastudycom. All rights reserved
  • 17. 17 Cross Functional Process Map  When more than one functions or departments of an organization are involved in a process (which is very likely in general) then we need to create cross functional process map instead of simple flow chart.  It is the simple process map along with the various functions displayed on the left side of the diagram.  Sequence of tasks are mapped in such a way that they correspond to the respective functions.  It may be possible that some task(s) is performed by two functions. Hence this activity to be displayed in such a manner that it falls in both the functional zone. Lets take an example: © 2014 6sigmastudycom. All rights reserved
  • 18. 18 Cross Functional Process Map © 2014 6sigmastudycom. All rights reserved
  • 19. 19 Cause and Effect Diagram  It is a graphic representation of possible causes for any particular problem under study.  This tool was developed by Kaoru Ishikawa in 1960’s to determine and break down the main causes of a given problem.  This tool is employed where there is only one problem and the possible causes are hierarchical in nature.  This diagram is also known as Fish bone diagram (because of its fish bone like structure) or Ishikawa diagram.  It gives the relationship between quality characteristics and its factors.  It focuses on causes and not the symptoms. © 2014 6sigmastudycom. All rights reserved
  • 20. 20 Cause and Effect Diagram  Usually created by a group of people who have knowledge of the process and understand the problems in the present system.  It assist in helping to find the root causes of a problem and in generating improvement ideas.  It clarifies the understanding the team has regarding the process. If an Ishikawa diagram does not show appropriate level of detail, it indicates that the team has a superficial knowledge of the problem. Hence, additional study of the system or involvement of Subject Matter Experts is required. © 2014 6sigmastudycom. All rights reserved
  • 21. 21 Cause and Effect Diagram – steps involved  The effect (a specific problem or a quality characteristics) is considered to be the head, and the potential causes and sub-causes of the problem, or quality characteristics to be the bone structure of the fish. Hence write the key symptom or effect of the problem in a box to the right-hand side.  Draw a horizontal line from the left-hand side of the box.  Identify the major categories for causes of the effect, which form the main branches of the diagram. © 2014 6sigmastudycom. All rights reserved
  • 22. 22 Cause and Effect Diagram – steps involved  Conventionally the main bone structure or branches are the 5Ms: Machine, Manpower, Method, Materials, Maintenance (followed in manufacturing industry) and the 4Ps: Policies, Procedure, people, Plant (followed in non-manufacturing industry). The team may come out with other relevant major categories according to the problem.  Ensure that the team have a good knowledge of the process and understand the problem under study.  Conduct a brainstorming session with all the team members to generate the possible causes of the problem. © 2014 6sigmastudycom. All rights reserved
  • 23. 23 Cause and Effect Diagram – steps involved  Categorize the causes identified into groups and subgroups. A popular way to do this is through using Affinity diagrams.  Write the names of categories above and below the horizontal line. Start with high level groups and expand each group (up to 3 or 4 levels). Write down the detailed cause data for each category Effect Possible causes © 2014 6sigmastudycom. All rights reserved
  • 24. 24 Pareto Analysis  It is a ranked comparison of factors related to a quality problem.  Pareto diagram displays the relative importance of problems is a simple visual format.  Since availability of money, time and other resources are restricted, Pareto analysis helps the team to consider only vital few problematic factors out of trivial many, which if addressed with due care, will bring greatest rewards with minimum resources.  Pareto diagram is based on the Pareto principle, also known as 80-20 rule, which states that a small number of causes (20%) is responsible for a large percentage (80%) of the effect. © 2014 6sigmastudycom. All rights reserved
  • 25. 25 Pareto Analysis  The Pareto Diagram is named after Vilfredo Pareto, an economist from Italy. Pareto studied distribution of wealth and found that the distribution was not equal across the population. He found – majority of the wealth is concentrated in relatively few.  Pareto’s theory was popularized by Dr. Joseph M. Juran, who is regarded as the father of quality control. It was Dr. Juran who called the eighty-twenty ratio propounded by Pareto as the “Pareto principle”.  Dr. Juran termed those few contributors which account for bulk of the effect as ‘Vital few’.  He termed other sources which do not contribute significantly to the effect as ‘Trivial many’. © 2014 6sigmastudycom. All rights reserved
  • 26. 26 Pareto Diagram – steps involved  Put together a cross functional team who have knowledge of the different opportunities or problems.  Create different categories for the opportunities.  Select a time interval for the analysis which is reasonable.  Determine the total occurrences of events in each category.  Rank the total occurrences in each category from maximum to minimum.  Compute the percentage for each category by dividing by the category total and multiplying by 100.  Create a graph of the opportunities – with the category names in the X Axis and the % of opportunities in the Y Axis. © 2014 6sigmastudycom. All rights reserved
  • 28. 28 Example: Pareto Diagram  This is an example of a Pareto diagram of the complaints received in a Hotel over a period of last three months. The Hotel management is concerned about the increasing customer complaints.  The horizontal axis represents various types of complaints and the vertical axis displays the number of complaints in each category.  The right-hand vertical axis displays the cumulative percentage of the complaints. The blue curve represent this data.  From this we can see that only the first four complaint category (Room service, Housekeeping, Reservation, Food and Beverages) constitute 80% share of the total complaints. Hence these four areas need immediate attention to improve the process performance. © 2014 6sigmastudycom. All rights reserved
  • 29. 29 Scatter Diagram  It is a graphical representation that depicts the possible relationship or association between two variables, factors or characteristics.  It provides both a visual and statistical means to test the strength of a relationship. Construction of a Scatter diagram:  Collect the data on both variables, preferable sample size of 20 or more.  Plot the data points on a XY plane where variable 1 is plotted along X axis and variable 2 is plotted along Y axis.  Identify the linear relationship between them if it exists.  Identify the strength of the linear relationship as strong/ weak positive, and strong/ weak negative. © 2014 6sigmastudycom. All rights reserved
  • 30. 30 Example: Scatter Diagram  From the above scatter diagram we can see that the factors X and Y are having a negative liner relationship. Individual data points are plotted as bullet points and the trend line indicates there is a linear relationship. 0 10 20 30 40 50 60 70 80 90 100 0 5 10 15 20 25 30 35 40 45 Y X © 2014 6sigmastudycom. All rights reserved
  • 31. 31 Control Chart  It is a tool used in the control phase of the six sigma project.  It distinguishes special from common causes of variation.  Common causes of variation are natural in the process. They are small in magnitude and difficult to identify / remove from the process.  Special causes of variation occurs due to some special causes. They are large in magnitude and easy to identify / remove from the process.  There are three major components of a control chart: Upper Control Limit (UCL), Lower Control Limit (LCL), and Center Line (Mean).  Information required for a control chart is a count or measurement from a process whenever an event occurs or at regular time intervals. © 2014 6sigmastudycom. All rights reserved
  • 32. 32 Control Chart Lets take a look at a sample control chart. Data obtained from the process is plotted in a chart as shown below. © 2014 6sigmastudycom. All rights reserved
  • 33. 33 Components of Control Chart  Mean: It is the simple average of the process data. It is displayed as a center line in the control chart and individual data points are scattered around it.  Upper and Lower Specification Limits (USL and LSL): These are obtained by taking the voice of the customer. A process would satisfy customer requirements if it falls within the specification limits.  Upper and Lower Control Limits (UCL and LCL): These are calculated from the process data and if all the process data stays within the control limits then it is very likely that the variation is inherent in the process i.e. common cause of variation. UCL and LCL lie within the upper and lower specification limits. If the process data lies outside the control limits, then it is a special cause of variation. © 2014 6sigmastudycom. All rights reserved
  • 34. 34 DFSS  Design for Six Sigma (DFSS) is an application of Six Sigma which focuses on the design or redesign of the different processes used in product manufacturing or service delivery by taking into account the customer needs and expectations.  DMADV is a common DFSS methodology used to develop a process or product which does not exist in the company.  DMADV is used when the existing product or process doesn't meet the level of customer specification or six sigma level even after optimization with or without using DMAIC.  Companies using DFSS: GE, Motorola, Honeywell, etc. © 2014 6sigmastudycom. All rights reserved
  • 35. 35 DFSS DMADV (Define, Measure, Analyze, Design, and Validate)  DEFINE the project goals and customer deliverables  MEASURE the process to determine the current performance level  ANALYZE and determine the root causes of the defects  DESIGN the process in detail to meet customer needs  VALIDATE the design performance and its ability to meet the customer needs © 2014 6sigmastudycom. All rights reserved
  • 36. 36 We have learned the following topics in this course:  Evolution of Six Sigma  What is Six Sigma?  Goals of Six Sigma  Six Sigma Approach  Why do organizations adopt Six Sigma?  Six Sigma –Mathematical Interpretation  Roles in Six Sigma Organization  Key Stakeholders  DMAIC Methodology  7 Basic Quality Tools  Types of data  DFSS © 2014 6sigmastudycom. All rights reserved