This paper takes Quercus mongolica as an example,
In order to determine the position of insects inside the
Quercus mongolica seed. The seeds of Quercus mongolica
were cut at a certain thickness to obtain an internal crosssectional image of the seeds. In this paper, Canny and Hough
algorithm are used to perform edge detection and line
detection on unprocessed images, and determine the
coordinate origin of the study area so that all study areas are
in the same coordinate range. In order to obtain the position
information of the insect path, based on the RGB principle,
this paper designs a screening algorithm for the pixel points in
the study area, and obtains the position information of the
insect track. In order to observe the insect path more
intuitively, this paper establishes a three-dimensional data
model, and uses MATLAB to draw a three-dimensional
structure diagram of the position information of the insect
path, and shields the interference items such as seed germ to
obtain a more accurate movement track of the insect.
POST TRANSCRIPTIONAL GENE SILENCING-AN INTRODUCTION.pptx
Reconstruction of Inner Worm Passage of Quercus Mongolica Seeds
1. International Journal of Engineering and Management Research e-ISSN: 2250-0758 | p-ISSN: 2394-6962
Volume- 9, Issue- 5 (October 2019)
www.ijemr.net https://doi.org/10.31033/ijemr.9.5.1
1 This work is licensed under Creative Commons Attribution 4.0 International License.
Reconstruction of Inner Worm Passage of Quercus Mongolica Seeds
He Zhang
Student, Department of Chemistry Technology, Yanbian University, CHINA
Corresponding Author: 850455757@qq.com
ABSTRACT
This paper takes Quercus mongolica as an example,
In order to determine the position of insects inside the
Quercus mongolica seed. The seeds of Quercus mongolica
were cut at a certain thickness to obtain an internal cross-
sectional image of the seeds. In this paper, Canny and Hough
algorithm are used to perform edge detection and line
detection on unprocessed images, and determine the
coordinate origin of the study area so that all study areas are
in the same coordinate range. In order to obtain the position
information of the insect path, based on the RGB principle,
this paper designs a screening algorithm for the pixel points in
the study area, and obtains the position information of the
insect track. In order to observe the insect path more
intuitively, this paper establishes a three-dimensional data
model, and uses MATLAB to draw a three-dimensional
structure diagram of the position information of the insect
path, and shields the interference items such as seed germ to
obtain a more accurate movement track of the insect.
Keywords— Quercus Mongolica, Canny Edge Detection,
Hough Line Detection, RGB Screening Algorithm, Image
Segmentation Model, Worm
I. INTRODUCTION
In recent years, due to the destruction of the forest
ecological environment, the Quercus mongolica forest pests
are more serious, affecting the natural regeneration process
of the Quercus mongolica forest. In this paper, we find a
rationalization solution for the Mongolian forest pests and
establish a model of the position information of the insects
inside the seeds. The Quercus mongolica seed was cut at a
thickness of 0.1 mm to obtain an internal cross-sectional
image of the seed. For coordinate unification and distance
measurement, reduce the computational trouble, give the
marked points A and B, and the actual distance measured
between the two points of AB should be 20 mm. Involving
the batch processing problem of photos, it is difficult to
carry out detailed research in the case of device jitter and
area acquisition too large, so it is necessary to batch cut and
position the image size and position so that all research
areas are in the same Within a coordinate range. It is
necessary to establish a suitable model, determine the two
sides of the study area, and then determine the coordinate
origin of the study area. According to the coordinate origin,
select the appropriate study area, and then batch-cut the
study area of all images. On the basis of the above, the
program is written by MATLAB software, according to the
actual distance of points A and B, the image is divided into
200×200, so that each picture is divided into 40,000 pixel
blocks, and a suitable model is established to perform the
pixel block. Screen to determine the location of the worm.
The MATLAB program is written to establish a 3D model
of the insect tract, and the interference factor is judged by
observing the 3D model of the wormhole, thereby shielding
and optimizing.
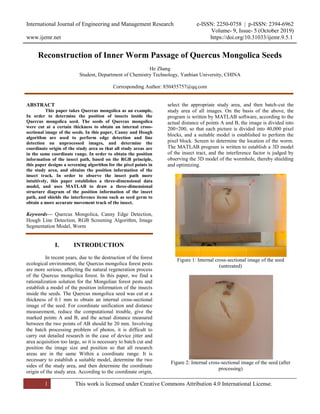
Figure 1: Internal cross-sectional image of the seed
(untreated)
Figure 2: Internal cross-sectional image of the seed (after
processing)
2. International Journal of Engineering and Management Research e-ISSN: 2250-0758 | p-ISSN: 2394-6962
Volume- 9, Issue- 5 (October 2019)
www.ijemr.net https://doi.org/10.31033/ijemr.9.5.1
2 This work is licensed under Creative Commons Attribution 4.0 International License.
II. MODEL ESTABLISHMENT AND
SOLUTION
2.1.1 Model 1 Establishment
First, the image is processed for observation. The
rgb2gray function is used to grayscale the image, so that the
edge of the image research area is more obvious, and then
the appropriate algorithm is used for edge detection. Here
we use the Canny algorithm.
In order to minimize the effect of noise on the
edge detection results, noise must be filtered out to prevent
false detection caused by noise. To smooth the image, a
Gaussian filter is used to convolve with the image, which
smoothes the image to reduce the apparent noise effects on
the edge detector. The generating equation for a Gaussian
filter kernel of size (2k+1) * (2k+1) is given by:
2
22
2
σ2
))1(-))1(
exp
Πσ2
1 kjki
H ij
((
1≤i,j≤(2k+1) (1)
The edges in the image can point in all directions,
so the Canny algorithm uses four operators to detect
horizontal, vertical, and diagonal edges in the image. The
edge detection operator returns the first derivative value in
the horizontal Gx and vertical Gy directions, thereby
determining the gradient G and the direction θ of the pixel.
22
YX GGG
, (2)
X
y
G
G
arctanθ
(3)
Where G is the gradient strength, θ is the gradient
direction, and arctan is the inverse tangent function
Then use Hough algorithm to determine the upper
line: The basic principle of Hough transform is to use the
duality of points and lines to change the given curve of the
original image space into a point of the parameter space
through the curve expression. This translates the detection
problem of a given curve in the original image into a peak
problem in finding the parameter space. That is, the
detection of the overall characteristics is converted into the
detection of local characteristics. Using the Hough function
to detect the upper line and the left line of the study area to
determine the coordinates of A. By taking the point of
Figure 1, we obtain the pixel distance between AB, and
finally use the coordinates of point A and the distance of
AB. Batch cropping images.
2.1.2 Solution of Model 1
By using the Canny algorithm and constantly
adjusting the threshold, we obtained an area of significant
edge research, as shown in Figure 3:
Figure 3: Canny edge detection map
Figure 4: Hough line detection
The Hough line detection is used to obtain the
boundary line between the upper side and the left side of
the study area, as shown in Figure 4, thereby determining
the coordinates of point A.
Through the taking point of Figure 3, we get the
distance between the marked points A and B as 800 pixels,
and then use the Imcrop function to cut:
pic_1 = imcrop(image,[x,y,799,799])
The cropped image we got is shown in Figure 1
and Figure 2.
2.2.1 Model 2 Establishment
To determine the position information of the worm
tract in the study area, it is necessary to have obvious
differences. By observing, we find that the color
characteristics of the worm tract are different from other
positions, so we use RGB to build a model to screen the
wormPixel position.
Take a representative picture of the difference
between the color characteristics of the insect and non-
insect position. Use Photoshop software to RGB the insect
and non-insect parts, and get the RGB range and non-insect
path of the insect position. The RGB range, then use
MATLAB to write the program, judge, obtain the position
information of the pixel points in line with the RGB range
of the insect channel and store it.
However, after calculation, the pixels in the study
area are high. If each pixel is filtered by the above program,
3. International Journal of Engineering and Management Research e-ISSN: 2250-0758 | p-ISSN: 2394-6962
Volume- 9, Issue- 5 (October 2019)
www.ijemr.net https://doi.org/10.31033/ijemr.9.5.1
3 This work is licensed under Creative Commons Attribution 4.0 International License.
the amount of data is too large and the operation time is too
long. Therefore, we need to reduce the resolution of the
study area.
On the basis of the first question (the study area is
800*800 pixels resolution, and the actual distance of AB
point is 20 mm), and the thickness is 0.1 mm, we will make
each picture 200*200. Splitting, each picture is divided into
40,000 pixel small blocks, each small block has a resolution
of 4*4 pixels, which indirectly reduces the research area to
a resolution of 200*200.
Next, we just need to determine which small
blocks of pixels are on the insect track and record the
position information of these small pieces of pixels. Since
each pixel has 16 pixels, and considering that some small
pixels are at the junction of the insect and the non-insect,
we determine that if more than half of the pixels of a pixel
are RGB in the worm Within the RGB range of the
location, we consider the pixel block to be in the insect
track and record the location information of the pixel block.
2.2.2 Solution of Model 2
We use Photoshop to color the RGB of ten images.
Since the lower the value of RGB, the darker the color, we
only need to take the highest value of RGB position (Table
1) and The lowest value of the position of the insect (Table
2) the data obtained is as follows:
TABLE I
序号 1 2 3 4 5
R 145 142 139 135 138
G 104 96 93 105 115
B 75 79 68 74 78
序号 6 7 8 9 10
R 134 139 136 135 133
G 108 114 119 113 113
B 73 76 74 74 79
TABLE II
序号 1 2 3 4 5
R 143 142 141 146 168
G 74 80 96 110 125
B 90 86 67 85 74
序号 6 7 8 9 10
R 140 151 148 153 160
G 131 128 136 140 137
B 85 87 79 98 85
Since the color of the germ position is darker and
the RGB values are lower, we use the integrity of the
position information of the RGB values. Therefore, the
value of the upper limit of the RGB value determined by us
is relatively high. Finally, when optimizing, the part of the
germ is removed. location information. In summary, the
value range of R is determined to be R<140, the range of G
is G<120, and the range of B is B<80.
Divide the study area into 40,000 pixel blocks and
store them in the cell array, and then extract the R, G, and B
values of the elements in the cell array. Determine the R, G,
and B values and store the matching locations. The location
information of the pixel block.
Then merge them in the form of an array, construct
a two-dimensional array K, and then give the z-axis
information that meets the conditional small block, and add
it to K to make it into a three-dimensional array, and put
each loop the obtained K is saved in F and stored in the file.
After optimizing it, it is stored in the file. We get the data
about the position information of the insect path to indicate
the position of the insect path.
2.3.1 Model 3 Establishment
According to the data obtained by Model 2, we
draw the data in a three-dimensional image, and can
intuitively obtain the three-dimensional structure of the
insect track. However, because the value of RGB in
question 2 is slightly higher, there may be position
information of the germ. And the emergence of other
interference information.
By visually observing the 3D structure diagram,
we use MATLAB to write programs to remove germ
position information and other interference information for
optimization.
2.3.2 Solution of Model 3
The initial data obtained by the model 2 is
subjected to 3D composition, with A as the coordinate
origin and AB as the y-axis, and the following figure is
obtained:
Figure 5: 3D structure of the wormhole
By observing we can find the interference of germ
position information, the interference of glass border and
seed boundary and the interference of individual discrete
points; remove the interference of glass frame and seed
4. International Journal of Engineering and Management Research e-ISSN: 2250-0758 | p-ISSN: 2394-6962
Volume- 9, Issue- 5 (October 2019)
www.ijemr.net https://doi.org/10.31033/ijemr.9.5.1
4 This work is licensed under Creative Commons Attribution 4.0 International License.
germ by using find function; then remove the individual
points of the image the position information of the germ. So
we got the optimized information on the position of the
insect and stored it in the file, as well as the final 3D
structure of the insect (A is the coordinate origin and AB is
the y axis).
Figure 6: Location information obtained after RGB
optimization
III. CONCLUSION
The Canny and Hough algorithms can accurately
determine the coordinate origin of the study area. The RGB
design screening algorithm accurately identifies the pictures
with large color differences, which greatly reduces the
complexity of the optimization program and facilitates
further research. The established image segmentation model
reduces the amount of data processing, optimizes the
computational efficiency of the RGB filtering algorithm,
reduces the program running time, and increases the
practicability of the program. This paper adopts a more
reasonable method to describe the position information of
insects, which can reflect the harm of insects to seeds with
more comprehensive information. Using it to simulate the
algorithm, it has a certain method to resist the pests, which
helps people to innovate the resistance to forest pests.
REFERENCES
[1] Yan Gou. (2008). Principle of gray color correction in
digital photo color processing. Journal of Chengdu
University, 5, 121-123.
[2] Lulu Tang, Qican Zhang, & Song Hu. (2011). An
adaptive threshold canny edge detection algorithm. Opto-
Electronic Engineering, 38(5), 127-132.
[3] Baoding Fu, Jianchang Yuan, & Caixia Guo. (2005).
Cotton impurity recognition algorithm based on RGB color
model. Beijing Textile Journal, 26(5), 48-51.
[4] Huairen Yan & Musheng Yang. (2015). Line extraction
algorithm based on improved hough transform. Infrared
Technology, 37(11), 970-975.
![International Journal of Engineering and Management Research e-ISSN: 2250-0758 | p-ISSN: 2394-6962
Volume- 9, Issue- 5 (October 2019)
www.ijemr.net https://doi.org/10.31033/ijemr.9.5.1
2 This work is licensed under Creative Commons Attribution 4.0 International License.
II. MODEL ESTABLISHMENT AND
SOLUTION
2.1.1 Model 1 Establishment
First, the image is processed for observation. The
rgb2gray function is used to grayscale the image, so that the
edge of the image research area is more obvious, and then
the appropriate algorithm is used for edge detection. Here
we use the Canny algorithm.
In order to minimize the effect of noise on the
edge detection results, noise must be filtered out to prevent
false detection caused by noise. To smooth the image, a
Gaussian filter is used to convolve with the image, which
smoothes the image to reduce the apparent noise effects on
the edge detector. The generating equation for a Gaussian
filter kernel of size (2k+1) * (2k+1) is given by:
2
22
2
σ2
))1(-))1(
exp
Πσ2
1 kjki
H ij
((
1≤i,j≤(2k+1) (1)
The edges in the image can point in all directions,
so the Canny algorithm uses four operators to detect
horizontal, vertical, and diagonal edges in the image. The
edge detection operator returns the first derivative value in
the horizontal Gx and vertical Gy directions, thereby
determining the gradient G and the direction θ of the pixel.
22
YX GGG
, (2)
X
y
G
G
arctanθ
(3)
Where G is the gradient strength, θ is the gradient
direction, and arctan is the inverse tangent function
Then use Hough algorithm to determine the upper
line: The basic principle of Hough transform is to use the
duality of points and lines to change the given curve of the
original image space into a point of the parameter space
through the curve expression. This translates the detection
problem of a given curve in the original image into a peak
problem in finding the parameter space. That is, the
detection of the overall characteristics is converted into the
detection of local characteristics. Using the Hough function
to detect the upper line and the left line of the study area to
determine the coordinates of A. By taking the point of
Figure 1, we obtain the pixel distance between AB, and
finally use the coordinates of point A and the distance of
AB. Batch cropping images.
2.1.2 Solution of Model 1
By using the Canny algorithm and constantly
adjusting the threshold, we obtained an area of significant
edge research, as shown in Figure 3:
Figure 3: Canny edge detection map
Figure 4: Hough line detection
The Hough line detection is used to obtain the
boundary line between the upper side and the left side of
the study area, as shown in Figure 4, thereby determining
the coordinates of point A.
Through the taking point of Figure 3, we get the
distance between the marked points A and B as 800 pixels,
and then use the Imcrop function to cut:
pic_1 = imcrop(image,[x,y,799,799])
The cropped image we got is shown in Figure 1
and Figure 2.
2.2.1 Model 2 Establishment
To determine the position information of the worm
tract in the study area, it is necessary to have obvious
differences. By observing, we find that the color
characteristics of the worm tract are different from other
positions, so we use RGB to build a model to screen the
wormPixel position.
Take a representative picture of the difference
between the color characteristics of the insect and non-
insect position. Use Photoshop software to RGB the insect
and non-insect parts, and get the RGB range and non-insect
path of the insect position. The RGB range, then use
MATLAB to write the program, judge, obtain the position
information of the pixel points in line with the RGB range
of the insect channel and store it.
However, after calculation, the pixels in the study
area are high. If each pixel is filtered by the above program,](data:image/gif;base64,R0lGODlhAQABAIAAAAAAAP///yH5BAEAAAAALAAAAAABAAEAAAIBRAA7)