
Recommended
More Related Content
What's hot
What's hot (20)
Similar to Nifty Options OI Change Highlights
Similar to Nifty Options OI Change Highlights (20)
Recently uploaded
Recently uploaded (20)
Nifty Options OI Change Highlights
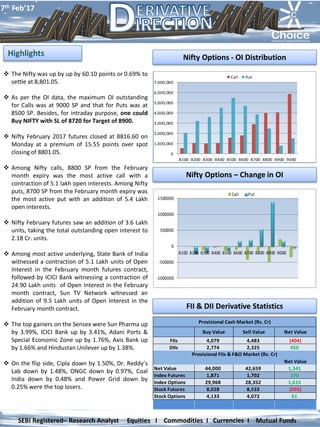
- 1. Nifty Options - OI Distribution The Nifty was up by up by 60.10 points or 0.69% to settle at 8,801.05. As per the OI data, the maximum OI outstanding for Calls was at 9000 SP and that for Puts was at 8500 SP. Besides, for intraday purpose, one could Buy NIFTY with SL of 8720 for Target of 8900. Nifty February 2017 futures closed at 8816.60 on Monday at a premium of 15.55 points over spot closing of 8801.05. Among Nifty calls, 8800 SP from the February month expiry was the most active call with a contraction of 5.1 lakh open interests. Among Nifty puts, 8700 SP from the February month expiry was the most active put with an addition of 5.4 Lakh open interests. Nifty February futures saw an addition of 3.6 Lakh units, taking the total outstanding open interest to 2.18 Cr. units. Among most active underlying, State Bank of India witnessed a contraction of 5.1 Lakh units of Open Interest in the February month futures contract, followed by ICICI Bank witnessing a contraction of 24.90 Lakh units of Open Interest in the February month contract, Sun TV Network witnessed an addition of 9.5 Lakh units of Open Interest in the February month contract. The top gainers on the Sensex were Sun Pharma up by 3.99%, ICICI Bank up by 3.41%, Adani Ports & Special Economic Zone up by 1.76%, Axis Bank up by 1.66% and Hindustan Unilever up by 1.38%. On the flip side, Cipla down by 1.50%, Dr. Reddy’s Lab down by 1.48%, ONGC down by 0.97%, Coal India down by 0.48% and Power Grid down by 0.25% were the top losers. Nifty Options – Change in OI Highlights FII & DII Derivative Statistics 7th Feb’17 SEBI Registered– Research Analyst Equities I Commodities I Currencies I Mutual Funds 0 1,000,000 2,000,000 3,000,000 4,000,000 5,000,000 6,000,000 7,000,000 8100 8200 8300 8400 8500 8600 8700 8800 8900 9000 Call Put Buy Value Sell Value Net Value FIIs 4,079 4,483 (404) DIIs 2,774 2,325 450 Net Value Net Value 44,000 42,659 1,341 Index Futures 1,871 1,702 170 Index Options 29,968 28,352 1,615 Stock Futures 8,028 8,533 (505) Stock Options 4,133 4,072 61 Provisional FIIs & F&O Market (Rs. Cr) Provisional Cash Market (Rs. Cr) -1000000 -500000 0 500000 1000000 1500000 8100 8200 8300 8400 8500 8600 8700 8800 8900 9000 Call Put
- 2. Derivative Strategy Pay- Off Chart The India Volatility Index increased by 2.05% and reached 13.39. The Nifty Put Call Ratio (PCR) finally stood at 1.19 for February month contract. The top five scrips with highest PCR on OI were Sun TV Network (2.15), Oracle Financial Services Software (2.00), Bharti Airtel (1.34), ITC (1.19) and IDEA (1.18). India VIX v/s Nifty Chart 7th Feb’17 SEBI Registered– Research Analyst Equities I Commodities I Currencies I Mutual Funds Short Covering Symbol Close Price Chng % OI Chng % Buy Above BAJFINANCE 1075.40 2.32 -7.31 1088.77 JPASSOCIAT 13.85 5.73 -7.14 14.31 OIL 336.80 0.39 -5.98 338.35 GLENMARK 960.30 0.87 -5.73 969.81 Short Built Up Symbol Close Price Chng % OI Chng % Sell Below TORNTPHARM 1279.80 -2.35 20.35 1259.61 COLPAL 896.75 -0.90 16.49 887.51 AMARAJABAT 895.15 -1.78 12.68 884.38 RCOM 36.1 -1.77 8.95 35.39 Long Liquidation Symbol Close Price Chng % OI Chng % Sell Below ORIENTBANK 125.25 -3.80 -22.90 122.12 TECHM 476.60 -0.59 -7.59 470.03 CENTURYTEX 903.10 -1.24 -6.00 892.96 KSCL 474.40 -0.64 -5.44 469.53 Long Built Up Symbol Close Price Chng % OI Chng % Buy Above IGL 1004.40 3.32 22.44 1020.94 JUBLFOOD 1010.25 10.15 21.49 1065.22 BATAINDIA 511.65 3.19 16.90 517.76 LUPIN 1502.45 0.24 15.74 1535.84 DIVISLAB Covered Call
- 3. Contact Us Kkunal Parar Sr. Research Associate kkunal.parar@choiceindia.com Vikas Chaudhari Research Associate vikas.chaudhari@choiceindia.com www.choiceindia.comcustomercare@choiceindia.com Disclaimer This is solely for information of clients of Choice Broking and does not construe to be an investment advice. It is also not intended as an offer or solicitation for the purchase and sale of any financial instruments. Any action taken by you on the basis of the information contained herein is your responsibility alone and Choice Broking its subsidiaries or its employees or associates will not be liable in any manner for the consequences of such action taken by you. We have exercised due diligence in checking the correctness and authenticity of the information contained in this recommendation, but Choice Broking or any of its subsidiaries or associates or employees shall not be in any way responsible for any loss or damage that may arise to any person from any inadvertent error in the information contained in this recommendation or any action taken on basis of this information. Technical analysis studies market psychology, price patterns and volume levels. It is used to forecast future price and market movements. Technical analysis is complementary to fundamental analysis and news sources. The recommendations issued herewith might be contrary to recommendations issued by Choice Broking in the company research undertaken as the recommendations stated in this report is derived purely from technical analysis. Choice Broking has based this document on information obtained from sources it believes to be reliable but which it has not independently verified; Choice Broking makes no guarantee, representation or warranty and accepts no responsibility or liability as to its accuracy or completeness. The opinions contained within the report are based upon publicly available information at the time of publication and are subject to change without notice. The information and any disclosures provided herein are in summary form and have been prepared for informational purposes. The recommendations and suggested price levels are intended purely for trading purposes. The recommendations are valid for the day of the report however trading trends and volumes might vary substantially on an intraday basis and the recommendations may be subject to change. The information and any disclosures provided herein may be considered confidential. Any use, distribution, modification, copying, forwarding or disclosure by any person is strictly prohibited. The information and any disclosures provided herein do not constitute a solicitation or offer to purchase or sell any security or other financial product or instrument. The current performance may be unaudited. Past performance does not guarantee future returns. There can be no assurance that investments will achieve any targeted rates of return, and there is no guarantee against the loss of your entire investment. POTENTIAL CONFLICT OF INTEREST DISCLOSURE (as on date of report) Disclosure of interest statement – • Analyst interest of the stock /Instrument(s): - No. • Firm interest of the stock / Instrument (s): - No. Kapil Shah Research Associate kapil.shah@choiceindia.com Amit Pathania Research Associate amit.pathania@choiceindia.com 7th Feb’17 SEBI Registered– Research Analyst Equities I Commodities I Currencies I Mutual Funds Kkunal Parar Digitally signed by Kkunal Parar DN: cn=Kkunal Parar, o=Choice Equity Broking Pvt Ltd., ou=Research Dept., email=kkunal.parar@choiceindia.com, c=IN Date: 2017.02.07 09:01:44 +05'30'