More Related Content
Similar to Corinth TX - Housing Market Report - November 2010
Similar to Corinth TX - Housing Market Report - November 2010 (13)
More from Valarie Littles
More from Valarie Littles (20)
Corinth TX - Housing Market Report - November 2010
- 1. Valarie Littles Ultima Real Estate
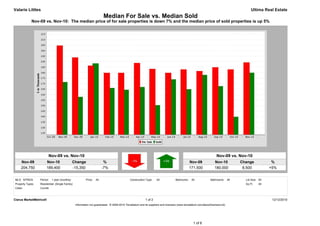
Median For Sale vs. Median Sold
Nov-09 vs. Nov-10: The median price of for sale properties is down 7% and the median price of sold properties is up 5%
Nov-09 vs. Nov-10 Nov-09 vs. Nov-10
Nov-09 Nov-10 Change % Nov-09 Nov-10 Change %
204,750 189,400 -15,350 -7% 171,500 180,000 8,500 +5%
MLS: NTREIS Period: 1 year (monthly) Price: All Construction Type: All Bedrooms: All Bathrooms: All Lot Size: All
Property Types: Residential: (Single Family) Sq Ft: All
Cities: Corinth
Clarus MarketMetrics® 1 of 2 12/12/2010
Information not guaranteed. © 2009-2010 Terradatum and its suppliers and licensors (www.terradatum.com/about/licensors.td).
1 of 6
- 2. Valarie Littles Ultima Real Estate
Median For Sale vs. Median Sold
Nov-09 vs. Nov-10: The median price of for sale properties is down 7% and the median price of sold properties is up 5%
For Sale # Properties Sold # Properties Price
Time Period Median For Sale Median Sold Difference
Nov-10 189,400 186 180,000 21 -9,400
Oct-10 183,000 189 139,900 13 -43,100
Sep-10 184,900 203 167,800 27 -17,100
Aug-10 181,500 208 178,000 22 -3,500
Jul-10 183,000 207 165,000 27 -18,000
Jun-10 179,900 209 174,000 37 -5,900
May-10 183,450 208 150,500 32 -32,950
Apr-10 188,900 200 167,000 41 -21,900
Mar-10 179,900 197 164,500 24 -15,400
Feb-10 179,900 178 166,125 18 -13,775
Jan-10 186,500 168 188,500 14 2,000
Dec-09 193,900 161 158,000 25 -35,900
Nov-09 204,750 170 171,500 44 -33,250
Clarus MarketMetrics® 2 of 2 12/12/2010
Information not guaranteed. © 2009-2010 Terradatum and its suppliers and licensors (www.terradatum.com/about/licensors.td).
2 of 6
- 3. Valarie Littles Ultima Real Estate
Supply & Demand by Month
Nov-09 vs. Nov-10: The number of for sale properties is up 9% and the number of sold properties is down 52%
Nov-09 vs. Nov-10 Nov-09 vs. Nov-10
Nov-09 Nov-10 Change % Nov-09 Nov-10 Change %
170 186 16 +9% 44 21 -23 -52%
MLS: NTREIS Period: 1 year (monthly) Price: All Construction Type: All Bedrooms: All Bathrooms: All Lot Size: All
Property Types: Residential: (Single Family) Sq Ft: All
Cities: Corinth
Clarus MarketMetrics® 1 of 2 12/12/2010
Information not guaranteed. © 2009-2010 Terradatum and its suppliers and licensors (www.terradatum.com/about/licensors.td).
3 of 6
- 4. Valarie Littles Ultima Real Estate
Supply & Demand by Month
Nov-09 vs. Nov-10: The number of for sale properties is up 9% and the number of sold properties is down 52%
# Properties Average DOM # Properties Average DOM
Time Period For Sale For Sale Sold Sold
Nov-10 186 122 21 67
Oct-10 189 135 13 72
Sep-10 203 146 27 91
Aug-10 208 155 22 72
Jul-10 207 155 27 45
Jun-10 209 154 37 79
May-10 208 159 32 51
Apr-10 200 162 41 72
Mar-10 197 163 24 73
Feb-10 178 171 18 78
Jan-10 168 179 14 64
Dec-09 161 191 25 58
Nov-09 170 196 44 51
Clarus MarketMetrics® 2 of 2 12/12/2010
Information not guaranteed. © 2009-2010 Terradatum and its suppliers and licensors (www.terradatum.com/about/licensors.td).
4 of 6
- 5. Valarie Littles Ultima Real Estate
Months Supply of Inventory
Nov-09 vs. Nov-10: The average months supply of inventory is up 105%
Nov-09 vs. Nov-10
Nov-09 Nov-10 Change %
5.6 11.5 5.9 +105%
MLS: NTREIS Period: 1 year (monthly) Price: All Construction Type: All Bedrooms: All Bathrooms: All Lot Size: All
Property Types: Residential: (Single Family) Sq Ft: All
Cities: Corinth
Clarus MarketMetrics® 1 of 2 12/12/2010
Information not guaranteed. © 2009-2010 Terradatum and its suppliers and licensors (www.terradatum.com/about/licensors.td).
5 of 6
- 6. Valarie Littles Ultima Real Estate
Months Supply of Inventory
Nov-09 vs. Nov-10: The average months supply of inventory is up 105%
# Units For Sale # UC Units UC Average
Time Period Last Day of Month During Month MSI DOM
Nov-10 150 13 11.5 80
Oct-10 150 20 7.5 84
Sep-10 160 20 8.0 71
Aug-10 158 27 5.9 109
Jul-10 161 26 6.2 60
Jun-10 160 25 6.4 63
May-10 154 31 5.0 66
Apr-10 147 40 3.7 74
Mar-10 139 39 3.6 55
Feb-10 142 25 5.7 70
Jan-10 130 21 6.2 57
Dec-09 123 17 7.2 80
Nov-09 124 22 5.6 80
Clarus MarketMetrics® 2 of 2 12/12/2010
Information not guaranteed. © 2009-2010 Terradatum and its suppliers and licensors (www.terradatum.com/about/licensors.td).
6 of 6